Investment objective
This actively managed equity fund aims to achieve the highest possible capital growth in US dollars.
Key features
While respecting risk diversification, the fund invests worldwide primarily in equities, equity-like transferable securities, participation certificates, and depositary receipts of high-quality companies that offer potential for relatively high long-term earnings growth and above-average profitability. It may invest in China A-shares, subject to a specific limit, and hold concentrated positions in individual companies or industries. It uses its benchmark for performance comparison. The investment team has full discretion.
Approach
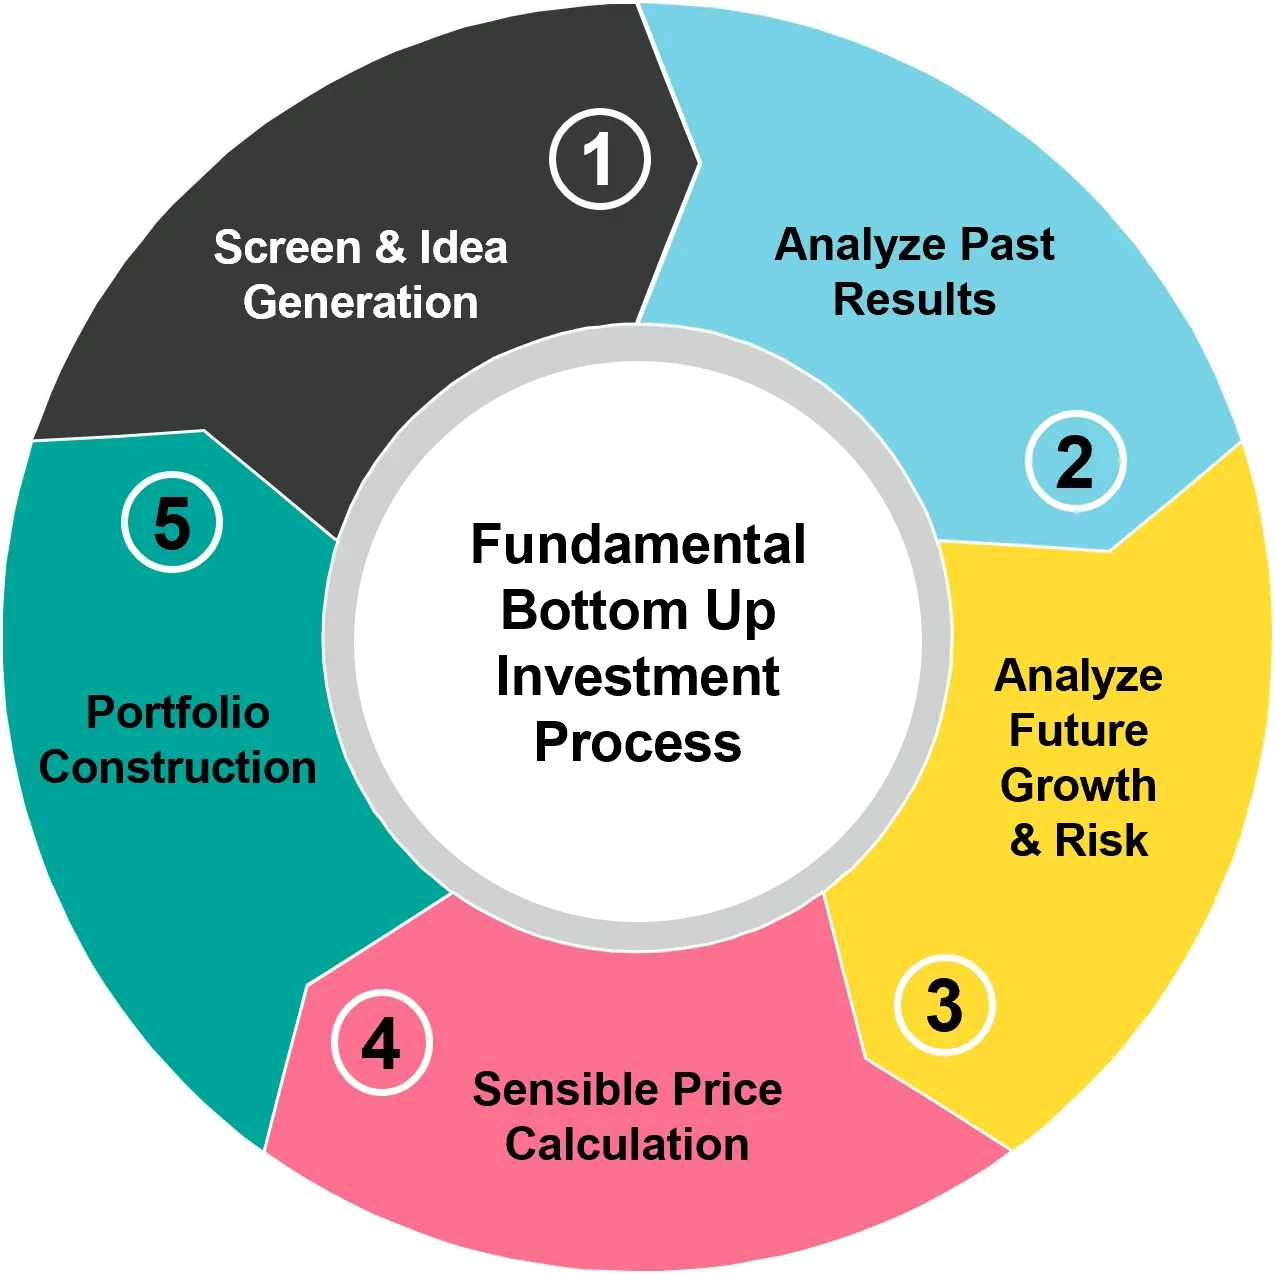
The investment team implements its Quality Growth strategy based on in-depth company research. It considers specific sustainability criteria in assessing potential investments, promoting environmental and/or social characteristics. It dynamically adjusts portfolio positions, striving to participate when markets rise and protect capital when they fall.
Our Global Equity Fund is an actively managed, concentrated portfolio covering both developed and emerging markets. Our approach is based on returns being driven by a long-term investment in companies with relatively stable and predictable earnings growth that can be sustained for extended periods of time. The strategy draws on the expertise of our exclusive 21 strong investment team. ESG is integral to our approach given our focus on relatively stable and predictable ‘quality’ earnings growth combined with long-term holding periods. The fund seeks to promote environmental and social characteristics by employing an exclusion screen, as well as a number of safeguards, and evaluating all investments against sustainability criteria while also providing governance oversight. Additionally, the fund follows an active stewardship strategy through direct engagements with companies and a voting policy to support the goals of the investment style. While the strategy is benchmark agnostic, performance is shown relative to the MSCI All Country World Index.
Investing beyond your borders can help result in attractive performance in the longer run. Here are two reasons why:
The globalization of company revenues
Global companies aren’t bound by geography – not in where they are headquartered, nor in where they derive their income – and reflect an opportunity set for investors that is meaningfully distributed across major regions.
The shifting of regional and country performance
It is impossible to predict which regions or countries will outperform in any given year. Global diversification provides investors exposure through the long-term ups and downs of different markets. In fact, over the past 15 years, no single region consistently claimed top performance, as bull markets have historically alternated among geographies.
All data is as at 31 Jul 2026 unless otherwise indicated.
| 1M | YTD | 1Y | 3 yrs p.a. | 5 yrs p.a. | Since Inception | |
|---|---|---|---|---|---|---|
| AN USD | -3.2% | -1.0% | -2.4% | 6.2% | 2.5% | 89.3% |
| Benchmark | 0.1% | 11.3% | 22.1% | 18.3% | 10.8% | 163.3% |
| 2025 | 2024 | 2023 | 2022 | 2021 | 2020 | 2019 | 2018 | 2017 | 2016 | |
|---|---|---|---|---|---|---|---|---|---|---|
| AN USD | 7.8% | 10.4% | 19.7% | -21.4% | 13.3% | 19.1% | 27.5% | -5.0% | NA | NA |
| Benchmark | 22.3% | 17.5% | 22.2% | -18.4% | 18.5% | 16.3% | 26.6% | -9.4% | NA | NA |
| Portfolio | Benchmark | ||||
|---|---|---|---|---|---|
| Volatility | 11.2% | 12.2% | |||
| Sharpe Ratio | 0.1 | ||||
| Information Ratio | negative | ||||
| Tracking error | 5.4% | ||||
| Beta | 0.8 | ||||
| Active Share (country, issuer, ISIN) | 17% / 78% / 82% | ||||
| [3 years annualized] | |||||
Since fund inception until 31.12.2016, the fund had different characteristics and performance was achieved under circumstances that no longer apply.
All data is as at 27 Aug 2026 unless otherwise indicated.
| Portfolio Manager | Rob Hansen/Ramiz Chelat |
|---|---|
| Fund Domicile | Luxembourg |
| Fund Currency | USD |
| Share Class Currency | USD |
| Year End | 31 August |
| Benchmark | MSCI All Country World Index TR net |
| Share Class Launch Date | 10 Oct 2017 |
| Distribution Type | Distributing |
| Swing Pricing Eligible | Yes |
| SFDR Classification | Article 8 |
| Fund Registrations | AT, CH, DE, DK, ES, FI, FR, GB, IT, LI, LU, NL, NO, PT, SE, SG |
| Share Class Registrations | CH, DE, ES, LU, SG |
| Highest since launch | 197.89 |
|---|---|
| Lowest since launch | 90.59 |
| Fund size in mln. | USD 2,620.71 |
| Share class size in mln. | USD 0.79 |
| Management Fee | 0.82% |
|---|---|
| Max Management Fee | 1.25% |
| TER* | 1.16% (28 Feb 2026) |
| OCF | 1.16% (28 Feb 2026) |
| Luxembourg Taxe d Abonnement | 0.05% |
| ISIN | LU1683485921 |
|---|---|
| CUSIP | L967AR478 |
| Valor | 38261765 |
| Bloomberg | VOGLANU LX |
| WKN | A2JKMQ |
| Investment Manager | Vontobel Asset Management Inc., New York |
|---|---|
| Depositary | State Street Bank International GmbH (Luxembourg Branch) |
| Management Company | Vontobel Asset Management SA, Luxembourg |
| Swiss Paying Agent | Bank Vontobel AG |
| Swiss Representative | Vontobel Fonds Services AG |
| Share class | Currency | ISIN | Distrib. | Type | Launch date | Management Fee | TER* |
|---|---|---|---|---|---|---|---|
| A | USD | LU0218910023 | Distributing | Retail | 1 Jul 2005 | 1.65% | 1.99% (28 Feb 2026) |
| AHG (hedged) | CHF | LU2662990873 | Distributing | Institutional | 31 Aug 2023 | 0.65% | 0.79% (28 Feb 2026) |
| AI | EUR | LU1121575069 | Distributing | Institutional | 24 Oct 2014 | 0.82% | 0.98% (28 Feb 2026) |
| AN | USD | LU1683485921 | Distributing | Retail | 10 Oct 2017 | 0.82% | 1.16% (28 Feb 2026) |
| B | SEK | LU0979498168 | Accumulating | Retail | 15 Oct 2013 | 1.65% | 1.99% (28 Feb 2026) |
| B | USD | LU0218910536 | Accumulating | Retail | 1 Jul 2005 | 1.65% | 1.99% (28 Feb 2026) |
| C | USD | LU0218910965 | Accumulating | Retail | 16 Jul 2007 | 2.25% | 2.59% (28 Feb 2026) |
| G | USD | LU1489322047 | Accumulating | Institutional | 21 Sep 2016 | 0.65% | 0.76% (28 Feb 2026) |
| H (hedged) | SEK | LU0971939599 | Accumulating | Retail | 24 Sep 2013 | 1.65% | 2.02% (28 Feb 2026) |
| H (hedged) | EUR | LU0218911690 | Accumulating | Retail | 2 Nov 2007 | 1.65% | 2.02% (28 Feb 2026) |
| HC (hedged) | EUR | LU0333249364 | Accumulating | Retail | 15 Apr 2008 | 2.25% | 2.62% (28 Feb 2026) |
| HI (hedged) | CHF | LU2243976318 | Accumulating | Institutional | 4 Nov 2020 | 0.82% | 1.01% (28 Feb 2026) |
| HI (hedged) | EUR | LU0368555768 | Accumulating | Institutional | 10 Jun 2008 | 0.82% | 1.01% (28 Feb 2026) |
| HN (hedged) | CHF | LU2277595851 | Accumulating | Retail | 19 Jan 2021 | 0.82% | 1.19% (28 Feb 2026) |
| HN (hedged) | EUR | LU1550202458 | Accumulating | Retail | 31 Jan 2017 | 0.82% | 1.19% (28 Feb 2026) |
| I | GBP | LU0824095136 | Accumulating | Institutional | 14 Nov 2012 | 0.82% | 0.98% (28 Feb 2026) |
| I | USD | LU0278093595 | Accumulating | Institutional | 19 Jun 2008 | 0.82% | 0.98% (28 Feb 2026) |
| N | USD | LU0858753451 | Accumulating | Retail | 3 Dec 2012 | 0.82% | 1.16% (28 Feb 2026) |
Subject to change, without notice, only the current prospectus or comparable document of the fund is legally binding.
* TER includes performance fee where applicable
All data is as at 31 Jul 2026 unless otherwise indicated.
View all documents View latest documents
| Document | Date | DE | EN | ES | FR | IT |
|---|---|---|---|---|---|---|
| Factsheets & Commentaries | ||||||
| Factsheet | Jul 2026 | |||||
| Factsheet | Jun 2026 | |||||
| Factsheet | May 2026 | |||||
| Factsheet | Apr 2026 | |||||
| Factsheet | Mar 2026 | |||||
| Factsheet | Feb 2026 | |||||
| Factsheet | Jan 2026 | |||||
| Factsheet | Dec 2025 | |||||
| Factsheet | Nov 2025 | |||||
| Factsheet | Oct 2025 | |||||
| Factsheet | Sep 2025 | |||||
| Factsheet | Aug 2025 | |||||
| Factsheet | Jul 2025 | |||||
| Factsheet | Jun 2025 | |||||
| Factsheet | May 2025 | |||||
| Factsheet | Apr 2025 | |||||
| Factsheet | Mar 2025 | |||||
| Monthly Commentary | Jul 2026 | |||||
| Monthly Commentary | Jun 2026 | |||||
| Monthly Commentary | May 2026 | |||||
| Quarterly Commentary | Jun 2026 | |||||
| Quarterly Commentary | Mar 2026 | |||||
| View more Factsheets & Commentaries View less Factsheets & Commentaries | ||||||
| PRIIPs KIDs | ||||||
| Key Information Document (KID) | Jul 2026 | |||||
| Legal Documents | ||||||
| AGM EGM invitation | Jan 2026 | |||||
| Articles of Association | Apr 2016 | |||||
| Notification to Investors | Jun 2026 | |||||
| Notification to Investors | Dec 2025 | |||||
| Notification to Investors | Aug 2025 | |||||
| Notification to Investors | Apr 2025 | |||||
| Notification to Investors | Dec 2024 | |||||
| Notification to Investors | Oct 2024 | |||||
| Notification to Investors | Sep 2024 | |||||
| Notification to Investors | Jun 2024 | |||||
| Notification to Investors | May 2023 | |||||
| Notification to Investors | Nov 2022 | |||||
| Notification to Investors | Jan 2022 | |||||
| Notification to Investors | Sep 2021 | |||||
| Notification to Investors | Jul 2021 | |||||
| Notification to Investors | May 2021 | |||||
| Notification to Investors | Mar 2021 | |||||
| Notification to Investors | Feb 2021 | |||||
| Notification to Investors | Nov 2019 | |||||
| Sales Prospectus | Jul 2026 | |||||
| View more Legal Documents View less Legal Documents | ||||||
| Sustainability Related Disclosures | ||||||
| Exclusion Framework | Jan 2026 | |||||
| Periodic Disclosure | Aug 2025 | |||||
| Pre-contractual Disclosure | Jul 2026 | |||||
| Statement on principal adverse impacts of investment decisions on sustainability factors | Jun 2026 | |||||
| Sustainability Related Disclosures | Jan 2026 | |||||
| Swiss Climate Scores | Jul 2026 | |||||
| Financial Reports | ||||||
| Annual Distribution | Nov 2025 | |||||
| Annual Distribution | Nov 2024 | |||||
| Annual Report | Aug 2025 | |||||
| Distribution Dates | Jan 2026 | |||||
| Quarterly Distribution | Jun 2026 | |||||
| Quarterly Distribution | Mar 2026 | |||||
| Quarterly Distribution | Dec 2025 | |||||
| Quarterly Distribution | Sep 2025 | |||||
| Quarterly Distribution | Jun 2025 | |||||
| Quarterly Distribution | Mar 2025 | |||||
| Quarterly Distribution | Dec 2024 | |||||
| Quarterly Distribution | Sep 2024 | |||||
| Quarterly Distribution | Jun 2024 | |||||
| Quarterly Distribution | Mar 2024 | |||||
| Semi-Annual Report | Feb 2026 | |||||
| Semi Annual Distribution | Apr 2026 | |||||
| Semi Annual Distribution | Apr 2025 | |||||
| Semi Annual Distribution | Apr 2024 | |||||
| Semi Annual Distribution | Apr 2023 | |||||
| View more Financial Reports View less Financial Reports | ||||||
| Dealing Information | ||||||
| Holiday Calendar 2026 | Jan 2026 | |||||
| List of Active Retail Share Classes | Jan 2025 | |||||
| Policies | ||||||
| Sanctioned Countries | Oct 2022 | |||||
| Shareclass Naming Convention | Jan 2026 | |||||
RISKS
When seeking to achieve its investment objective the Sub-Fund is subject to General Risks, to Investment Fund Risks, to Investment Management Risks and to Other Risks. Investing in the Sub-Fund implies the following risk factors which are described in detail in the section Risk Factors of the Sales Prospectus.
Investment Fund Risks
There is no guarantee that the fund will achieve its investment objective or that you will get back the amount you originally invested.
The value of your investment can go up or down in response to changes in economic conditions, interest rates, exchange rates, or company creditworthiness. Events such as pandemics, wars, or natural disasters can cause significant and unpredictable market disruptions worldwide.
If a key service provider (such as the investment manager or depositary) fails or becomes insolvent, this could cause delays in processing your transactions or result in financial losses for the fund.
In difficult market conditions, it may not be possible to sell certain investments quickly or at a fair price, which could mean the fund is unable to meet your redemption request promptly or may have to apply tools such as temporary restrictions on withdrawals.
Investment Management Risks
Shares in companies can fall in value at any time, and there is no guarantee of returns; while equities have historically offered higher long-term returns, they also carry higher short-term risk.
REITs can fall in value due to declining property prices, rising interest rates, increased operating costs, or poor management quality. These factors directly reduce the value of the underlying real estate and therefore the REIT securities held by the fund
Derivatives such as options, futures, and swaps can magnify gains but also amplify losses, and if used incorrectly or in unfavourable market conditions could result in substantial or total loss. There is also a risk that the counterparty to a derivative contract defaults on its obligations, further increasing potential losses.
Investing in emerging markets carries greater risks than developed markets, including less stable governments, weaker regulatory oversight, lower liquidity, and restrictions on moving money in and out of the country. These factors can result in significant price swings and potential losses.
Investing in Chinese securities via programs such as Stock Connect or Bond Connect involves unique risks including currency controls, regulatory uncertainty, complex tax rules, trading restrictions, and potential difficulties in enforcing ownership rights. The regulatory environment in China can change with limited notice and may have retrospective effect, adversely impacting the fund.
When the fund invests in assets denominated in a different currency to the fund's reference currency, movements in exchange rates can increase or decrease the value of your investment independently of how the underlying assets perform. Not all currency exposure may be hedged.
Applying ESG (environmental, social, and governance) criteria may cause the fund to avoid certain investments or sectors, which could positively or negatively affect performance compared to funds that do not apply such criteria. ESG data from third parties may be incomplete or inaccurate, and there is no universally agreed standard for what qualifies as a sustainable investment.
Other Risks
The fund's investment strategy may result in significant holdings in a small number of sectors or companies, which could make its value more volatile than a more broadly diversified fund.
Environmental, social, or governance events (such as climate change, social controversies, or poor corporate governance) can negatively impact the value of the fund's investments.
Any of these risks could cause a Sub-Fund to lose money, to perform less well than similar investments, to experience high volatility of the Share price, or to fail to meet its investment objective over any period of time. It cannot be guaranteed that the investor will recover the capital invested.
Subject to change, without notice, only the current prospectus or comparable document of the fund is legally binding.
Neither the Sub-Fund, nor the Management Company nor the Investment Manager make any representation or warranty, express or implied, with respect to the fairness, correctness, accuracy, reasonableness or completeness of an assessment of ESG research and the correct execution of the ESG strategy.
Any index or supporting data referred to is the intellectual property (including registered trademarks) of the applicable licensor. Any product based on an index is in no way sponsored, endorsed, sold or promoted by the applicable licensor and it shall not have any liability with respect thereto. Refer to vontobel.com/terms-of-licenses for more details.
Morningstar rating: © 2026 Morningstar, Inc. All rights reserved. The information contained herein: (1) is proprietary to Morningstar and/or its content providers; (2) may not be copied or distributed; and (3) is not warranted to be accurate, complete, or timely. Neither Morningstar nor its content providers are responsible for any damages or losses arising from any use of this information.