Quality Growth
Global equities specialists since 1984. We provide a boutique investment experience for institutional and intermediary clients around the world.

Machine intelligence may be the fastest-declining industrial input in modern history. The cost of AI inference has fallen roughly 99 percent in three years, a decline rivaled only by genome sequencing during its steepest stretch, and it never had a trillion dollars of capital riding on it. Yet the world’s largest technology companies are committing capital to AI infrastructure at a scale with even fewer precedents.
Are these two facts complementary or contradictory? That is the central question in technology investing today. This article aims to give readers the tools to answer it for themselves. We examine the industry's structure, token economics, the open-versus-closed divide, and how cheaper intelligence meets a constrained supply of compute. Where the debate is unsettled, we present both sides.
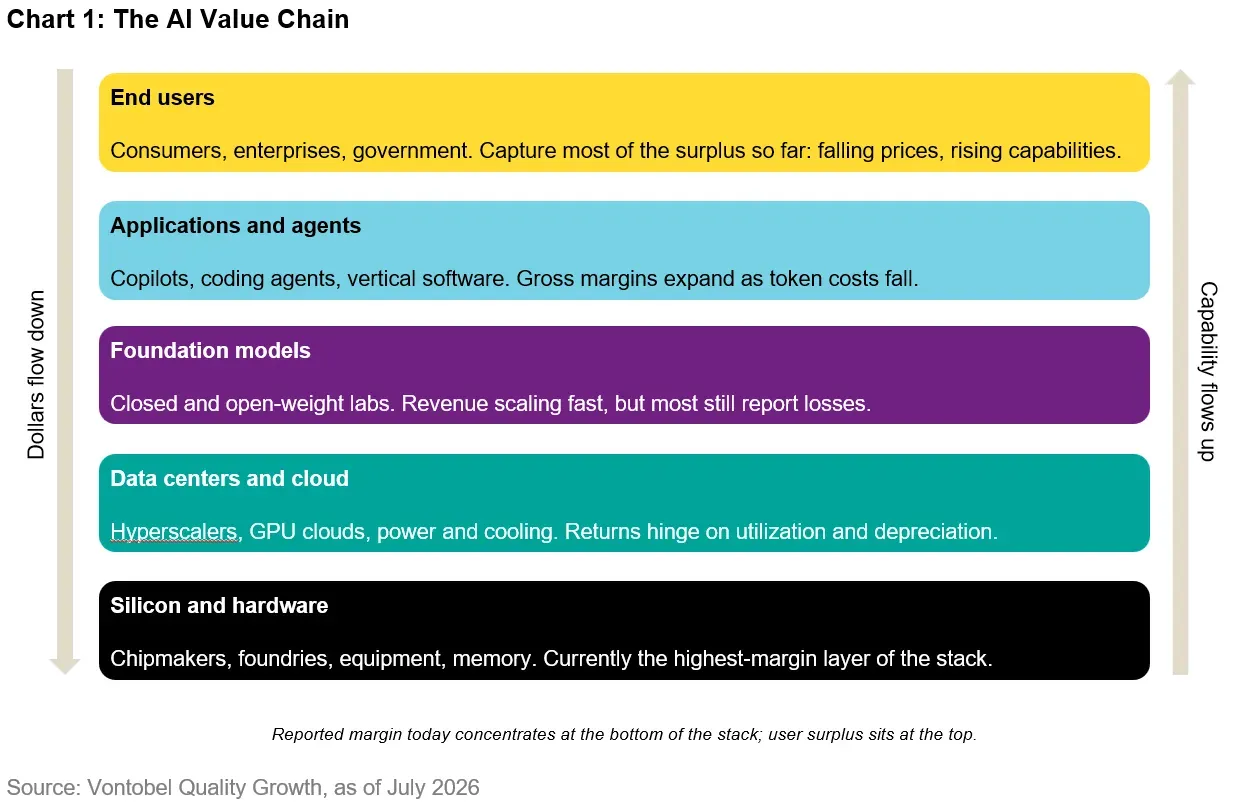
The AI economy can be viewed as a five-layer stack. End users pay applications, applications pay foundation model labs for tokens, labs rent compute from cloud and data center providers, and the clouds buy silicon. Reported margins are concentrated at the bottom of the stack: a leading chipmaker earns gross margins well above historical semiconductor norms, while most foundation model labs continue to report operating losses despite multibillion-dollar revenue run rates. Users, meanwhile, capture a surplus that appears on no income statement. That is worth keeping in mind whenever AI capex is compared with recognized AI revenue: the comparison excludes the layer that is winning. The boundaries between layers are blurring, too: several companies now operate silicon, cloud, model, and application businesses at once.
Every price, margin, and capital decision in this industry traces back to tokens, the small chunks of text that models read and write. Model usage is billed per million tokens, and output tokens cost several times more than input tokens. Reading text is cheap for a model, writing it is the expensive part. Training a frontier model (the industry's term for the most capable current models) is a one-time, capital-heavy expense; inference (using the model day to day) is the recurring cost. The balance of compute demand is shifting from training toward inference. Deloitte forecasts inference will account for roughly two-thirds of AI compute in 2026, up from about one-third in 2023, and McKinsey projects the shift to continue through the decade1. A further driver is agents, autonomous workflows that chain together many model calls per task and consume far more tokens than a simple chatbot exchange. Token bills increasingly scale with autonomy, not headcount.
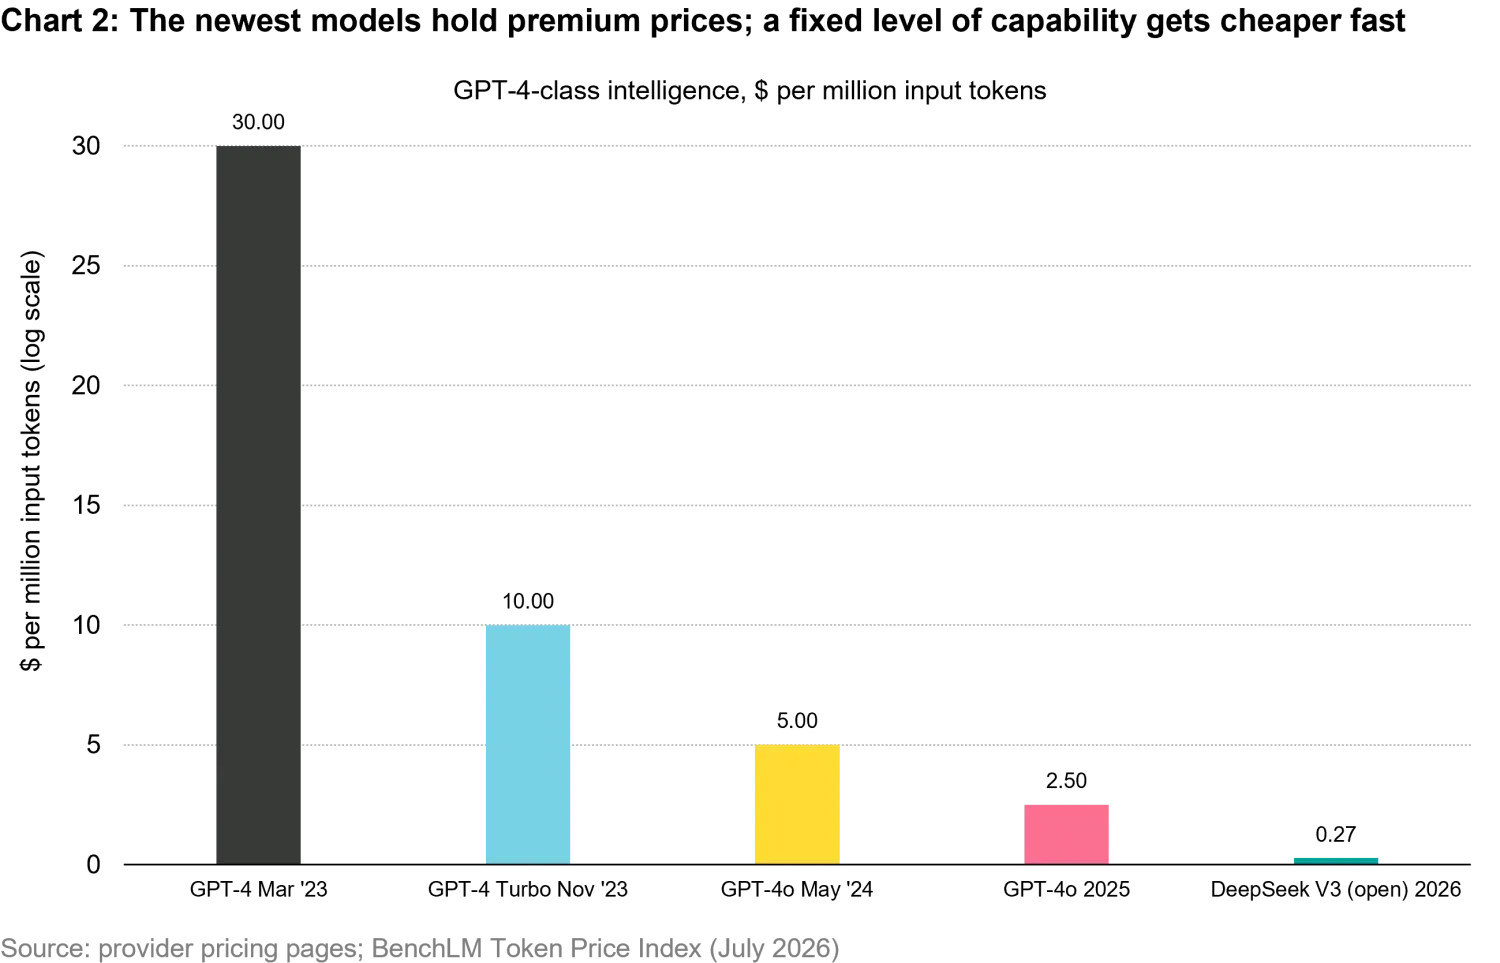
The cost of a fixed level of machine intelligence has fallen roughly two orders of magnitude in three years. At the time of launch in 2023, access to GPT-4-class capability cost USD 30 per million input tokens. Open-weight models now offer comparable capability for well under a dollar. Two things are true at once: the newest frontier models still command premium prices, while last year's frontier models have become this year's commodity. Deflation happens through that hand-off. The mechanisms are a mix of engineering and competition. New models are trained to mimic bigger ones at a fraction of the cost, chips run cheaper math, repeated work is stored rather than recomputed, and open-weight releases set a falling price floor, on top of hardware that gets cheaper to run with each generation.
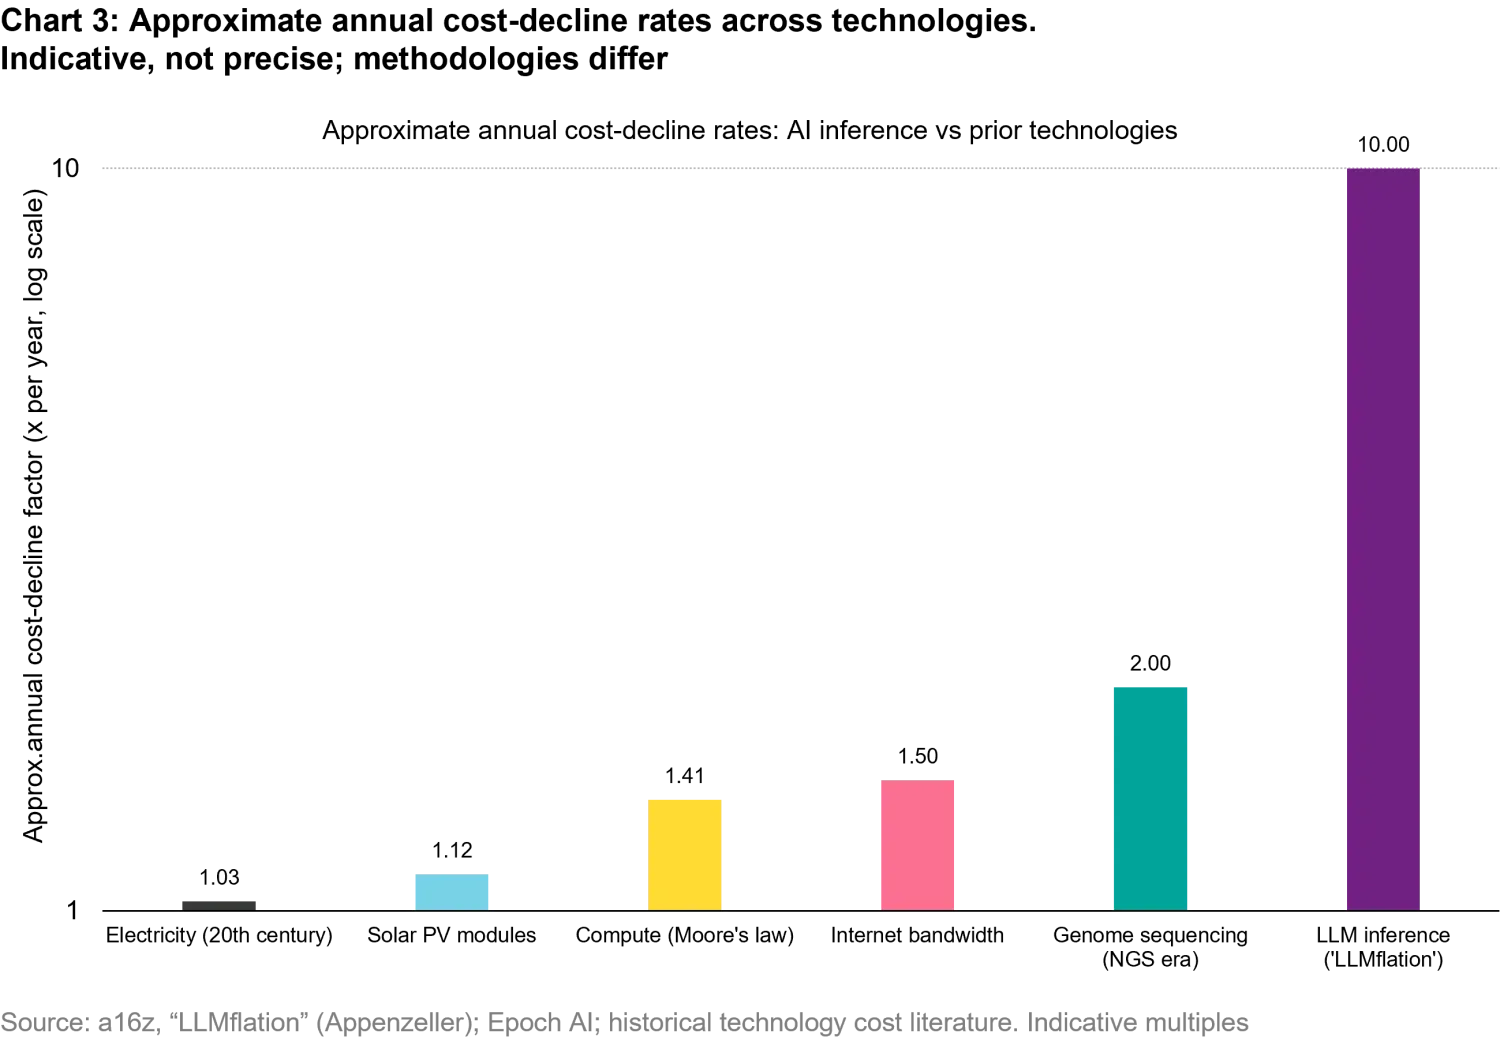
How unusual is that pace? Venture firm Andreessen Horowitz has dubbed the phenomenon LLMflation and estimates that the cost of a given level of language model capability has been falling by roughly a factor of ten each year. By comparison, Moore's Law reduced the cost of compute by about half every two years. Genome sequencing in its best decade and internet bandwidth prices fell somewhat faster than that, while the costs of solar modules and electricity fell much more gradually. None came close to a tenfold annual decline. These comparisons are inherently imperfect, in our view: methodologies differ across studies, and Epoch AI's estimates span a wide range depending on the benchmark used. Many forecasters expect the pace of AI cost declines to moderate as the easiest optimizations are exhausted, but most published estimates still place recent declines well above the historical curves. We believe the direction of travel matters more than the multiple.
The two philosophies have now evolved into competing business models. Closed labs lead the hardest reasoning and agent tasks per benchmark trackers. Where usage sits depends on where you measure. Research from MIT Sloan and Georgia Tech estimates that closed models still account for roughly 80 percent of global token usage, reflecting usage that flows directly through the major chatbots. On open model marketplaces, the picture has already reversed. According to data from OpenRouter, a marketplace where developers choose among many systems, open-weight models, led by Chinese labs, now account for the majority of token volume while generating a small minority of spend.
Usage share and revenue share are diverging. Published benchmark evaluations suggest that leading open-weight models can approach the performance of frontier closed models at launch, narrowing the remaining gap within months at roughly one-tenth of the price. So, who is winning? It depends on what you count. Closed labs sell the token itself and rely on a frontier premium to fund their training bills. Open-model players monetize around the model: hosting, hardware, ecosystems, advertising businesses that benefit from cheap AI, and national strategy.
The durability of the capability gap remains contested. Epoch AI's public-benchmark tracking suggests that open models trail frontier by about four months, while analyses using private benchmarks, tests the models have never seen and cannot have memorized, suggest a substantially wide gap. Epoch AI itself notes its estimate likely understates the gap.
In our view, the bear case writes itself: collapsing prices destroy the revenue needed to justify the AI buildout. The rebuttal is older than the industry itself. Jevons paradox holds that when a resource gets cheaper, total spending on it can rise because usage expands, as happened with coal in the 19th century and with computing more recently. Which force wins here? The data available so far sides with Jevons. Corporate card data from Ramp, a business payments platform, shows enterprise token consumption up roughly tenfold in a year and a half, with total spend more than quadrupling even as prices fell sharply, and sell-side forecasts see agent-driven usage multiplying token demand more than twentyfold by 2030. The caveats are real: Ramp's data covers a largely US mid-market customer base, adoption is concentrated among heavy users, and agent demand forecasts assume reliability gains not yet demonstrated at scale.
A second dynamic is receiving less attention. The supply of compute is currently constrained, and that shapes how deflation propagates through the stack. The Uptime Institute estimates roughly half of recently announced large data center projects will be delayed or will not proceed, and Microsoft has disclosed a USD 80 billion Azure backlog it cannot fulfill for power reasons. When supply is the binding constraint, the market price of inference is set by the scarcity of GPU-hours and megawatts rather than by the license cost of the model.
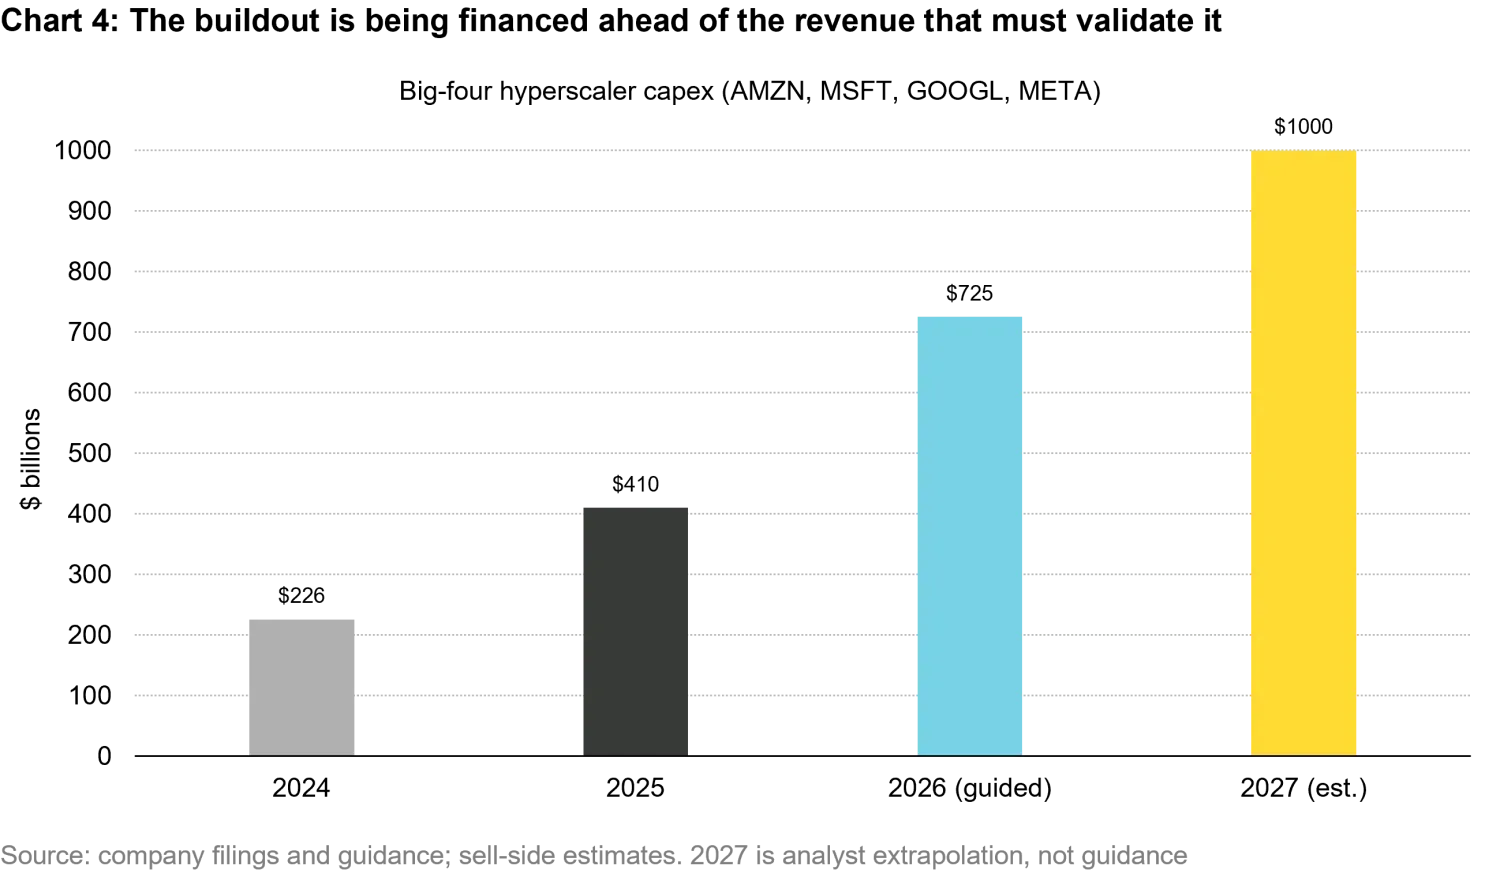
So does cheap open intelligence break the hyperscalers, the giant cloud platforms of Amazon, Microsoft, Google, and Meta? Only if compute is abundant, in our view. Every hyperscaler can download the same open-weight model and resell inference on it, so an abundance of compute would point toward aggressive price competition. While demand exceeds effective supply, however, the scarce asset earns the economic rent regardless of how cheap the model becomes, and falling model prices may compress undifferentiated model sellers while leaving capacity owners' economics intact. If supply catches up or usage stops responding to lower prices, the same open-weight availability becomes the catalyst for a genuine price war, and the revenue per GPU-hour needed to cover depreciation would come under pressure. Even then, two nuances soften the simplest math. First, the buildout is still funded mostly from operating cash flow, though planned spending in 2026 absorbs nearly all of it. Debt is rising at the margin and is concentrated among newer entrants rather than the Big Four. And second, scarcity itself extends the economic lives: Nvidia's 2020-generation chips are still generating revenue in production data centers today, so current depreciation schedules may prove conservative while supply stays tight. Both cushions are poised to shrink if supply loosens. The scale of the wager, either way, is visible in the capex line.
Rather than predict a single outcome, it may be more helpful to map the two main uncertainties: whether closed models keep their capability lead and whether prices keep falling. Crossing them yields four possible pathways, each with its own winners and signposts.
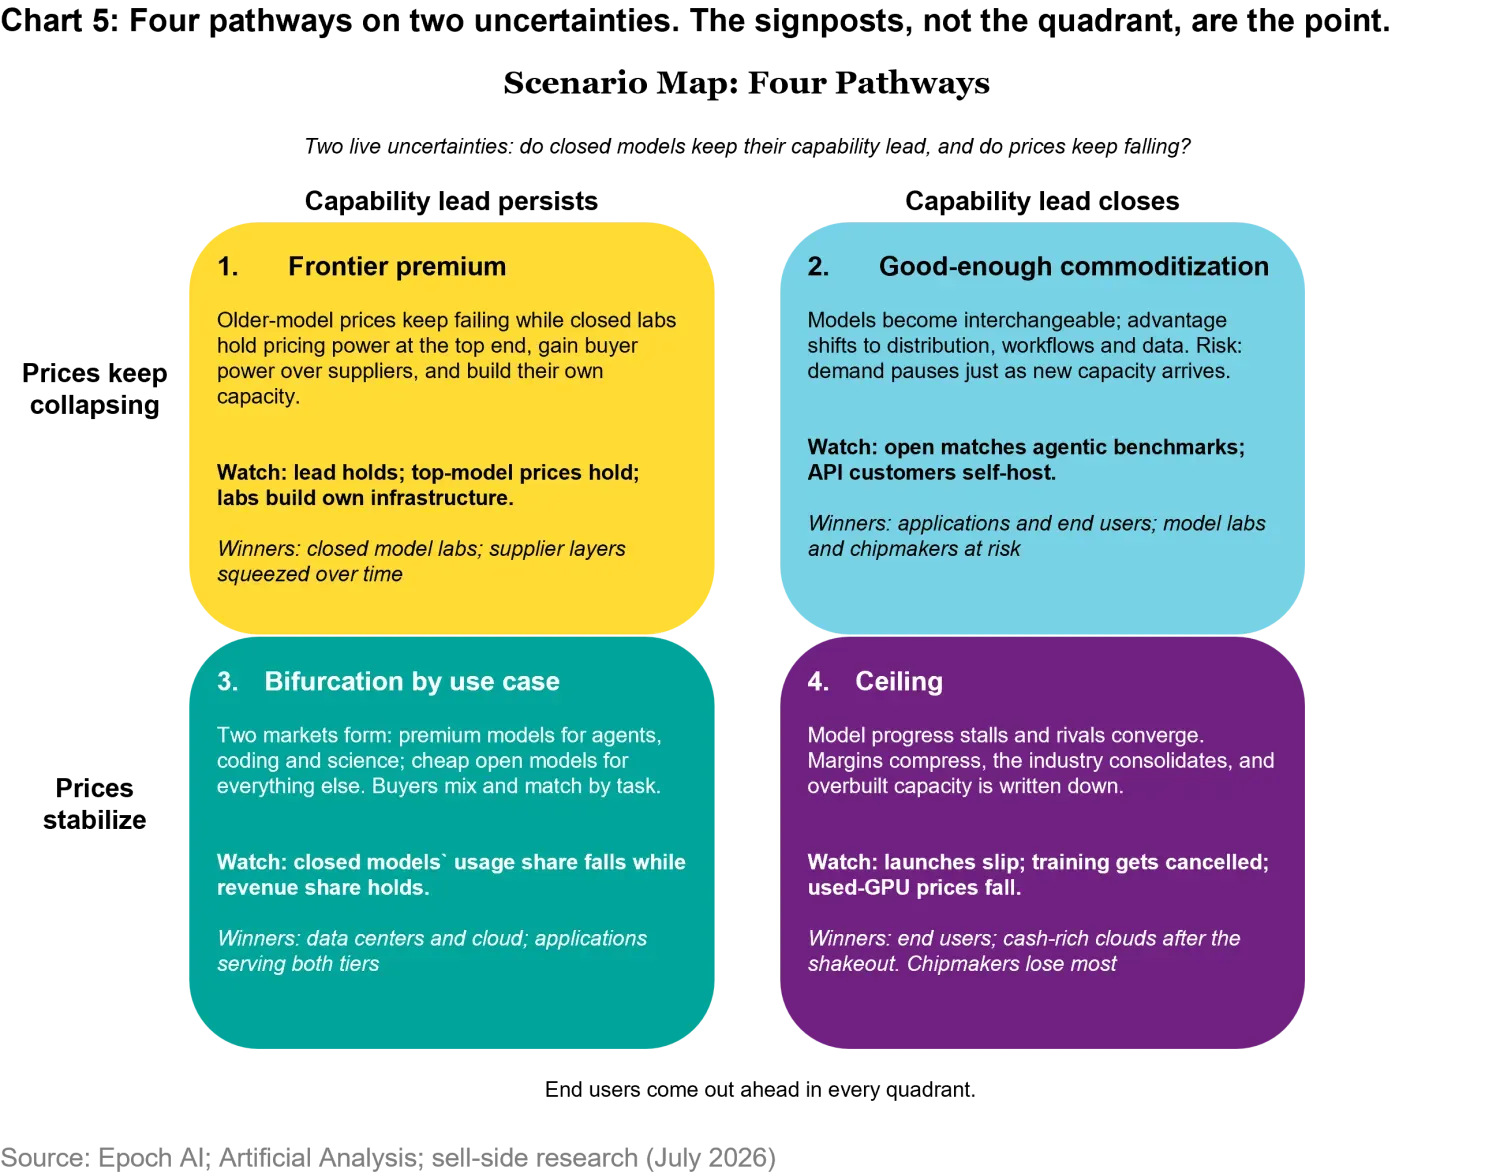
One caveat on Chart 5: it treats compute supply as a background variable. If aggregate supply stays constrained while Jevons-style demand holds, market prices can stabilize because scarcity keeps them firm, not because deflation has run out. The same row is reached by two different routes, with opposite implications for the companies building the capacity.
Nobody knows which quadrant will materialize; the signposts are the point. Supply-side indicators cut across all four scenarios: power availability, revisions to hyperscaler guidance, GPU resale prices, and extensions to the assumed useful lives of hardware. Movement in two or more signposts together would likely meaningfully shift the probabilities. End users come out ahead in every quadrant – the debate is how the rest of the value chain splits the remainder.
Intelligence is the first industrial input we know of whose price has deflated this fast while attracting this much capital. The wager is that usage growth will more than offset falling prices. History offers support for both sides of the debate: technology deflation has repeatedly expanded markets, and capacity built ahead of demand has often taken years to absorb. Which pattern this cycle follows likely depends on the interaction of three uncertainties: the durability of closed models' capability lead, whether usage keeps growing faster than prices fall, and when compute supply catches up with demand.
1. Deloitte TMT Predictions 2026; McKinsey (Feb 2026)
Sources: company reports, guidance, and earnings disclosures; a16z, LLMflation (G. Appenzeller); Epoch AI; BenchLM Token Price Index (Jul 2026); Deloitte TMT Predictions 2026; McKinsey (Feb 2026); Ramp AI Index (Apr 2026); OpenRouter; Uptime Institute; MIT Sloan and Georgia Tech research; Gartner; Sequoia Capital; sell-side and credit research (2025-2026). Full attribution and chart data are provided in the accompanying workbook. This material is for informational purposes only and does not constitute investment advice or a recommendation to buy or sell any security. Figures described as indicative are order-of-magnitude illustrations drawn from third-party estimates.