


Quantitative Investments
Your partner for leading quantitative investment solutions.
The September Fed policy meeting took market participants by surprise with its hawkish tilt. Less surprising was the decision to keep the Fed funds rate unchanged for September, while leaving the door open for another rate hike in 2023. The real shocker came from revised economic forecasts for 2024, which in turn led to a revision of the predicted Fed funds rate. With near-term recession risks diminishing, the Fed's real GDP nowcast projects the current rate of growth at 5.6%. As a result, policy rate cuts for next year appear less urgent. This lends credence to the Fed's official communiqué that rates will 'remain higher for longer,' backed by the FOMC's prediction of a mere 50 basis-point cut in 2024, as opposed to the 100 basis-point cut projected in June.
These forecast revisions align with the market correction trend observed in the first half of August, specifically the repricing of rate expectations for 2024 and 2025. The question now is whether the Fed's willingness to keep rates 'higher for longer' is a calculated risk in combating inflation or a policy misstep. Our quantitative models suggest that the resilience of consumers1 and relatively healthy balance sheets of systemically relevant banks2 argue for low recession risks in the coming months. However, this does not mean that a recession is entirely off the table, especially in the first half of 2024. In fact, if history serves as a guide, a recession should still be considered the base case. As we demonstrated in August3, it's only now that the likelihood of a recession is rising to meaningful levels. Given the variable lagged effects of monetary policy, our models see the window for a potential recession remaining open until summer 2024.
As for our equity allocation model, it believes that 'the sands of time are still trickling, not pouring. Therefore, it has gradually reduced the equity overweight over recent months. The economic resilience and the risk of persistent inflation4 have triggered a repricing of rate expectations, causing bonds to suffer. Our bond allocation model caught this trend and has been underweight in government bonds since then. However, like the equity allocation model, it slowly reduces the underweight in the current sell-off. This decision is currently supported by our risk model, which sees rising similarities with 2006 and 2018 - years when policy tightening cycles should have ended sooner, in retrospect, or were even a policy mistake.
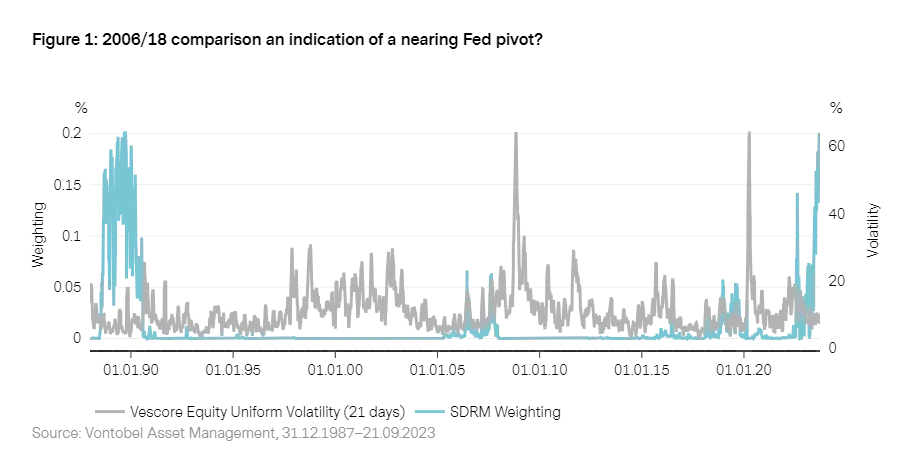
For our risk model SDRM5 the late 80s are still the most relevant time period for the assessment of today’s risk environment. However, the years 2006 and 2018 are now taking on a more prominent role in the model's search for historical parallels. This is because some of the variables that the model looks at are gradually retreating from extreme levels6. Indicators like the market volatility index and the short-term interest rate trend remain elevated, but recent mean-reverting tendencies have moved them away from the extreme numbers previously seen only in the 1980s.
Therefore, 2006 and 2018 are moving into the spotlight as they now reveal valuable information for today's environment. In both of these years, the US experienced the end of multi-year policy tightening cycles. While it's true that these past cycles were less aggressive than the current one and the one in the 1980s, our model focuses on the trend of short-term interest rates, rather than their absolute levels. As such, the growing resemblance to 2006 and 2018 can be interpreted as a sign that the current policy tightening cycle may be winding down. The September FOMC meeting has kept the possibility of another rate hike later this year on the table, but there are increasing indications that that could then be the final hike.
5. More information on our SDRM model can be found in
Risk Management: Forward on calm seas, adaptive and agile in stormy phases
6. Our SDRM model compares the current market environment with the past on the basis of the dividend yield, credit spread, TED spread, term spread, short term interest rate and two volatility measures.
The global wave7 indicates that the global economy is back on the recovery track, thanks to heavyweights like the US and China. While developed markets have been in recovery for some time, emerging markets have only recently joined the club. However, with global liquidity conditions remaining tight, the risk of slipping back into contraction is high - 52% for developed markets and 41% for emerging markets. In developed markets, the real money supply (M1) is contracting by -12.4% y-o-y, similar to trends observed in the 1980s. A closer look at the indicators reveals that banking sector activity remains weak, and tight lending standards in major economies are dampening growth momentum.
Developed markets continue to show signs of recovery despite tight liquidity conditions. After the most-followed US leading indicator (ISM new orders) dipped in May to January lows, US growth momentum has recently accelerated. The Atlanta Fed's nowcast, which measures the run rate of US real GDP growth, stands at 5.6% as of September. The most notable observation in developed markets is the sluggish growth momentum in Europe. Currently, only 22% of indicators in the European Monetary Union (EMU) show an accelerating trend. Among the 50 countries under coverage, the EMU ranks among the lowest, with Finland and heavyweight Germany showing the weakest readings. For Germany, both banking sector activity and the housing market are dragging down the economy, with year-over-year residential house prices at a historically weak -5%.
Stimulus measures are finally taking hold in China. Monetary policy has been supportive for some time, but high economic leverage and increased risk aversion among banks, due to housing market turmoil, had made monetary policy less effective. Recent additional measures, such as relaxed housing regulations in several regions and increased fiscal spending, may finally tip the scales this time. High housing inventories and the government's medium-term plan to reduce economic leverage argue against a strong recovery but support the case for a moderate one. Another key observation this month is the loss of growth momentum in Latin America, particularly in Brazil and Mexico. Aggressive policy tightening in 2022-2023 appears to be starting to weigh on growth in both countries.

7. For further detail see The Vescore Wave – a superior business-cycle model
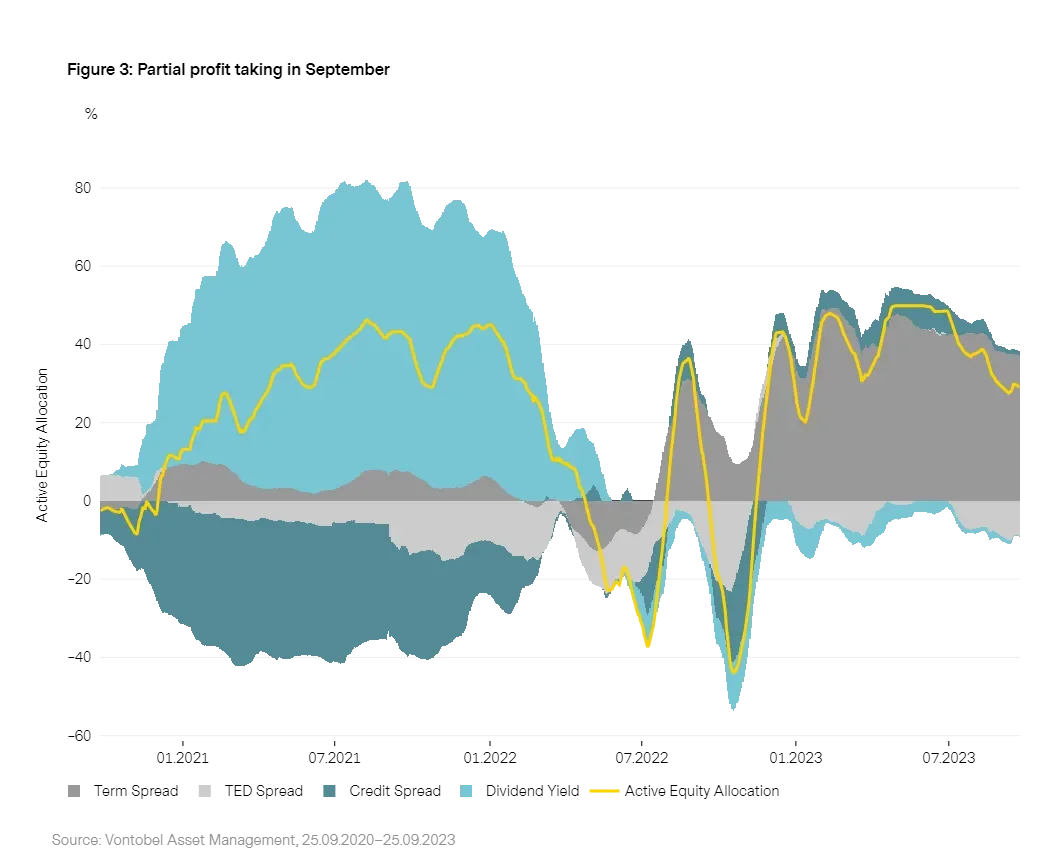
Over the past few weeks, our equity allocation model GLOCAP, has further reduced its equity allocation (as shown in Figure 4). This comes after maintaining a maximum equity allocation until late June 2023. Compared to last month, the reduction has been primarily driven by changes in the TED spread and the term spread, the latter being the main contributor. The negative impact of the dividend yield has lessened since August, thereby moderating the equity reduction caused by the other two components.
Given the recent positive trends in the equity environment, the model's reduction can be seen as a form of partial profit-taking. A case in point is the term spread. Stronger U.S. economic data in September led to a normalization of the inverted yield curve, resulting in a decreased allocation contribution from the term spread. Additionally, a tighter TED spread, falling dividend yield, and narrowing credit spread have also reflected the generally positive risk environment between late August and September.
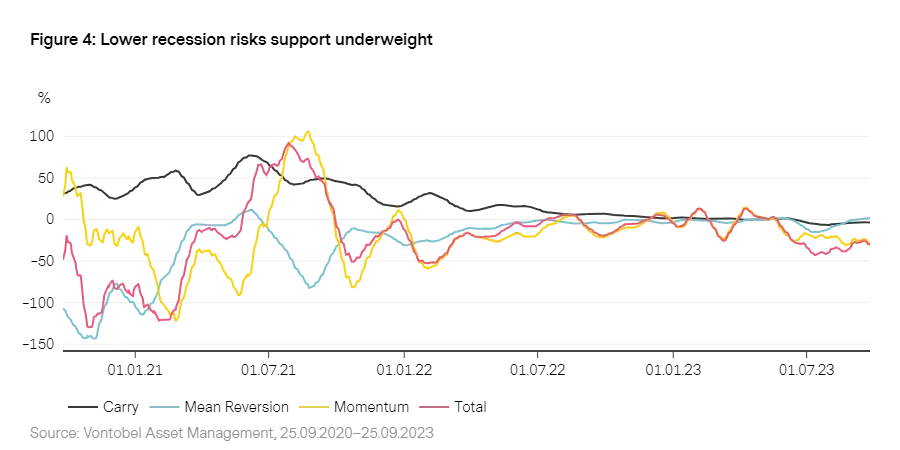
Our bond allocation model has continued to reduce its underweight position in bonds, effectively reducing the underweight as bonds became cheaper. Momentum is the most significant contributor to the underweight position but to a lessening degree, as illustrated in Figure 4. Geographically, the model maintains a 9% underweight stance in both the US and Canada. The UK is the exception, where our model currently holds a marginal overweight position.
In all markets covered by our model - except for the UK - yield curves have shifted upward, reflecting the improving economic environment in developed markets. Lower recession risks in countries like the US have led to a repricing of rate expectations for 2024 and 2025. In the US, easing expectations for 2024 have been revised downward to just 50 basis points. Meanwhile, the hawkish tone of the September Fed meeting keeps the possibility of another rate hike in 2023 on the table.
The Federal Reserve rightly acknowledges the progress made so far in its fight against inflation. However, the Fed consistently emphasizes that declaring victory against inflation already now would be premature. In a research report earlier this year, we highlighted several factors that could make inflation more persistent this time around, keeping central banks on their toes for an extended period8. Among these factors are the fading prospects of fiscal austerity, as governments grapple with challenges such as increased defense spending, rising healthcare costs due to an aging population, and the transition to renewable energy. Our analysis last month confirmed that fiscal spending is indeed on the rise in major economies9. History teaches us that a successful fight against inflation often requires a combination of tight monetary policy and prudent fiscal management.
Our statistical analysis on the trajectory of inflation following its peaks led us to several conclusions:
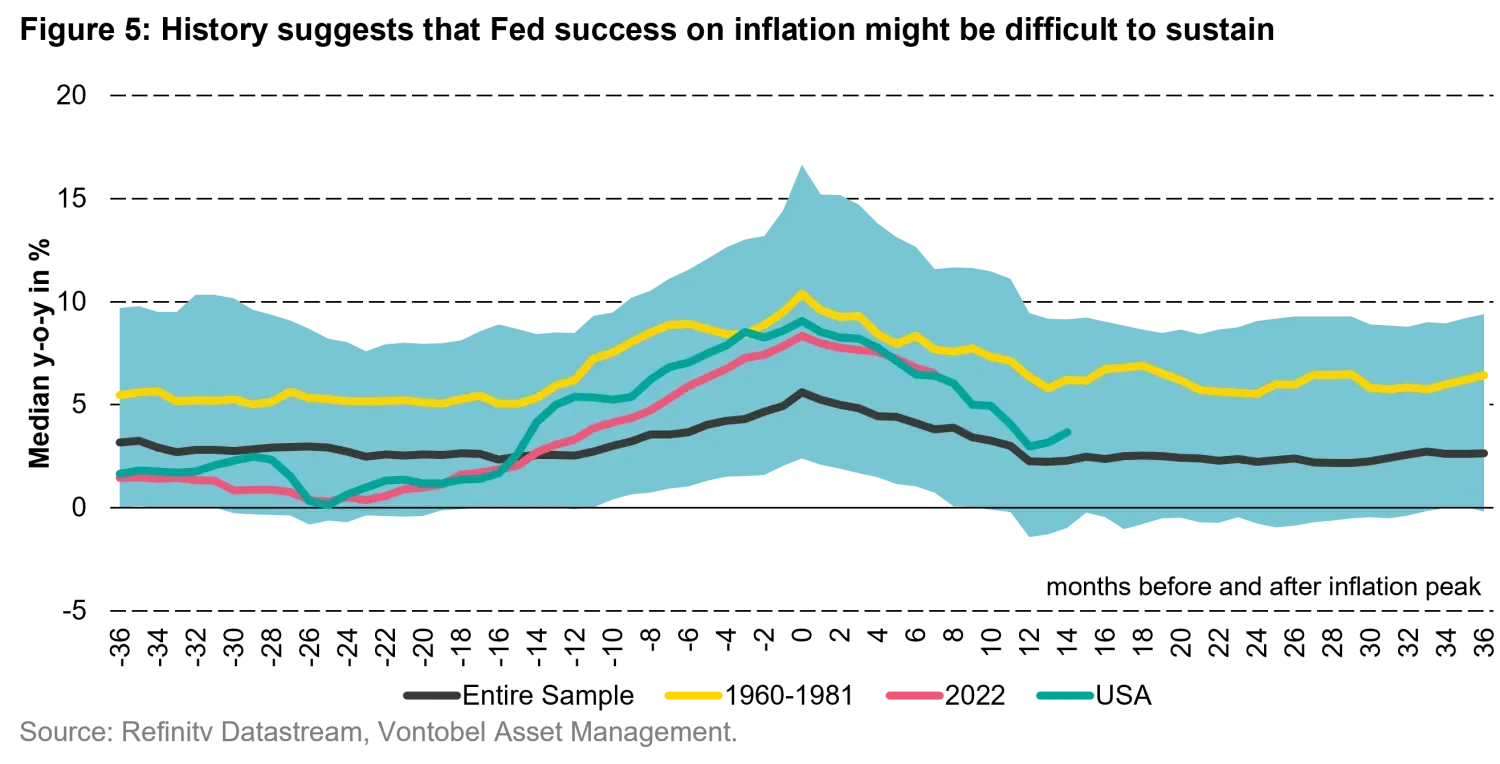
Given the relatively high peak in inflation, there's a significant risk that inflation will not fall to or below target levels in the foreseeable future. Figure 510 shows that the US has made better progress since its 2022 peak than historical trends would suggest11. However, a sustainable return to target levels is far from guaranteed, with significant implications for investors12. Factors such as the recent surge in commodity prices and the aforementioned structural inflationary trends could limit the pace of inflation's decline going forward. Or, as my colleagues would put it, these factors could trigger a second wave of inflation13.
8. See
Six reasons why inflation may feel like gum on your shoe
9. See
September edition
of our Global Market Outlook.
10. In this chart we analyze inflation data for ten developed markets since 1910 (if data is available). This allows us to study inflation trends around 166 inflation peaks.
11. Progress for developed markets in general is more limited. The magenta-colored line shows that the progress is (at best) in line with what history suggests. Japan is the reason why the time series ends earlier than the US time series. Japan had its peak only six months ago, which is why the series for developed markets ends six months after the peak.
12. In a
2022 research paper
we concluded that more persistent inflation may lead to higher rate, financial market and business cycle volatility as well as more persistent positive correlation of equity and bond returns.
13. See
How likely is the dreaded second wave of inflation?
1. See the
July edition of our GMO
.
2. In the
April edition of our GMO
we showed our Developed Market Banking Sector Vulnerability model and concluded, that systemic risks have significantly fallen since the Great Financial Crisis in 2007/08.
3. In the
August edition of our GMO
we showed that most of our models signal that we are slowly approaching the phase in which a recession becomes more likely.
4. See last current topic “Balancing progress and caution”.
Important Information: Past performance is not a reliable indicator of current or future performance. Indices are unmanaged; no fees or expenses are reflected; and one cannot invest directly in an index
Any projections or forward-looking statements herein are based on a variety of estimates and assumptions. There can be no assurance that estimates or assumptions regarding future financial performance of countries, markets and/or investments will prove accurate, and actual results may differ materially. The inclusion of projections or forecasts should not be regarded as an indication that Vontobel considers the projections or forecasts to be reliable predictors of future events, and they should not be relied upon as such. Diversification and/or asset allocation neither assures a profit nor eliminates the risk of investment losses.
Vontobel reserves the right to make changes and corrections to the information and opinions expressed herein at any time, without notice. This document is for information purposes only and does not constitute an offer, solicitation or recommendation to buy or sell any investment instruments, to effect any transactions or to conclude any legal act of any kind whatsoever.


