Rich or right?
Quantitative Investments
1. Introduction
On a cold evening in New York about 15 years ago, as I carried myself through the lobby of the apartment complex where I used to live, somewhat aggravated by the events of the day, a highly perceptive acquaintance of mine approached me saying: “Andrea, what’s up? You seem concerned.” To which I answered that “a couple of positions in my portfolios are going horribly wrong.” His answer: “Relax Andrea, do you want to be rich or right?” That sentence stuck with me to this day.
Learning from Federer
To understand why this question matters, consider what Roger Federer and the S&P 500 have in common. Roger Federer, one of the greatest tennis players of all time, has a match win rate of around 80%, meaning he has won 4 out of every 5 matches over the course of his illustrious career.1 Similarly, the S&P 500 has posted positive annual returns roughly 75% of the time since the 1950s. Despite these high annual success rates, both Federer and the S&P 500 exhibit a much lower hit rate when looked at in finer granularity. Federer’s points won during matches stands at around 54%, meaning he wins just over half the points played. Similarly, for the S&P 500, only about 54% of trading days show gains.2
These examples highlight an important truth: success does not require winning every single point or day. Instead, it requires winning enough—and, crucially, ensuring that the magnitude of your wins outweighs your losses. Federer’s 54% hit rate on points translates into an 80% match win rate because he wins the points that matter most. Similarly, the S&P 500’s long-term profitability stems from outsized gains during positive years, which compensate for smaller losses during negative ones. These dynamics reflect the same statistical relationship between hit rates (“how often am I right?”) and win-loss ratios (“how much do I win when I’m right compared to how much I lose when I’m wrong?”).
A successful portfolio, much like Federer’s career or the S&P 500’s historical trajectory, needs to get enough positions right to be profitable. It does not need to get them all right. Some positions will always go wrong at any given point in time. But how much is enough?
In this article, we will address precisely those questions. Specifically, we will discuss a formula that ties hit rates (“how often am I right vs. wrong?”) and win-loss ratios (“by how much am I right when right vs. wrong when wrong?”) to a newly defined metric (relative gains) measuring overall portfolio profitability. We will also show that, in most cases, working on improving hit rates has a higher impact on net gains compared to working on improving win-loss ratios. In our view, for any portfolio manager seeking to get better, this means that security research (which is more closely tied to hit rates) is more important than portfolio construction (which is more closely related to win-loss ratios).
2. The formulas
The profit and loss (P&L) of a portfolio (\(p\)) during a period can be expressed as:
\[ p = \sum_{i=1}^{n^{+}} p_i^{+} + \sum_{i=1}^{n^{-}} p_i^{-} \tag{1} \]
where \(n^{+}\) and \(n^{-}\) are the numbers of profitable and unprofitable positions, respectively, and \(p_{i}^{+}\) and \(p_{i}^{-}\) are their individual P&Ls. Eq.(1) states that portfolio P&L is the sum of gains from winning positions and losses from losing positions. Losses are negative by construction, so for \(p>0\), total gains must exceed total losses.
The average P&L of winning and losing positions is defined as:
\[ \bar{p}_{+} = \sum_{i=1}^{n^{+}} p_i^{+}/n^{+} \tag{2} \] \[ \bar{p}_{-} = -\sum_{i=1}^{n^{-}} p_i^{-}/n^{-} \tag{3} \]
where \(\bar{p}_{+}, \bar{p}_{-}>0\) by definition. Substituting these into Eq.(1), we rewrite:
\[ p = n^{+} \cdot \bar{p}_{+} \;-\; n^{-} \cdot \bar{p}_{-}. \tag{4} \]
Next, we define the hit rate \(\nu\) and win-loss ratio \(\rho\):
\[ \nu = \frac{n^{+}}{\left(n^{+} + n^{-}\right)} \tag{5} \] \[ \rho = \frac{\bar{p}_{+}}{\bar{p}_{-}}. \tag{6} \]
The hit rate \(\nu\) measures the proportion of profitable positions, while \(\rho\) compares average gains to average losses. Both metrics are bounded: \(0 \leq \nu \leq 1\) and \(\rho \geq 0\). The term “position” can be interpreted broadly: for instance, as individual stocks in a long-only portfolio or as pairs of trades in a long/short portfolio.
To connect \(\nu\) and \(\rho\) with profitability, we define relative gains \(\displaystyle r\):
\[ r = \frac{\sum_{i=1}^{n^{+}} p_i^{+}}{-\sum_{i=1}^{n^{-}} p_i^{-}}, \tag{7} \]
which is the ratio of total gains to total losses (as a positive number). For practical purposes, \(\displaystyle r\) is undefined in periods where no losses occur, so sufficiently long timeframes should be considered.
Substituting Eqs. (2) and (3) along with the definitions of (5) and (6), we derive:
\[ r = \frac{n^{+} \cdot \bar{p}_{+}}{n^{-} \cdot \bar{p}_{-}} = \frac{\nu}{1-\nu}\cdot \rho, \tag{8} \]
where numerator and denominator are scaled by the total number of positions. This formula shows how \(\nu\) and \(\rho\) combine to determine relative profitability. The relationship encapsulates the trade-offs between hit rate and win-loss ratio in driving overall portfolio gains.
3. The interpretation
If you get half the positions right, i.e., \(\nu=0.5\), then Eq.(8) yields \(\displaystyle r=\rho\). This implies that profitability can stem solely from managing the P&L of positions, even without an edge in selection. For example, trend-following strategies often lose more frequently than they win but achieve profitability by generating large gains when trends are captured.
Eq.(8) also helps define the P&L boundary, where \(\displaystyle r=1\). For instance, if a strategy has a 60% hit rate (\(\nu=0.6\)), it needs a win-loss ratio \(\rho > 2/3\) to stay profitable. Conversely, a strategy with a 40% hit rate (\(\nu=0.4\)) requires \(\rho > 3/2\).
To explore how \(\displaystyle r\) varies with \(\nu\) and \(\rho\), we rearrange Eq.(8):
\[ \nu = \frac{r}{\,r+\rho\,}. \tag{9} \]
Figure (1) illustrates Eq.(9) for various \(\displaystyle r\). The green and red zones denote profitable (\(\displaystyle r>1\)) and unprofitable (\(\displaystyle r<1\)) regions, respectively.
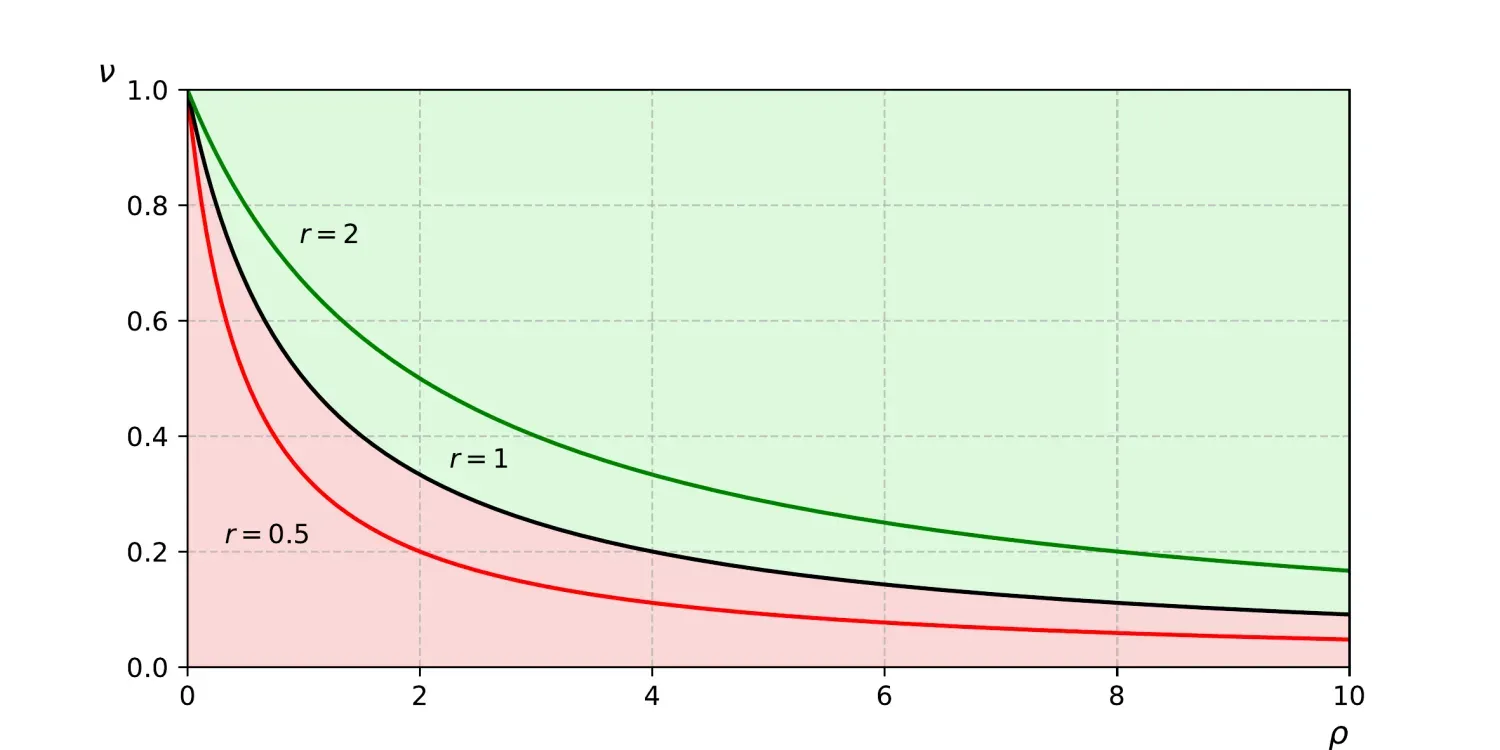
As \(\rho\) approaches zero, \(\nu\) converges to 1 for all \(\displaystyle r\), indicating that very small win-loss ratios require extremely high hit rates. This situation might reflect poor trade management, where profits are taken too quickly, and losses are allowed to accumulate. Conversely, high \(\rho\) values allow even low hit rates to achieve profitability.
The first and second derivatives of Eq.(9) are:
\[ \frac{d\nu}{\,d\rho\,} = \frac{-r}{\,(r+\rho)^2\,}, \tag{10} \] \[ \frac{d^2\nu}{\,d\rho^2\,} = \frac{2r}{\,(r+\rho)^3\,}, \tag{11} \]
showing that \(\nu\) decreases monotonically and is convex in \(\rho\).
By taking partial derivatives of \(\displaystyle r\) with respect to \(\nu\) and \(\rho\) in Eq.(8), we get:
\[ \frac{\partial r}{\,\partial \nu\,} = \frac{\rho}{\,(1-\nu)^2\,}, \tag{12} \] \[ \frac{\partial r}{\,\partial \rho\,} = \frac{\nu}{\,1-\nu\,}. \tag{13} \]
This gradient indicates that improving hit rates (\(\nu\)) has a greater impact on \(\displaystyle r\) than improving win-loss ratios (\(\rho\)), provided \(\rho > \nu \cdot (1-\nu)\), which is almost always true for realistic strategies where \(\rho > 1\).
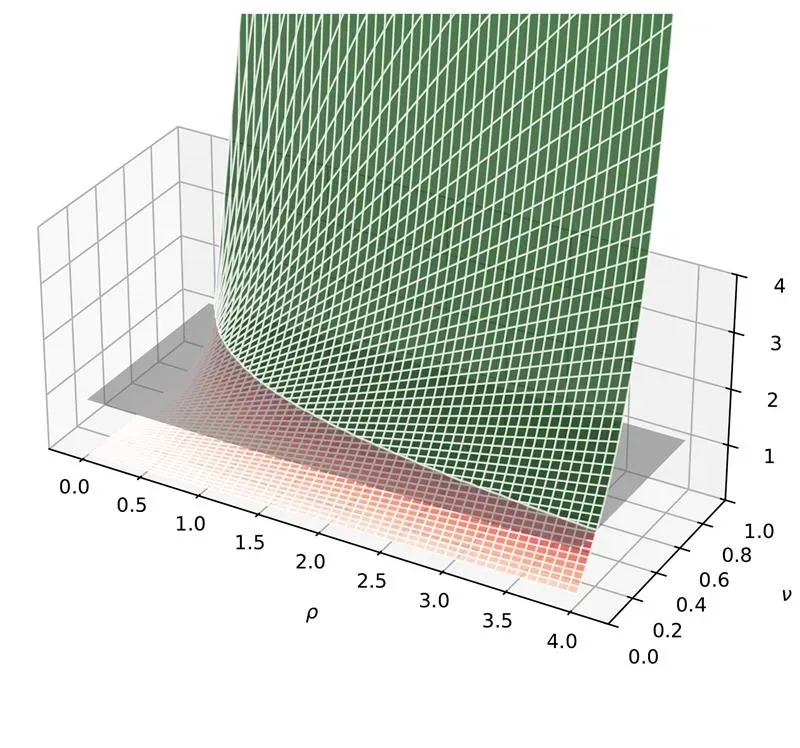
Figure (2) illustrates a 3D representation of Eq.(8). The horizontal plane separating the green and red regions corresponds to \(\displaystyle r=1\), marking the boundary between profitability and unprofitability. The white mesh lines on the surface reveal that the ascent is noticeably steeper when moving along the direction of increasing \(\nu\) compared to \(\rho\).
This phenomenon is closely related to Federer’s hit rate, discussed earlier. Federer wins only about 54% of the points he plays, yet his match win rate stands at an impressive 80%. The key lies in the compounding effect of crucial points won, such as breakpoints and tiebreakers. Similarly, in Eq.(8), when a losing position flips to a winning one, the impact is felt strongly in both the numerator and denominator, especially in concentrated portfolios. This is akin to Federer converting critical points, which amplifies his overall match success despite a modest point win rate.
In contrast, \(\displaystyle r\) responds linearly to changes in \(\rho\), much like a tennis player improving point win percentages across all points equally. While valuable, such uniform improvements have a proportionally smaller impact compared to the outsized effect of winning key moments (or flipping losing positions to winners). This underscores why increasing \(\nu\) is often a more impactful path to profitability.
4. Conclusions
This article formally linked hit rates and win-loss ratios to relative gains (\(\displaystyle r\)), a measure of portfolio profitability. We showed that improving hit rates generally has a greater impact on \(\displaystyle r\) than improving win-loss ratios. For investors, this means focusing on position selection (closely tied to hit rates) is often more effective than optimizing portfolio construction (related to win-loss ratios).
These findings come with caveats. Hit rates and win-loss ratios are not fixed and can vary over time. For example, trend-following strategies typically exhibit low hit rates and high win-loss ratios, while short-volatility strategies show the opposite. However, these patterns can shift depending on market conditions.
Despite this variability, our results highlight the importance of focusing efforts where they yield the greatest impact. In quantitative strategies, this might mean emphasizing model improvements that boost hit rates. While portfolio construction can enhance returns, it cannot compensate for poor selection skills. Ultimately, selection trumps construction: we believe that a well-chosen set of positions will outperform a poorly selected portfolio, regardless of how well it is constructed.
- Source: 2024 Commencement Address at Dartmouth by Roger Federer. here
- Source: Vontobel
Important Information: The content is created by a company within the Vontobel Group (“Vontobel”) and is intended for informational and educational purposes only. Views expressed herein are those of the authors and may or may not be shared across Vontobel. Content should not be deemed or relied upon for investment, accounting, legal or tax advice. The correlation drawn between success rates and the S&P is purely for illustrative purposes only and is not meant to imply a guaranteed success rate when choosing a portfolio selection or rebalancing. It does not constitute an offer to sell or the solicitation of an offer to buy any securities or other instruments. Vontobel makes no express or implied representations about the accuracy or completeness of this information, and the reader assumes any risks associated with relying on this information for any purpose. Vontobel neither endorses nor is endorsed by any mentioned sources. AI-driven investment strategies are not available in all jurisdictions.
Read next:
2026 Large Language Models OutlookRelated insights

2026 Large Language Models Outlook

2026: Multi Asset Reloaded - Investors (Still) Need Diversification

Quant 2.0 - The AI Revolution

Global rates: a mirage of diversification

The signals beneath the surface
