Quantitative Investments
Your partner for leading quantitative investment solutions.
October has been challenging for both bond and equity investors with the ongoing repricing of US rate expectations. The 10-year US Treasury yields climbed 40 basis points. Contrary to September, which has been influenced by the Fed’s hawkish communications, October has been marked by strong US growth1, solid labor market data and an upside surprise in US inflation.
Significant progress has been made by central banks in combating inflation. However, there are reasonable doubts regarding the achievement of inflation targets within the central banks’ forecast horizon in the US2, considering October's 5%3 economic growth rate. In October, the heightened risk aversion has lowered market expectations for another rate hike in 2023, assigning a well below 50% probability to a cut. But scepticism regarding the Fed’s capacity to lower rates in 2024 and 2025 has increased. Currently, future markets are pricing in only a 50 basis point rate cut for the second half of 2024.
As a result, we’ve witnessed a bear steepening, with the long end of the yield curve rising faster than its shorter end. This dynamic has had considerable effects on our bond and equity allocation models. Our bond allocation model maintains an underweight position, anticipating that the rate repricing may persist in the near term. However, it also considers the improved valuations following the recent bond sell-off, gradually reducing the underweight. For equities, our allocation model continues to lessen the overweight position due to the less inverted yield curve, driven more by the Fed’s readiness to maintain higher rates longer rather than improved medium-term economic outlooks. This raises the recession risk, a view supported by our risk model which identifies patterns resembling those of 1990, 2006, and 2018, all periods followed by substantial economic decelerations. As we indicated in August, a recession, while appearing closer, may still be a few months away4.
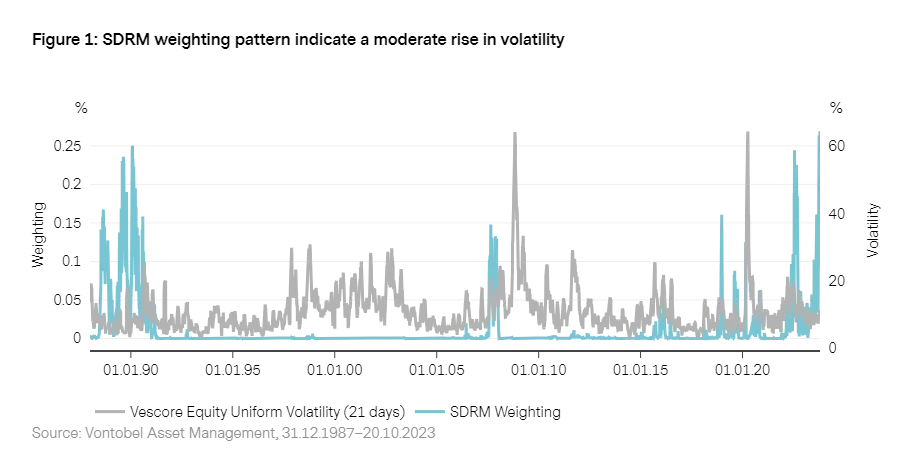
Several noteworthy changes have emerged in the output of our risk model, SDRM5, in recent weeks. While the late 80s continue to stand as a crucial reference point in our model's search for a risk environment comparable to today’s, other periods, specifically 2006 and 2018, have become increasingly significant in identifying historical parallels. This shift is attributed to the gradual retreat of some variables from extreme levels6, such as the term spread, which is subtly reverting to normalcy as the inversion of the yield curve diminishes.
In each of these referenced years, the US and other major developed markets witnessed the conclusion of extended policy-tightening cycles, followed by weak growth. Such cycles even escalated to recessions in 2007/08 and the 1990s. The SDRM model's current identification of similarities with the 1990s, and a subtle shift of focus from the late 80s to the 90s, signifies potentially escalating risks of a recession. The historical context reinforces this, given the severe recession that engulfed the US in the late 1990s following a banking crisis. Associated with looming recession threats is the propensity for heightened market volatility. In alignment with this, our SDRM model forecasts a modest rise in market volatility in the impending 21 days."
The global wave7 indicates that the global economy is maintaining its recovery trajectory. However, the foundation of this recovery appears tenuous due to two predominant factors. Firstly, there's a lack of universal momentum in the recovery process, as depicted by significant growth disparities within regions such as the Eurozone and the US. Secondly, the persistent rigor in monetary conditions, as underscored by our transition model, hampers optimistic projections of the near-term economic pathway. An exemplar of this is the historical tight liquidity, tracked by our prime global liquidity indicator (real M1), which shrunk by -8.2% year-over-year. This keeps the risk of a relapse into economic contraction for the global economy at 37%, and for developed markets even at 43%.
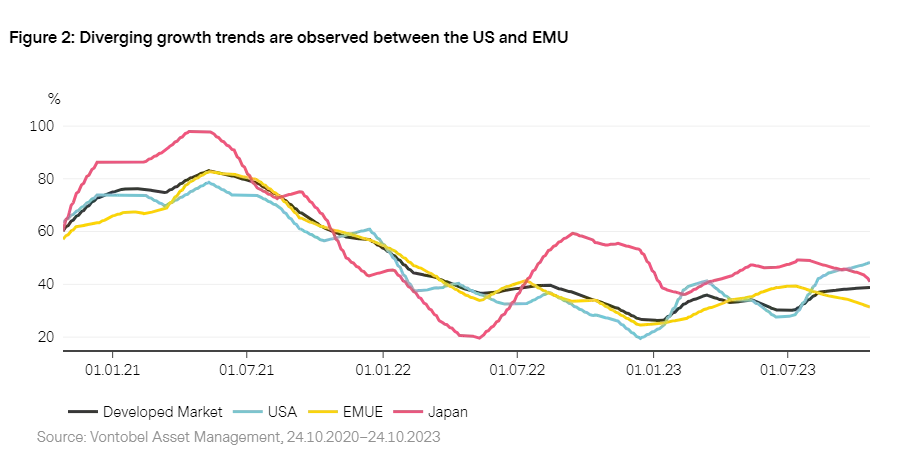
Developed markets exhibit a continuance in their recovery phase, albeit plagued by persistent growth divergences, particularly between the US and Europe. The Eurozone data augments the recession probability within Europe, juxtaposed with the US where economic indicators such as the Atlanta Fed nowcast have surged above 5% in October. A notable exemplification of economic resilience is evident within sectors like the labor market and therefore the consumer8. However, the Eurozone’s core nations like France and Germany have witnessed significant declinations in economic momentum. Analysis reveals that stringent lending criteria are increasingly impinging on growth trajectories within both Europe and the US, primarily affecting sectors sensitive to interest rates like housing and banking9 (Figure 2).
China’s economic landscape is displaying promising signs of stabilization, affirmed by its recent GDP release for the third quarter, with a recorded 4.9% year-over-year growth, surpassing initial consensus estimates of 4.5%. Various economic sectors such as retail and investments have bolstered this performance, with even the beleaguered housing sector exhibiting stabilization symptoms. Given these positive indicators, government aspirations for a 5% growth in 2023 appear achievable again. These developments have contributed to an economic uplift in October, minimizing disparity with other emerging markets. Regions such as Latin America manifest a robust growth momentum, whereas regions proximal to economically weakened European zones like Eastern Europe are experiencing reciprocal economic sluggishness.
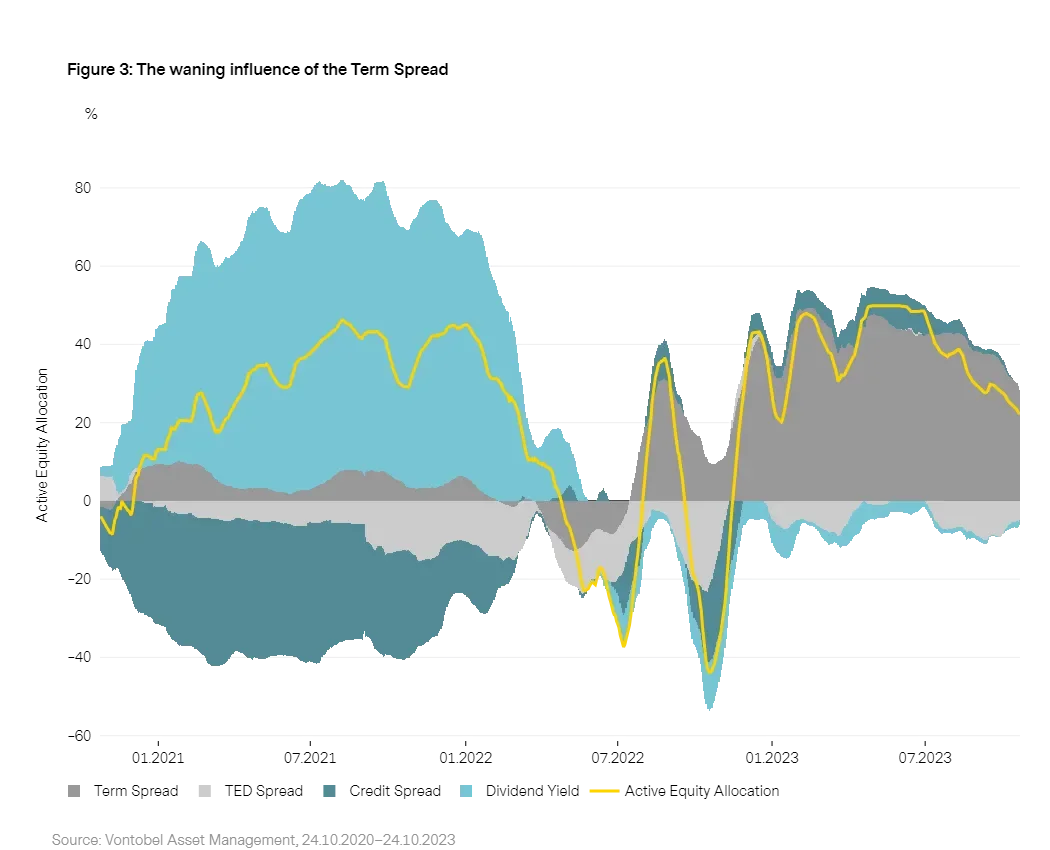
Since July, our equity allocation model, GLOCAP, has been methodically diminishing its equity allocation, as illustrated in Figure 3. The primary catalyst for this month’s reduction has been the term spread, complemented to a minor degree by modifications in the credit spread and the dividend yield. There has been a slight augment in the negative contribution emanating from the latter.
October witnessed the continuation of the bear steepening of yield curves, characterized by a more rapid ascent at the long end compared to the short end. This has been instrumental in perpetuating the decline in the positive allocation contribution attributable to the term spread. A resurgence in risk aversion in October eradicated the positive contribution previously imparted by the credit spread. Persistently stringent monetary conditions are indicated by the Ted spread’s enduring negative contribution.
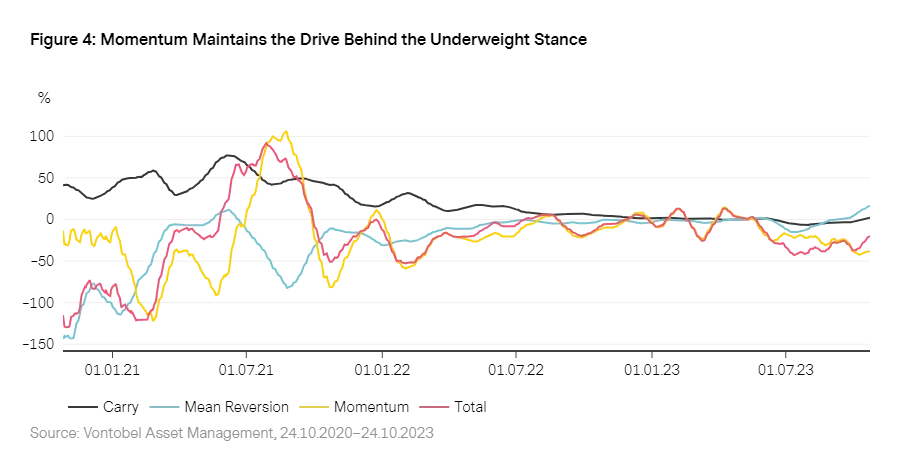
Our bond allocation model remains underweight in government bonds but has incrementally reduced the underweight stance, as shown in Figure 4. Momentum continues as the primary influence of the prevailing underweight position. An increasing contribution from the mean reversion model component is playing a role in lessening the underweight, while the impact of the carry component remains essentially neutral. In geographical terms, the model maintains a pronounced underweight in North America, with allocations of -10% in the USA and -9% in Canada. The UK stands as an exception, where our model maintains a slight overweight position.
Yield curves trended upwards in October, extending their bear steepening, with US 10-year yields nearing 5%, a level previously seen in 2007. Strong US economic data, a consistently tight US labor market, and sustained hawkish communication from the Fed have been pivotal in driving the rise in US yields in October. While the mean reversion's increasing positive contribution suggests bonds are becoming attractive from a valuation standpoint, persistent negative momentum indicates that further adjustment in rate expectations may still be forthcoming.
1 See the
July edition
of our GMO.
2 We highlighted in the October edition of the
GMO
the risk of sticky inflation the risks of the second wave of inflation
3 The Atlanta Fed now casts estimates that the US economy has been growing by 5% in October 2023.
4 In the
August edition of our GMO
we showed that most of our models signal that we are slowly approaching the phase in which a recession becomes more likely.
5 More information on our SDRM model can be found in “
Risk Management: Forward on calm seas, adaptive and agile in stormy phases
”
6 Our SDRM model compares the current market environment with the past based on the dividend yield, credit spread, ted spread, term spread, short term interest rate and two volatility measures
7. For further detail see “
The Vescore Wave – a superior business-cycle model
”
8. See the
July edition of our GMO
.
9. In the
April edition of our GMO
we showed our Developed Market Banking Sector Vulnerability model and concluded, that systemic risks have significantly fallen since the Great Financial Crisis in 2007/08
Past performance is not a reliable indicator of current or future performance. Any projections or forward-looking statements herein are based on a variety of estimates and assumptions. There can be no assurance that estimates or assumptions regarding future financial performance of countries, markets and/or investments will prove accurate, and actual results may differ materially. The inclusion of projections or forecasts should not be regarded as an indication that Vontobel considers the projections or forecasts to be reliable predictors of future events, and they should not be relied upon as such. Diversification and/or asset allocation neither assures a profit nor eliminates the risk of investment losses. Vontobel reserves the right to make changes and corrections to the information and opinions expressed herein at any time, without notice. This document is for information purposes only and does not constitute an offer, solicitation or recommendation to buy or sell any investment instruments, to effect any transactions or to conclude any legal act of any kind whatsoever.