
Quantitative Investments
Your partner for leading quantitative investment solutions.

Maintaining your course, even in turbulent times is not only the declared goal on the high seas, but also on the financial markets. Agility and calm are in demand: in normal waters this helps to move forward; in raging seas and rough winds, by contrast, the pace must be slowed in order to be able to accelerate again quickly once the storms have subsided. Finding this balance is a difficult task not only for the great seafarers, but also for the financial world.
As on the open sea, stormy phases, high seas, and calm waters alternate in the economy. Recognizing these fluctuations early on and maneuvering the ship accordingly is a real challenge that captains on the world's oceans and portfolio managers in financial markets have to master. For risk management, you must always react to dangers in time while not losing sight of the given route and planned destination.To detect crisis situations at an early stage and to be able to react adequately to them, captains and financial experts must be on the lookout for fluctuations and adjust their navigation accordingly. While sailors record the current weather situation by using modern meteorological data, the market often focuses on volatility. With its help, those risks that are not already eliminated by diversification in portfolio management are identified and evaluated. Volatility is estimated based on short- or long-term historical data, which serve as a tool to infer future fluctuation intensity. The better this forecast is, the more accurately the future risk can be estimated.
The challenge of any volatility model is to have slow-moving estimates in quiet periods, i.e. to be calm, and to be adaptive or agile in stress periods – a solution to this inevitable trade-off is state-dependent risk measurement (SDRM). Compared to traditional approaches, SDRM is calmer in stress-free periods but agile and timely in periods of market stress, enabling us to improve our response to future drawdowns and recoveries, regardless of how quickly they occur.
The advantage of this model is that it not only includes the current period, but also draws on experience from various comparable market environments that are similar to today's environment – it considers how the current allocation of the portfolio would have behaved in relation to the risk (in the future) during these past environments.
The idea behind the SDRM model is to sample the reactions of today’s portfolio to the volatility clusters1 evidenced in historical data. The volatility estimation is done in two steps:
Step 1: Similarity weighting of the past
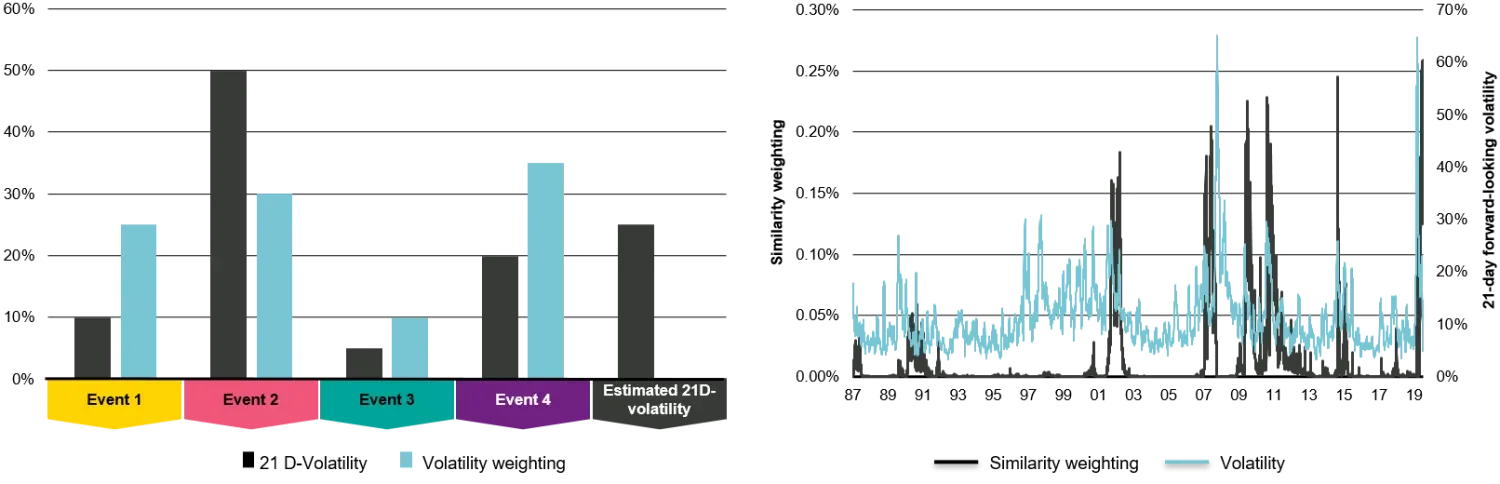
In a first step, we measure the similarity of the past to the current market environment (Figure 1). The method used identifies those events that are most similar to today's market environment from the available data: The greater the match, the higher the similarity weighting for that day.
Figure 1: Identifying similar events in the past

Step 2: Calculation of the expected volatility
In the second step, we estimate the expected volatility (Figure 2) by using the 21-day forward-looking volatility for each day in the past that is similar to today2. Since we know the past, we have the advantage of being able to calculate the realized volatility from a given day over the next 21 days. This allows us to construct an expected similarity weighted volatility for our current portfolio.
Figure 2: Reactions of today’s portfolio to the volatility clusters
Source: Vescore
The SDRM model’s advantage is that we can capture the different estimation periods and calculate the corresponding expected volatility for the current portfolio composition. This helps us to maintain our course in the portfolios even in rough seas and sudden weather changes in the markets. In smooth waters, the calmness of our model pays off; for maneuvering in stormy waters, its agility helps us to avoid potential cliffs.
1 Since the beginning of the 1980s, financial markets have increasingly seen temporal accumulations of strong or small fluctuations in returns. This phenomenon, known as a volatility cluster, was already observed in the 1960s by Mandelbrot (1963, p. 418), who noted that "large changes tend to be followed by large changes - of either sign - and small changes tend to be followed by small changes".
2 The longer the selected period, the more sluggishly the distribution reacts to structural changes.
Literature
Mandelbrot, B.B. (1963). The Variation of Certain Speculative Prices. The Journal of Business, 36 (4), pp. 394-419.
Important Information:
The views herein are those of Vontobel and may change at any time and without notice. Information and opinions presented have been obtained or derived from sources believed to be reliable and current; however, Vontobel cannot guarantee the sources’ accuracy or completeness. Such information is not intended to predict actual results and no assurances are given with respect thereto. Some of the information provided may contain projections or other forward-looking statements regarding future events or future financial performance. There is no guarantee that any such future events will come to pass and actual events or results may differ materially. Past performance is not an indication of future results. Neither asset allocation nor diversification assure a profit or protect against loss in declining markets.


