Quantitative Investments
Your partner for leading quantitative investment solutions.

The Vescore Wave is our proprietary business-cycle model. We use it to identify the current state of the business cycle for 50 countries, based on a big-data approach.
From our standpoint, timely anticipation of the transition between business cycle states is key for the success of tactical asset allocation decisions. The models we developed deliver information about the current state (state model) and the most probable future state (transition model). Our Vescore Wave has a strong track record in anticipating business-cycle developments usually ahead of standard economic leading indicators. Therefore, we believe it is relevant for investors and policy makers alike.
It is not easy to dispel skepticism among those investors who doubt that economic forecasts are useful for investment decisions. Are they discouraged by the fact that downward revisions often come too late because the accuracy of predictions tends to wane in the run-up to economic downturns or recessions1? Or do they refrain from relying on economic forecasts because these usually depend on assumptions of many unknown parameters?
In this respect, we have good news: There is no need for complex economic forecasts to make fruitful investment decisions. In our view, the key for successful asset allocation is deriving the right information about business-cycle states rather than making accurate GDP forecasts. We know from the past that risky assets tend to deliver positive returns in the upturn, whilst their performance is underwhelming in the downturn2. Hence knowing the state of the business cycle is sufficient to make a big difference in the asset allocation (see figure 1). This is why, by means of our Vescore Wave, we aim to derive information about the current business-cycle state and the most likely transition path ahead (transition probabilities).
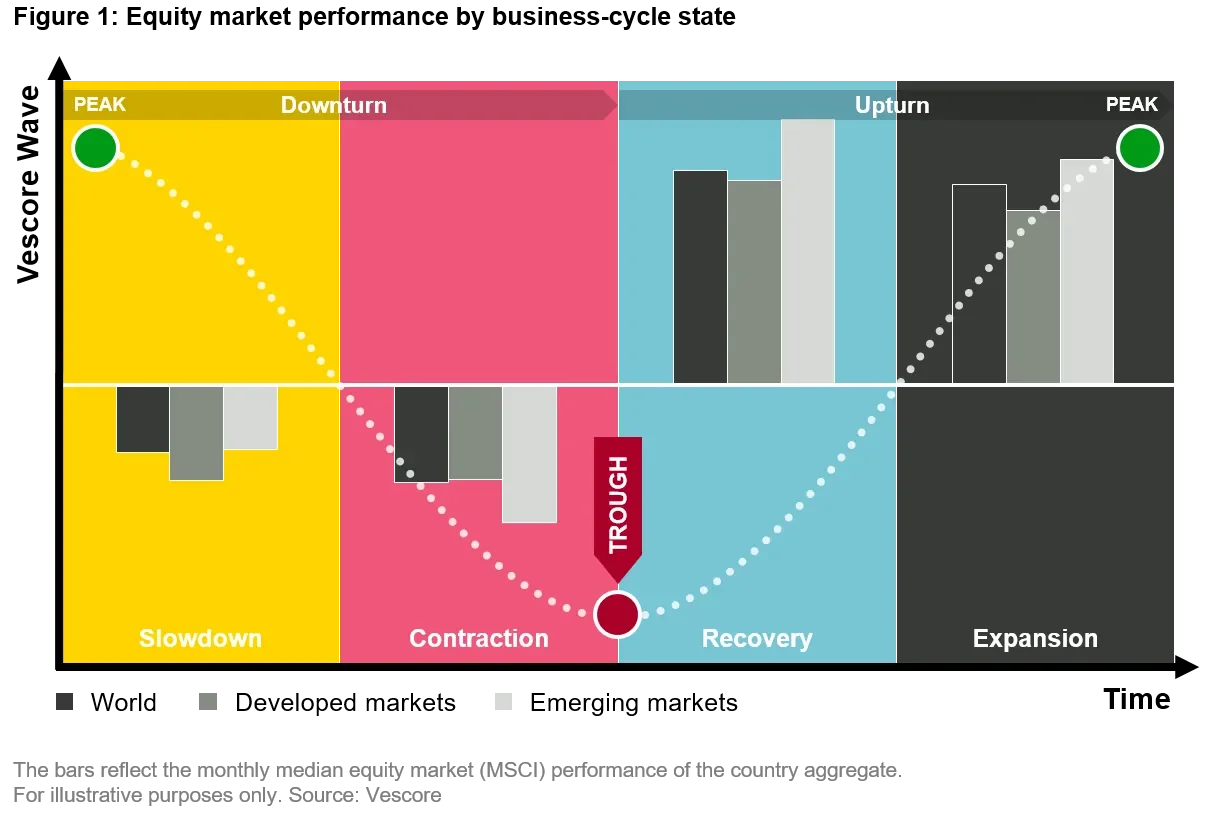
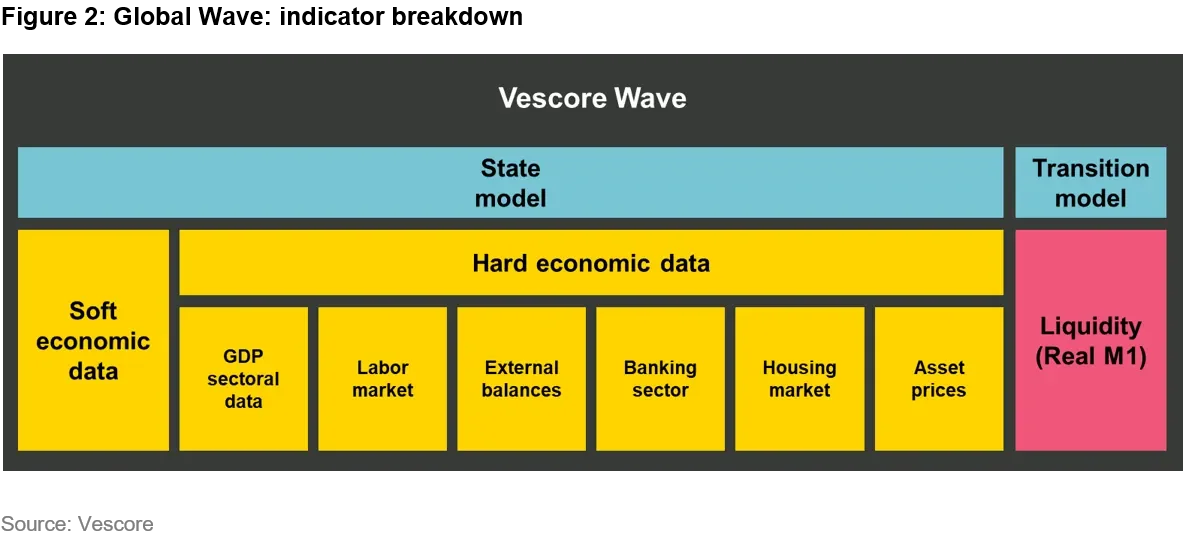
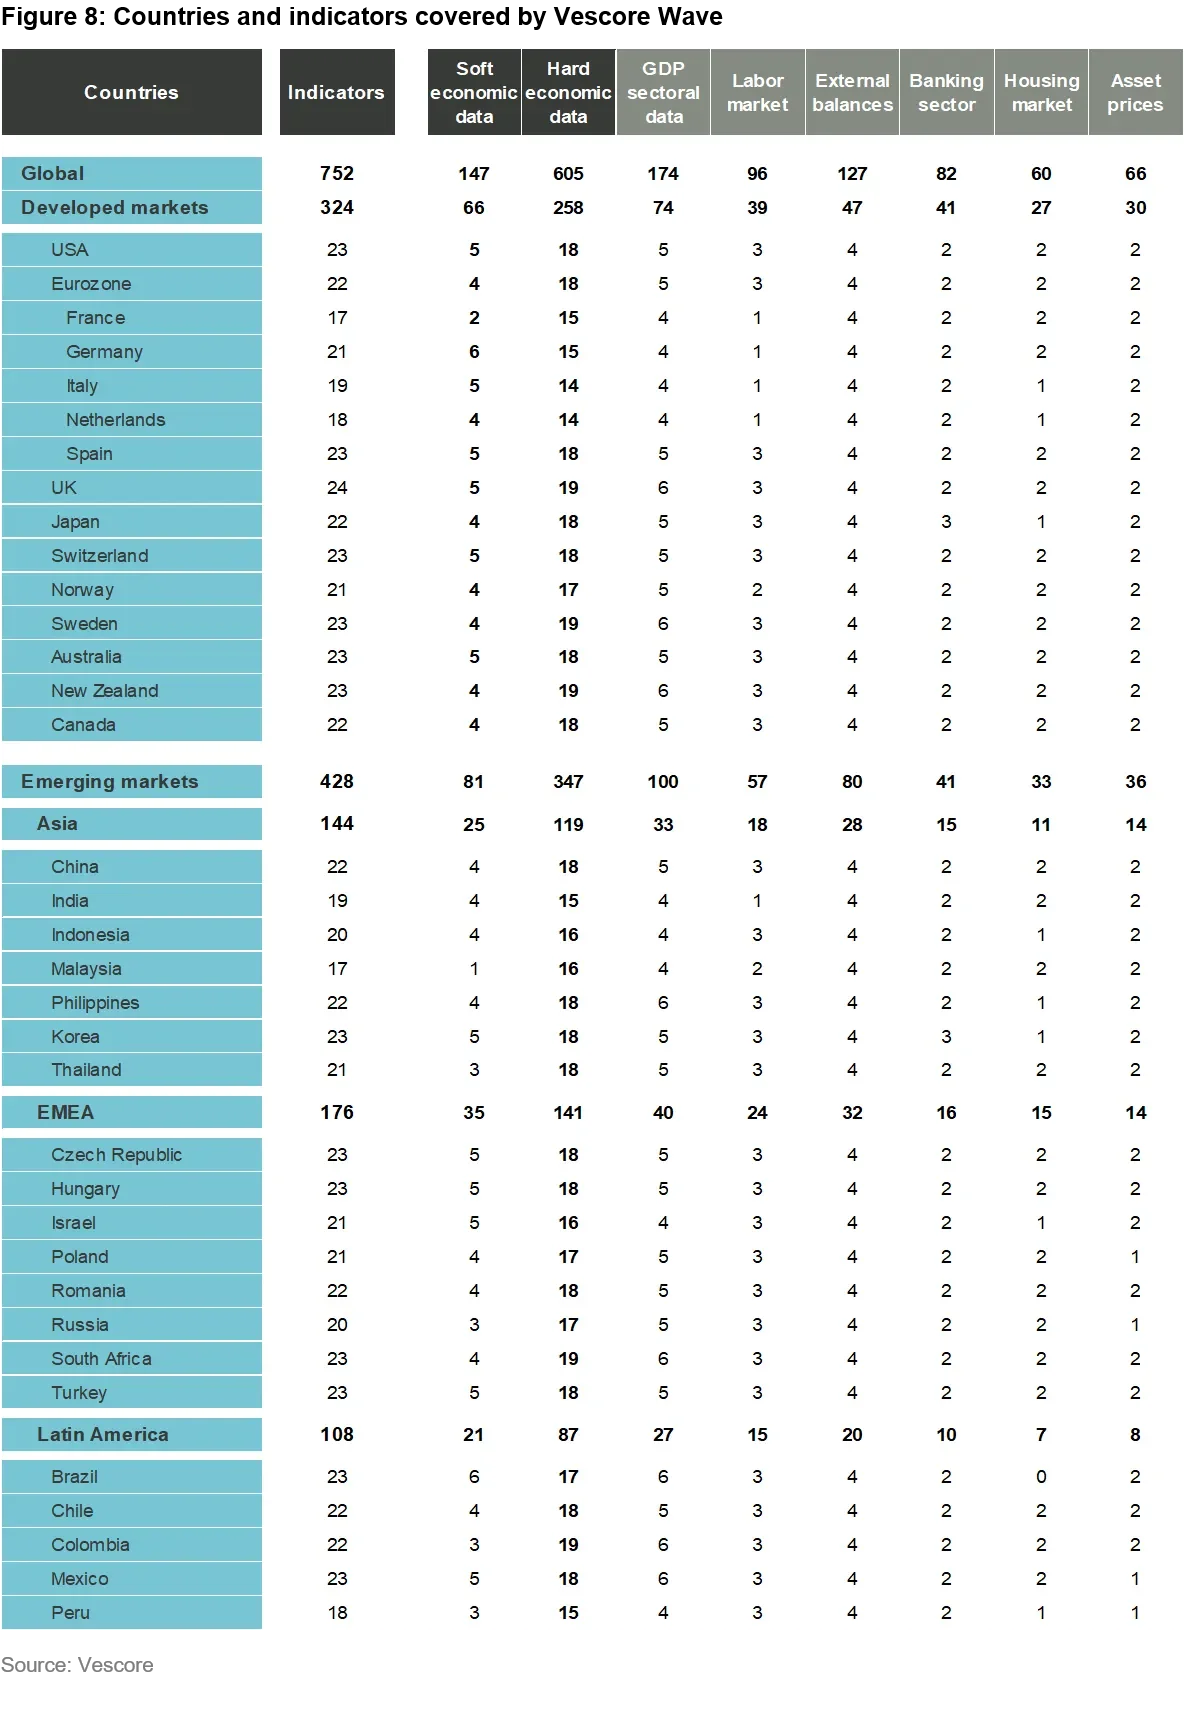
The state model signals in which of the four states of the business cycle – slowdown, contraction, recovery, or expansion (shown in figure 1) – we are. Model output is available on country, regional, and global level. We apply a big-data approach to derive information about the state. On the highest level of aggregation – the Global Wave – we currently process more than 750 economic-data time series, dating back to the 1990s where available, to compute the current business-cycle state of the global economy. Computation of the state starts on a country level, considering 50 countries. The algorithm derives the necessary information from 20 to 25 economic-data time series. Data may slightly vary from country to country, depending on data availability and individual economic structures. On a country level, we weight the indicators equally with the aim to get insight into the breadth of economic developments. All indicators used are grouped in categories (see figure 2; for a detailed overview of countries and indicators covered see figure 8).
The state model’s output shows the percentage share of those indicators that lie above trend3. Regional and global aggregates are weighted according to the size of each country’s nominal GDP (in USD). The Vescore Wave defines that we are at the threshold between the upper and lower half of the business cycle when 50% of the indicators lie above trend. As shown in figure 3, we can derive from a falling indicator that we are in an economic downturn (left half in figure 1) and from a rising indicator that we are in an upturn (right half in figure 1).
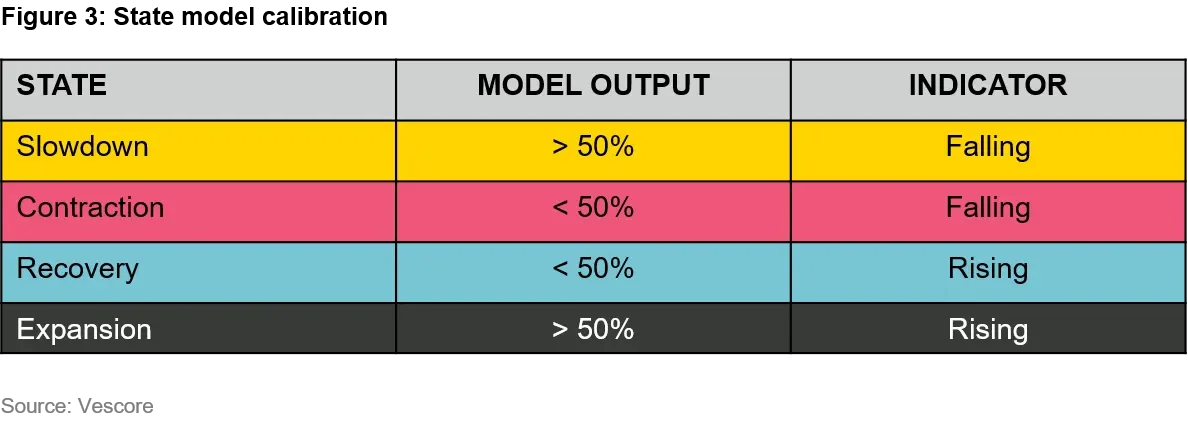
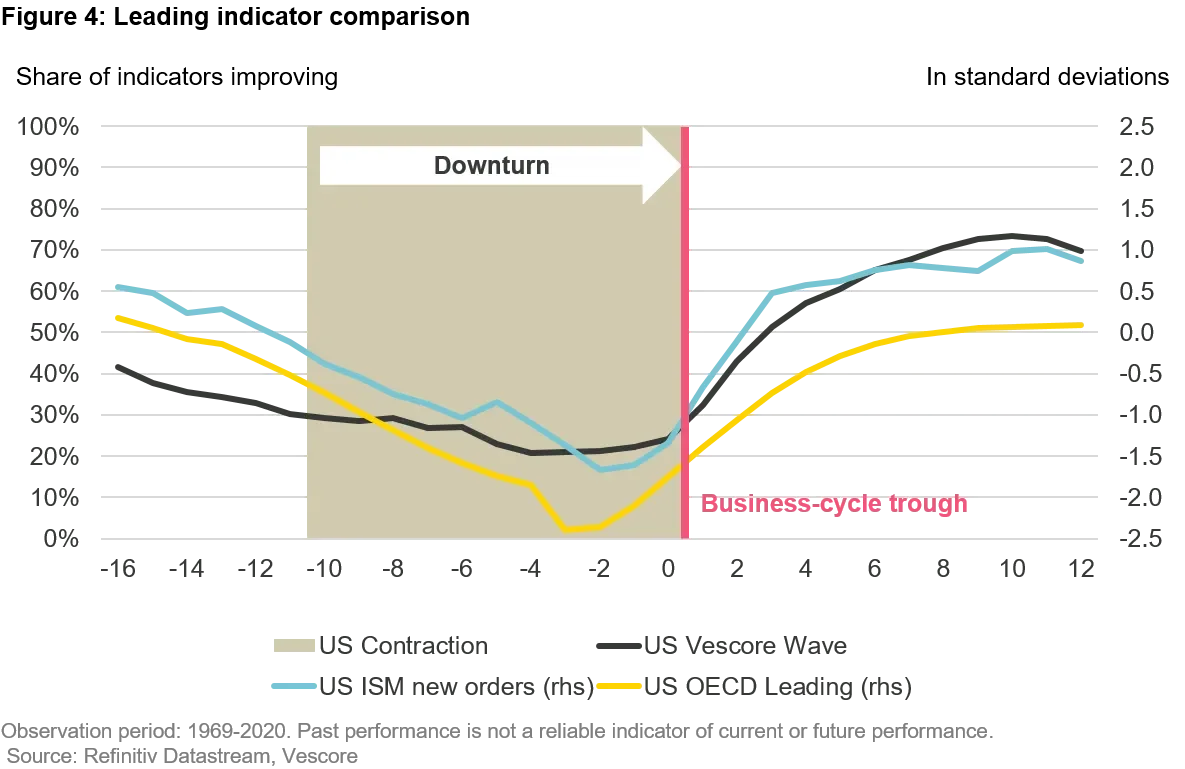
Figure 4 shows the behavior of different leading indicators around the economic trough for the US economy, and figure 5 summarizes the results for the US economy. On average over the past 50 years, both the PMI and OECD indicator anticipated the economic trough two to three months in advance, whilst our Vescore Wave’s state model beat them by anticipating the trough more than one month earlier than they did. Therefore, our state model has the potential to harvest higher equity market gains when it is used for tactical asset allocation.
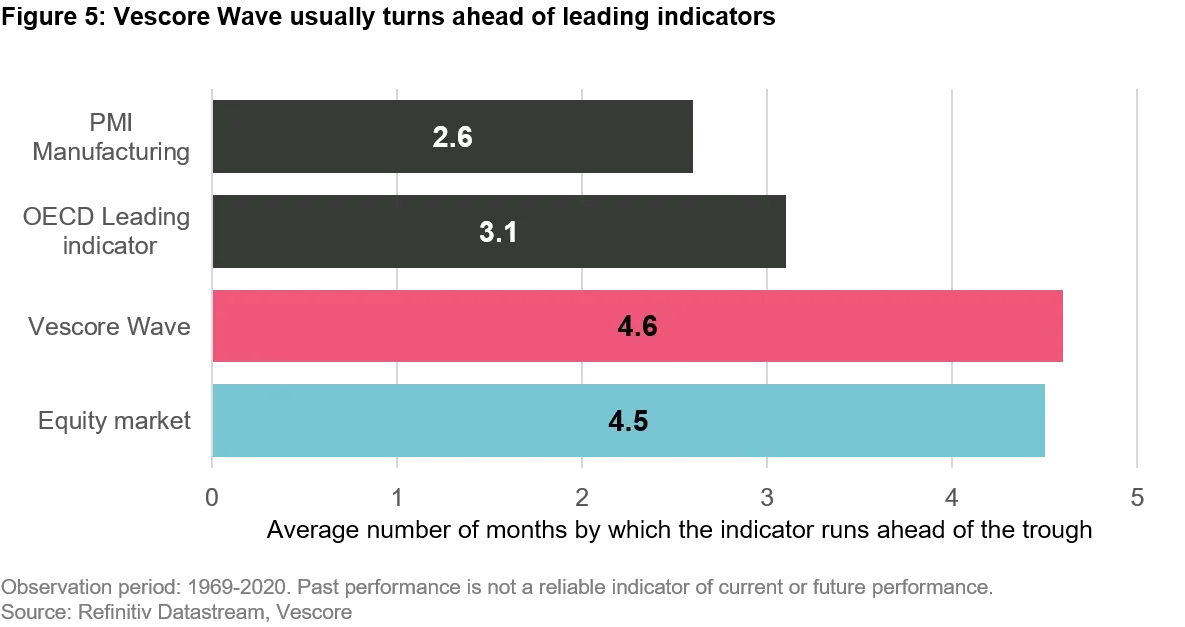
The answer is simple: their belief that the worst is over and things are improving. This makes the equity market another early forecaster of turning points in the business cycle (see figure 5), and corroborates how important it is to know when the cycle is in transition from one to another state in order to make the right investment decisions.
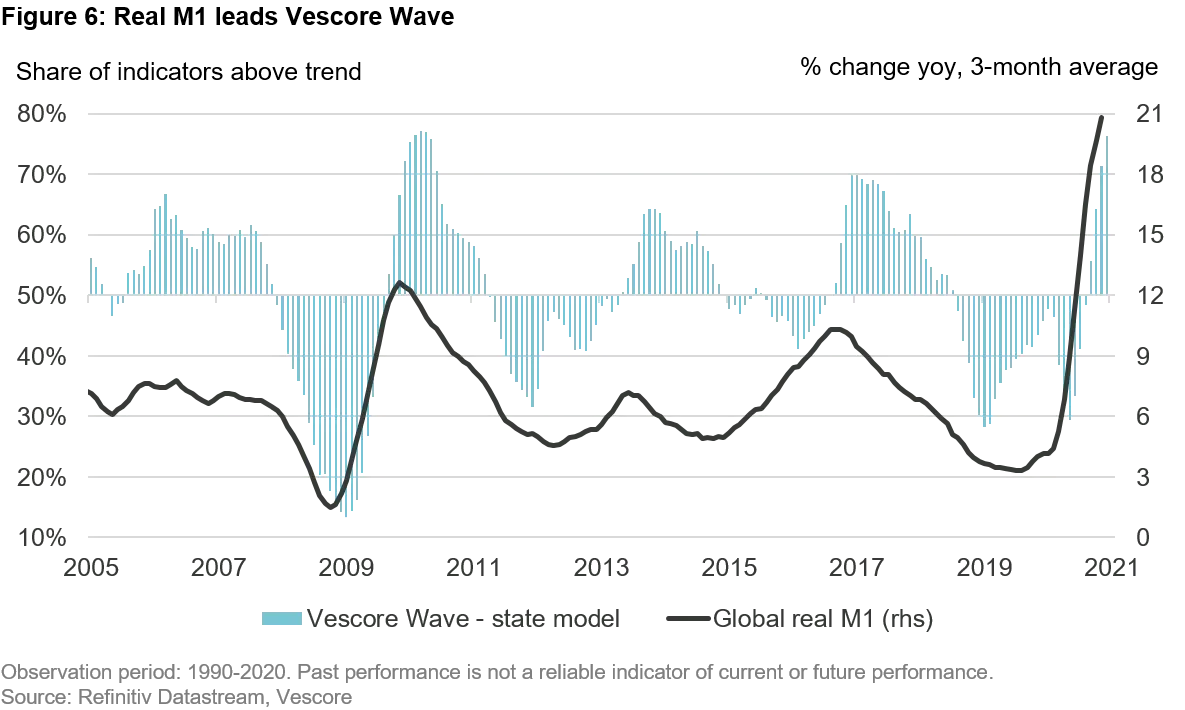
Our transition model derives information by evaluating the effectiveness of policy stimulus measures. Its output are transition probabilities indicating how likely it is that the economy will move into a different business cycle state in the month to come. There are different ways of measuring policy stimulus. Central bank stimulus, for example, can be assessed directly at the source via changes in the central banks’ policy rates or balance sheets, or indirectly via financial market indicators. None of these indicators by itself can provide a complete picture, but if the policy measures are credible, and thus effective, they are likely to impact the money supply of the economy. As policy shifts need time until they trickle through to the economy, economic data tends to reflect policy stimulus much later than money supply data. Therefore, we are using the information from our preferred liquidity indicator, real M1, which has a good track record in anticipating shifts between business cycle states4 (see figure 6). This further improves our model’s signaling of transitions between business cycle states.
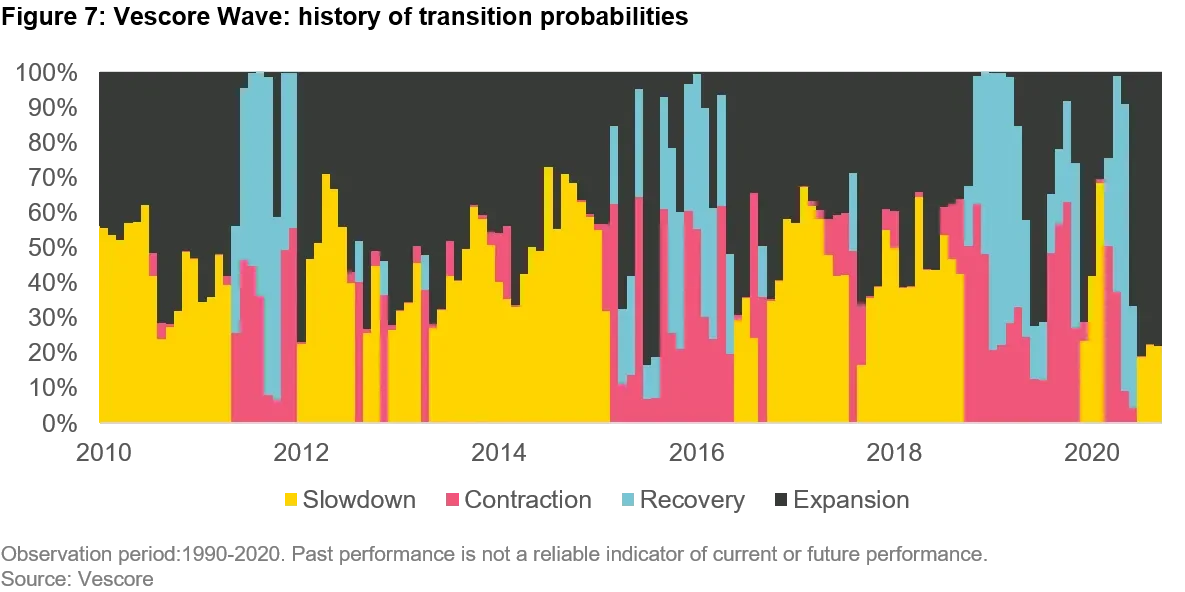
The transition model capitalizes on the lag between the policy stimulus, measured by real M1, and the current state of the business cycle. We use our liquidity indicator to assess how probable it is that the economy will remain in the current state or enter one of the three other states. Figure 7 shows the state probabilities calculated in each month for the month to come. In the current expansion state, our transition model predicts a high probability (black bar) that we will remain in expansion next month. On average over the past 20 years, our transition model was able to anticipate turning points in the business cycle one month earlier than our state model with an accuracy of 65%.
We are convinced that knowing the current business-cycle state and the transition probabilities between the states gives an advantage for tactical asset allocation decisions and thus matters to investors. In this respect, our Vescore Wave can serve well because, on average over the long-term past, it has proven superior to standard private- and public-sector leading indicators in anticipating turning points in the business cycle.
1. Source:
“GDP predictions are reliable only in the short term“
, The Economist, 15 December 2018
2. We use the OECD methodology to define the business-cycle state since 1960 for 24 countries. The bars in figure 1 reflect the monthly median of the equity market performance of all these countries by business-cycle state. Overall, the results are based on the analysis of 6226 months of data. For further details on the OECD business cycle methodology, see
"Handbook of Constructing Composite Indicators"
, OECD, 2008.
3. The results for the state are even available on a more granular level. State information is available for soft and hard economic-data time series. The latter can be broken down further (see figure 2).
4. We prefer M1 to other money aggregates like M2 or M3 as it only includes money supply components that easily can be used for economic transactions, namely currency in circulation and sight deposits. Time deposits and savings deposits with a notice period are not included. Deflating the money supply is necessary as we are trying to anticipate real economic shifts. The relatively long lead of up to twelve months makes economic sense because time passes between individuals deciding to buy discretionary goods and therefore moving deposits to liquid accounts, the ordering of the goods, and their production.
Important Information:
The views herein are those of Vontobel and may change at any time and without notice. Information and opinions presented have been obtained or derived from sources believed to be reliable and current; however, Vontobel cannot guarantee the sources’ accuracy or completeness. Such information is not intended to predict actual results and no assurances are given with respect thereto. Some of the information provided may contain projections or other forward-looking statements regarding future events or future financial performance. There is no guarantee that any such future events will come to pass and actual events or results may differ materially. Past performance is not an indication of future results. Neither asset allocation nor diversification assure a profit or protect against loss in declining markets.