


Quantitative Investments
Your partner for leading quantitative investment solutions.
Already at Jackson Hole in 2022, Jerome Powell made clear that the Fed would have to inflict some economic pain for it to be able fulfil its mandate. Tightening cycles in the US often end up breaking something1. This is why we have been highlighting over the last few months that there is a high risk of a US recession later this year2. However, anticipating what exactly the Fed will break tends to be a difficult undertaking. Nevertheless, just seven months after Jackson Hole, the truth seems be trickling through as three US banks have defaulted recently with contagion risks destabilizing other wobbly lenders, like Credit Suisse who had to be rescued by rival UBS and Deutsche Bank who has been on a roller coaster ride since last Friday.
But why does the Fed need to break things to do its job? The answer is because its policies tend to allow for excesses in the first place, which later must be cleaned up. Looking at the present interest rate cycle, it is easy to blame the Fed for its expansionary monetary policy between late 2020 and 2021, when the US and global economies were clearly expanding vigorously, if not overheating. At the same time, fiscal policy was still extremely loose. This policy mix gave carte blanche to inflation that took the opportunity to accelerate. The problem is that once a country has entered a high-inflation phase, it is difficult to control price surges3 as the inflation-wage-inflation spiral often ignites and develops a dynamic of its own. The easiest way to put a stop to this spiral is by throwing sand in the gears of banks, which often triggers a recession and a rise in unemployment4.
The question is whether the Fed has already broken enough stuff to control inflation or if it has broken even too much which could unleash another 2007/08-style financial crisis. Our models (risk and equity allocation) agree that currently there is only moderate or even low systemic financial risk. And even from a top-down perspective, vulnerabilities and, therefore, contagion risks seem below historical averages and manageable. Whether the Fed broke enough to bring inflation down, we will only know in hindsight. But signs are emerging that labor market conditions are starting to ease, and that banks’ lending standards are tightening.
Therefore, Fed governor Powell’s comments at the March FOMC meeting, that tightening lending standards and a possible credit crunch may do the Fed's job should be seen as an indication that a dovish Fed pivot starts to materialize. This should, as we highlighted last month, keep the door open for a grace period during which risky assets such as equities can recover from their mid-March lows. A recession-driven market correction seems still a bit too far out at this point, assuming near-term stabilization of banking sentiment.
Sentiment soured around the days of the US banks' and Credit Suisse rout. Swift Fed action, offering a liquidity facility in exchange for high-quality collateral and protection of depositors helped stabilize markets quickly. After an initial spike to above 26% at the height of market stress, equity volatility (VIX) reversed two thirds of the increase and settled at 22% at the time of writing.
However, bond volatility is struggling to come down from the mid-March rise. The VIX/MOVE ratio, which measures equity relative to bond volatility is on its lowest level since 2016. However, this is not overly surprising as the current market environment is more challenging for bond investors. A stabilization of market sentiment is positive for equities, but not necessarily for bonds, as declining market stress increases the chances of a continuation of the tightening cycle leading to higher rate volatility.
Swift central-bank intervention had not only implications for market volatility but also for our risk model SDRM5. While it did briefly detect similarities between today’s environment and the Great Financial Crisis of 2007/2008, it quickly discarded potential parallels when central banks swooped in. As a result, our model moved back to the comparison with the late 1980s of a heightened but not an escalating risk environment.
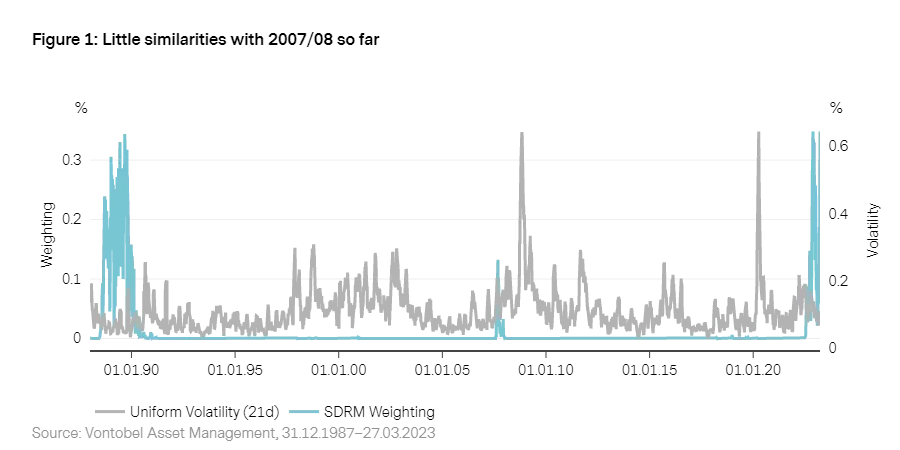
5. For an introduction to the model, please see Risk management: Forward on calm seas, adaptive and agile in stormy phases .
The global Wave6 remains in recovery, despite the ongoing policy tightening in developed markets. The recovery signal continued to gain ground because for the first time since 2021 less than 50% of the countries in scope remain in contraction. However, as real monetary growth is contracting by 5.5% year-over-year, global liquidity conditions remain historically tight which puts the probability of a fall back into contraction close to 50%. The country that has most recently fallen victim to this risk is the US that has started to feel the pain of policy tightening which has pushed the country back into contraction. This seems to echo the Fed's warning of an emerging credit crunch that may lead to a recession later this year
Over the last few months, the recovery in developed markets has mainly been driven by soft (survey based) economic data. Hard economic data continues to come in mixed, with housing remaining the weakest link. Labor market conditions remain historically tight in most of the G7 economies (except for Italy), keeping the risk of a near term recession still moderate, but signs of easing labor market conditions are emerging. However, the Wave improvement in Central Europe and eurozone countries over the last few weeks, is overshadowed by the US banking crisis which has exposed the first cracks in the system resulting from the pain the current policy tightening is inflicting.
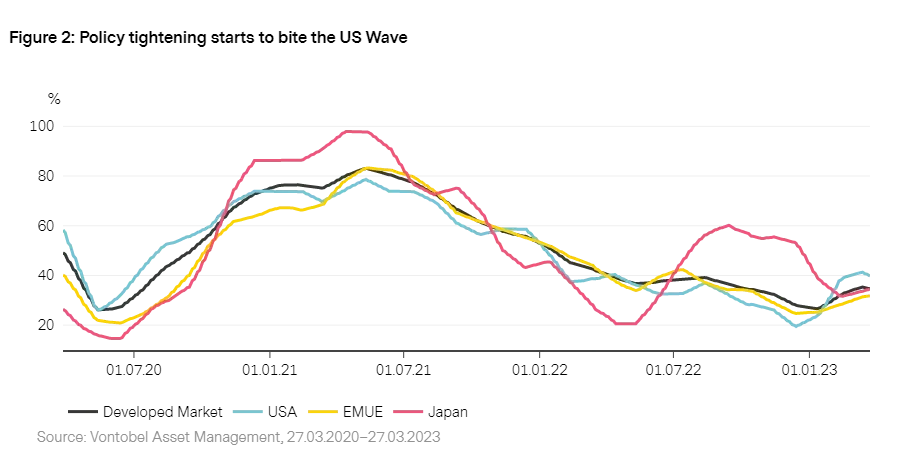
The China Wave jumped by +15 percentage points, a strong month-on-month improvement and a rare occurrence for the Wave. As all sectors of the Chinese Wave showed an improvement, signs are clear that the post-COVID re-opening helps the Chinese policy stimulus to finally arrive in the economy. Most importantly, all production stages (new investments, housing starts, construction, completion, and sales) of the housing market seem to be past their bottoms. Moreover, fresh policy stimulus is on its way as the People's Bank of China recently announced reserve requirement ratio cuts, which releases bank liquidity for the economy and supports real money growth. Therefore, the probability that China, Asia and even the whole of emerging markets will remain in recovery is significantly higher (72%) than for most developed markets (50%). Within emerging markets, only Latin America is currently struggling due to the commodity downturn over the last few quarters.
6. See “ The Vescore Wave – a superior business-cycle model ” for a deep dive into the Wave business cycle model
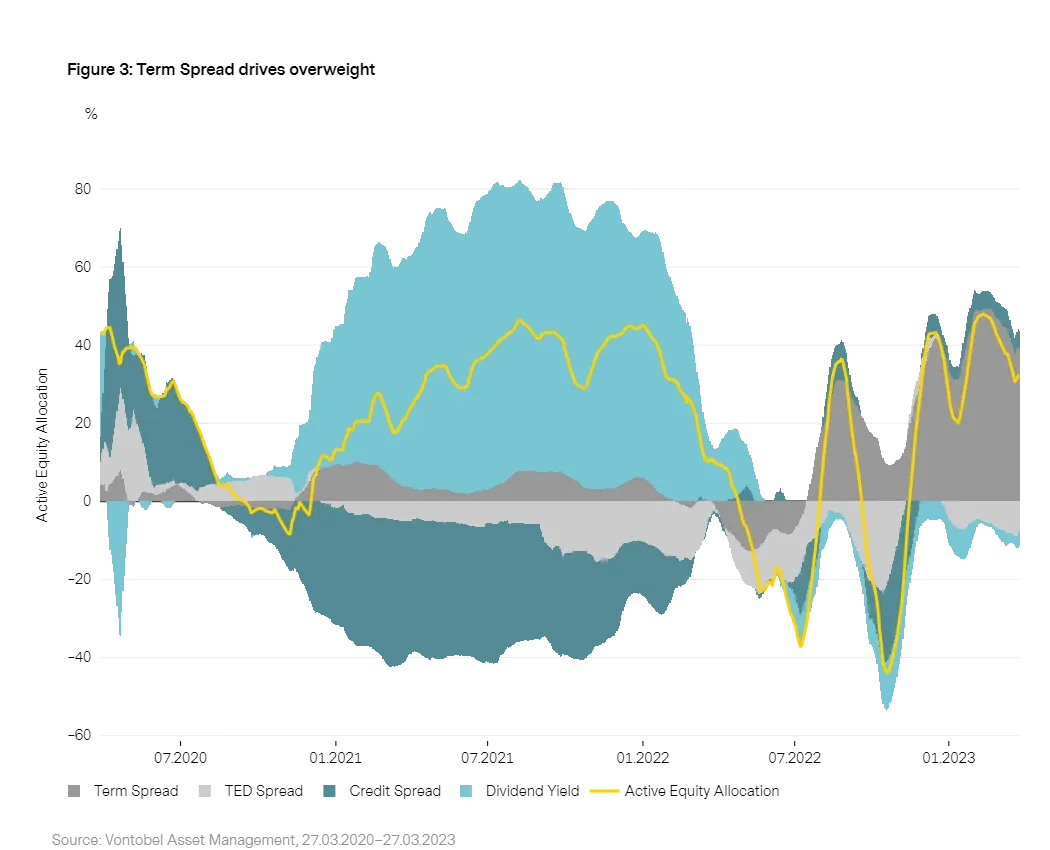
The financial market turmoil surrounding the default of the Silicon Valley Bank and scandal-stricken Credit Suisse affected our equity model variables only briefly and did not make a noticeable dent to the continuous equity overweight we keep running. The term spread remains the most important variable driving our positioning in equities, albeit at a slightly decreasing rate. The drop in rate expectations due to banking turmoil has been fueled by hopes for accommodative central bank measures while at the same time inflation expectations have decreased as well. The model still takes central-bank support in response to a deteriorating economic outlook as positive for equities, with the caveat that much has been priced in already which explains the slight reduction in bullish sentiment in the model. Banking liquidity, measured by the TED spread reached alarming levels only fleetingly which serves as an indication that contagion risks and interbank liquidity normalized relatively quickly. While the TED spread's contribution to the allocation is negative, it is only moderately so, pointing to limited contagion risks.
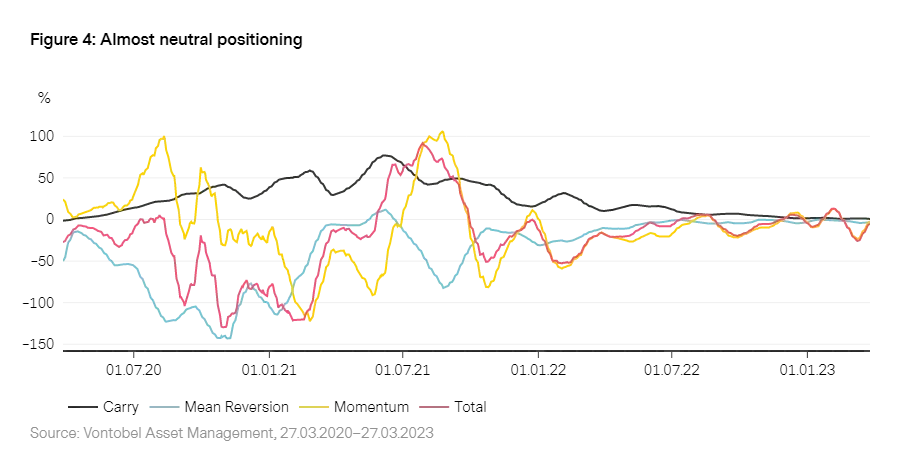
The environment for bond investors remains challenging as rate volatility has surged. On March 13, the 2-year Treasury yield experienced its biggest daily drop (61 basis points) of the last 40 years. The main reason for the volatility is the uncertainty around the Fed reaction function as they must weigh financial stability against inflation risks. While our bond allocation model has been reducing its underweight in response to strong momentum in bond markets, it refrains from taking sizable positions and prefers to stay on the sidelines with a close to neutral position for the time being.
As we have seen in previous chapters, our models do not detect increased contagion risks within the banking system or signs that a full-fledged financial crisis is imminent. Some variables did flare up with heightened risk briefly – but only until central banks took decisive action to contain the crisis.
To back this up, we complemented our models' analyses with a top-down perspective. The following is based on banking crisis literature,7 which came to prominence in the aftermath of the Asian crisis in 1997/98. Key indicators that have been found to be helpful in flagging vulnerabilities in the banking sector are:
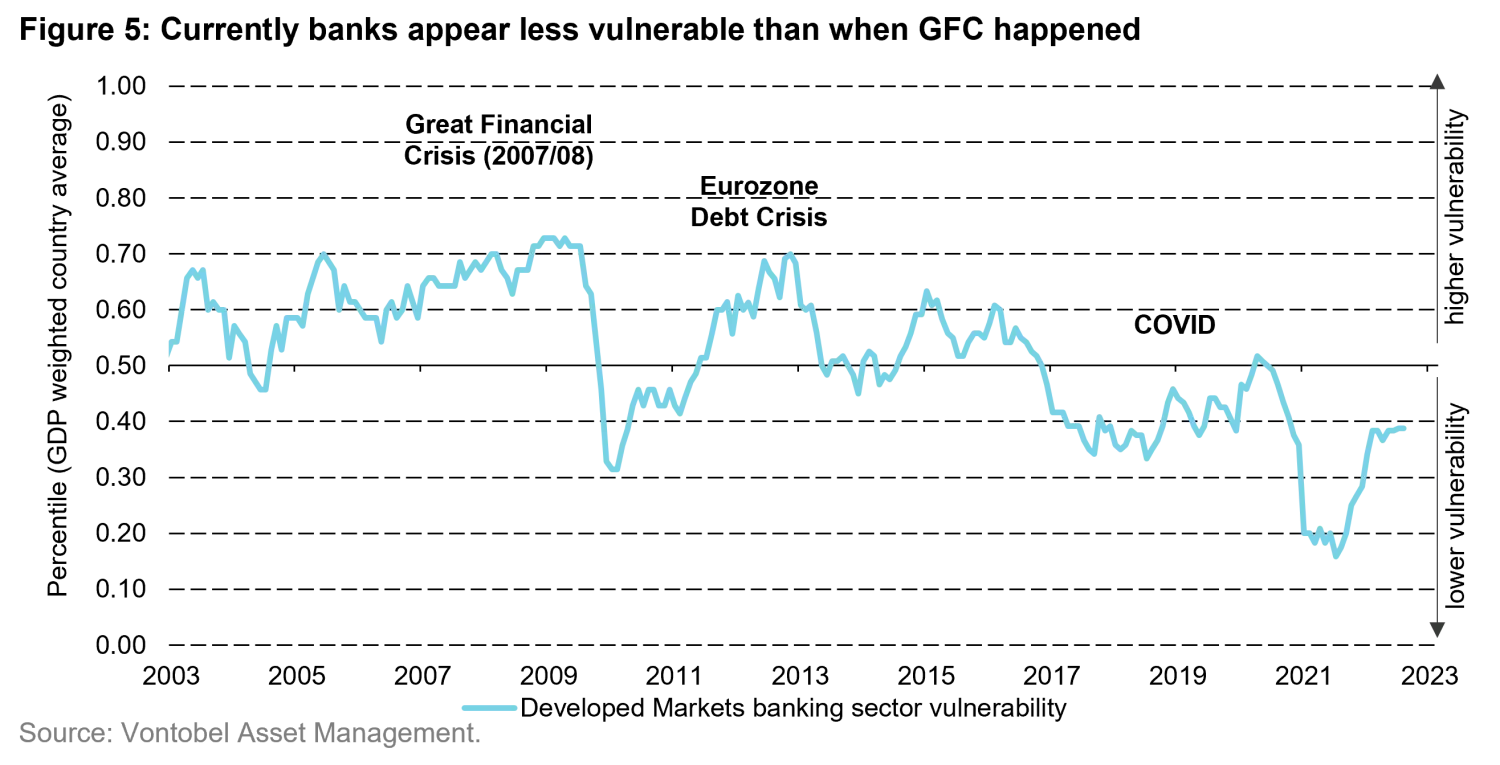
A vulnerability indicator8 consisting of a range of indicators9 with predictive power for banking sector crises confirms the observation of our models, that banking sector vulnerabilities in developed markets have improved over recent years thanks to years of tight bank regulation and deleveraging. Clearly, this analysis has several drawbacks, since it is an industry average with a bias towards larger exchange-listed banks and cannot spot all possible risk factors. However, it does provide transparency on the usual suspects of banking sector vulnerabilities whose latest levels seem to be in alignment with Jerome Powell’s assessment that the US banking system is sound. However, this robustness could come under threat if bank deposits continue to drop at the same rate as they recently have - a circumstance which has brought down the above-mentioned US lenders. Bank deposit withdrawals have accelerated since the head of the US Treasury department Janet Yellen refused to give a blanket insurance for all US bank deposits exceeding the current 250 000 limit. But it could be that this is needed to calm everybody’s nerves if withdrawals continue.
7. See for example Kaminsky and Reinhart (1999) «The twin crises: the causes of banking and balance-of-payments problems”, American Economic Review, 89 (3), 473-500
8. Methodology as outlined in Schubert (2010) “
Theoretische und empirische ex post Analyse zur Früherkennung von Währungskrisen und eine ex ante Untersuchung osteuropäischer Währungsturbulenzen in 2008/09
"
9. Domestic credit to GDP, M2-Multiplier, our Wave business cycle model, Real deposit rate, Lending to deposit rate, Tier-1 risk weighted capital ratio, Return or Equity and Assets and non-performing loans have been used for the vulnerability indicator.
1. The tightening cycle in the 1980’s triggered the loan and saving crisis and the tightening cycle in 2005-07 ended in a global housing and banking crisis.
2. See “
What do our models think about US recession risks?
”
3. See “
Six reasons why inflation may feel like gum on your shoe
”
4. See Ball et al. (2022) “
Understanding U.S. Inflation During the COVID Era
”, IMF, WP. 2022/208
Important Information: Past performance is not a reliable indicator of current or future performance. Indices are unmanaged; no fees or expenses are reflected; and one cannot invest directly in an index Any projections or forward-looking statements herein are based on a variety of estimates and assumptions. There can be no assurance that estimates or assumptions regarding future financial performance of countries, markets and/or investments will prove accurate, and actual results may differ materially. The inclusion of projections or forecasts should not be regarded as an indication that Vontobel considers the projections or forecasts to be reliable predictors of future events, and they should not be relied upon as such. Diversification and/or asset allocation neither assures a profit nor eliminates the risk of investment losses. Vontobel reserves the right to make changes and corrections to the information and opinions expressed herein at any time, without notice. This document is for information purposes only and does not constitute an offer, solicitation or recommendation to buy or sell any investment instruments, to effect any transactions or to conclude any legal act of any kind whatsoever.
