U.S. elections 2024
Quantitative Investments
Market Insights and Strategies
This year, nearly half of the global population will be casting their votes across the 64 countries highlighted in Figure 1.
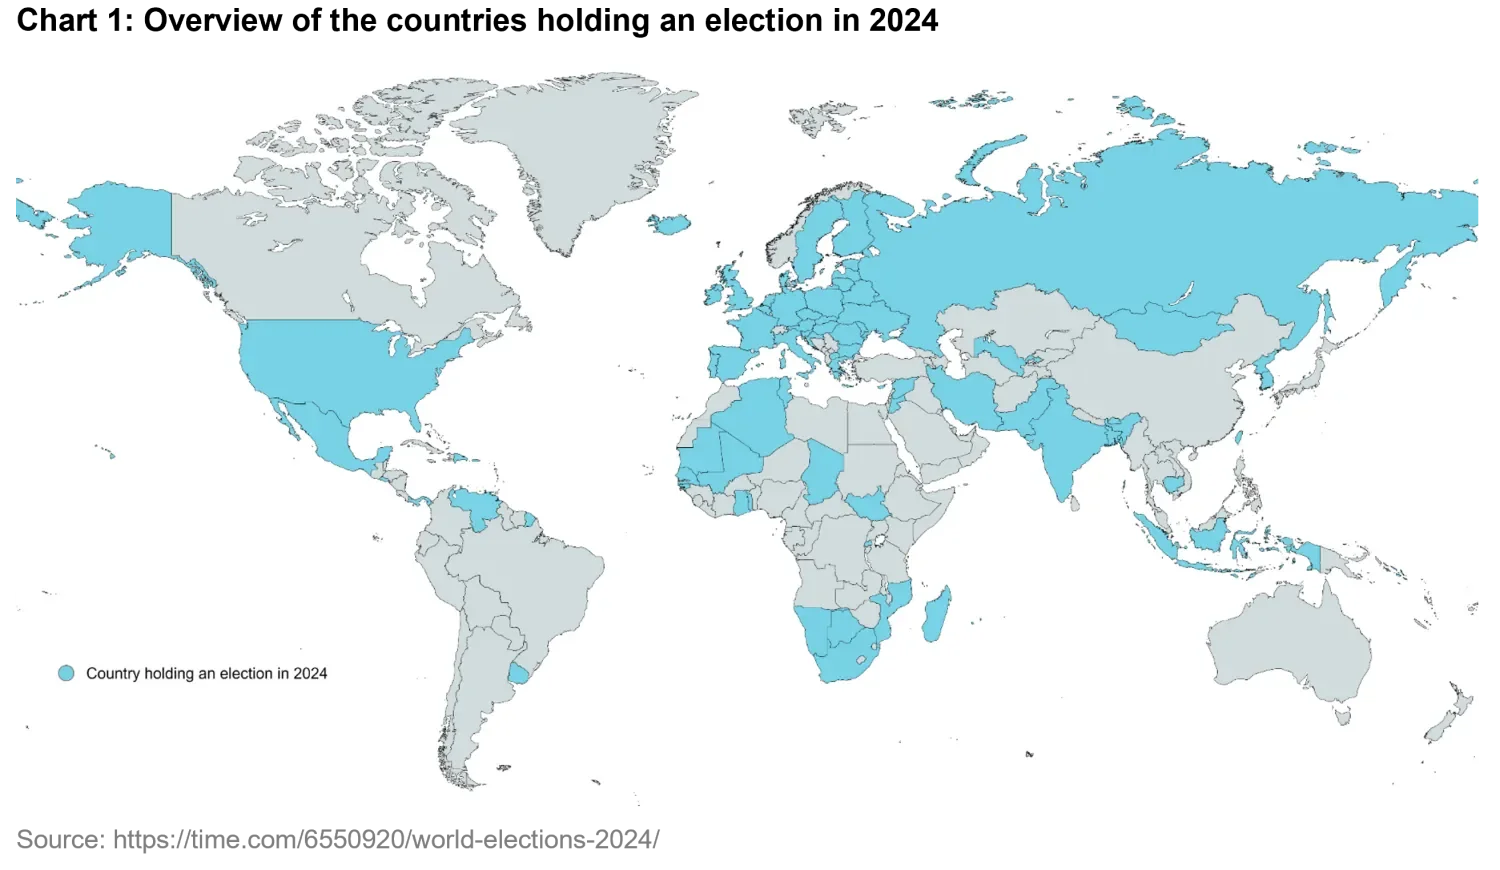
Among these, the U.S. presidential election is of clear relevance for investors. While the U.S. population only represents about 8 percent of the total population of these countries, it makes up approximately 26 percent of global GDP, and accounts for 66 percent of the total market capitalization across voting countries. The U.S. also plays a critical role in energy markets, as a leading exporter of liquefied natural gas (LNG).
Which parts of financial markets will be most affected (and how) is a function of who gets elected, and the policies they seek to implement, domestically and abroad.
In this article, we will explore how U.S. elections have historically impacted equity markets, particularly noting a trend of positive performance after the primaries. We will also examine the correlation between a candidate’s likelihood of winning and the performance of thematic investment portfolios that align with their proposed policies. Finally, we will dis-cuss our proprietary model for poll predictions, which currently indicates a high degree of uncertainty regarding the election outcome.
Why Should You Care?
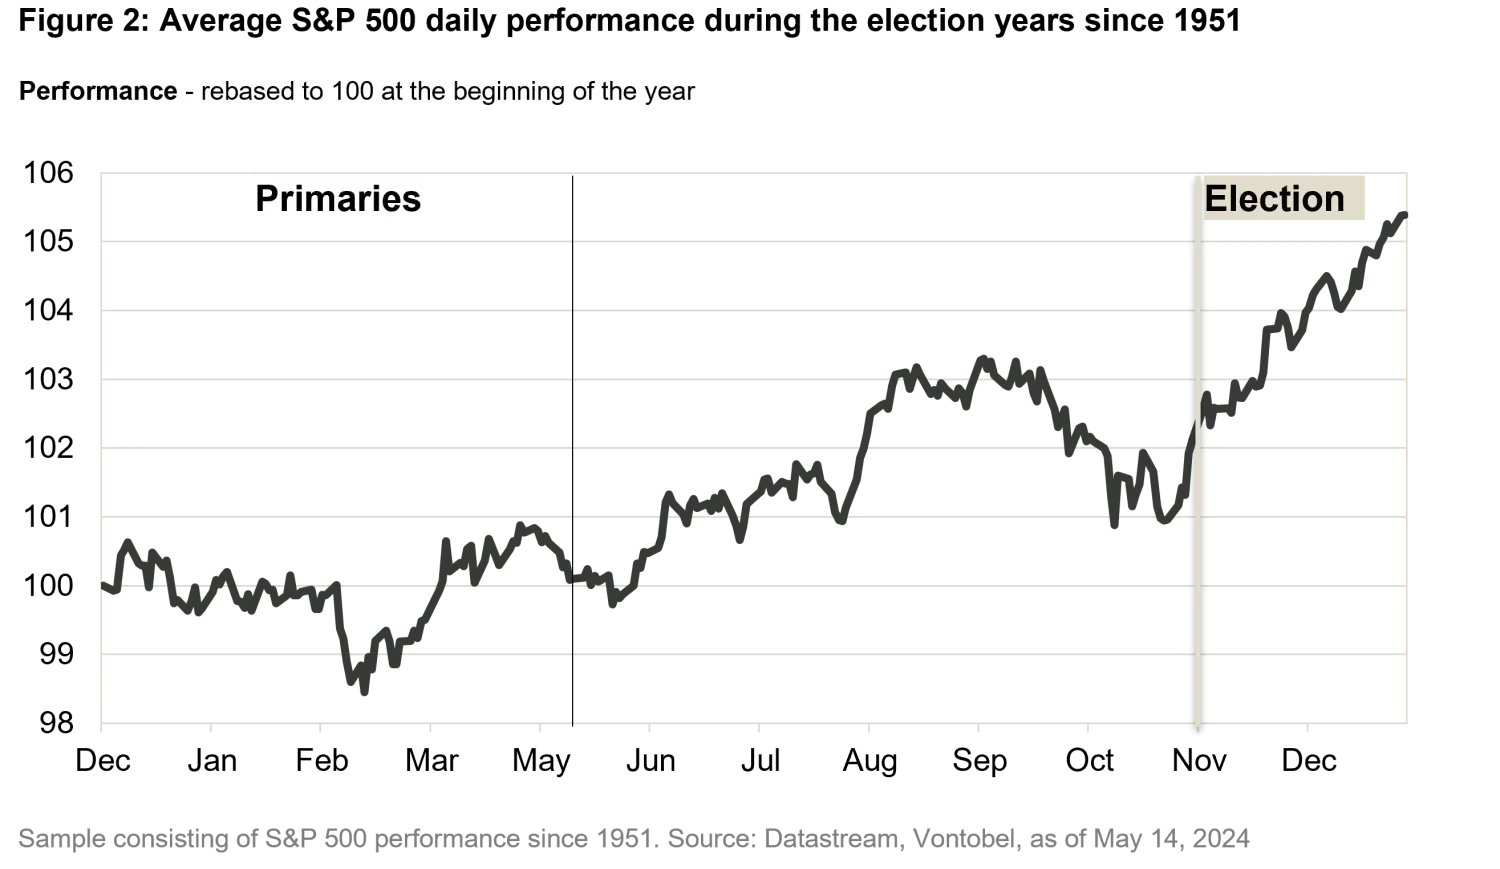
Figure 2 shows the S&P 500 average daily returns during all 19 election years since 1951. As the chart demonstrates, investors often gain by taking a long position in the S&P 500 and holding it into year end, but only after the primaries.
This pattern suggests that the market often responds positively to the resolution of primary uncertainties, although this is not a guarantee and can vary based on broader economic conditions.
Figure 3 depicts, for each election year since 1872, the S&P 500 performance during the post-primaries through to the election day, highlighting in blue vs. red the party of the winning candidate. We calculate an average 6.5 percent performance during the period. There are clearly some notable outliers, such as in 2008 during the Global Financial Crisis (GFC).
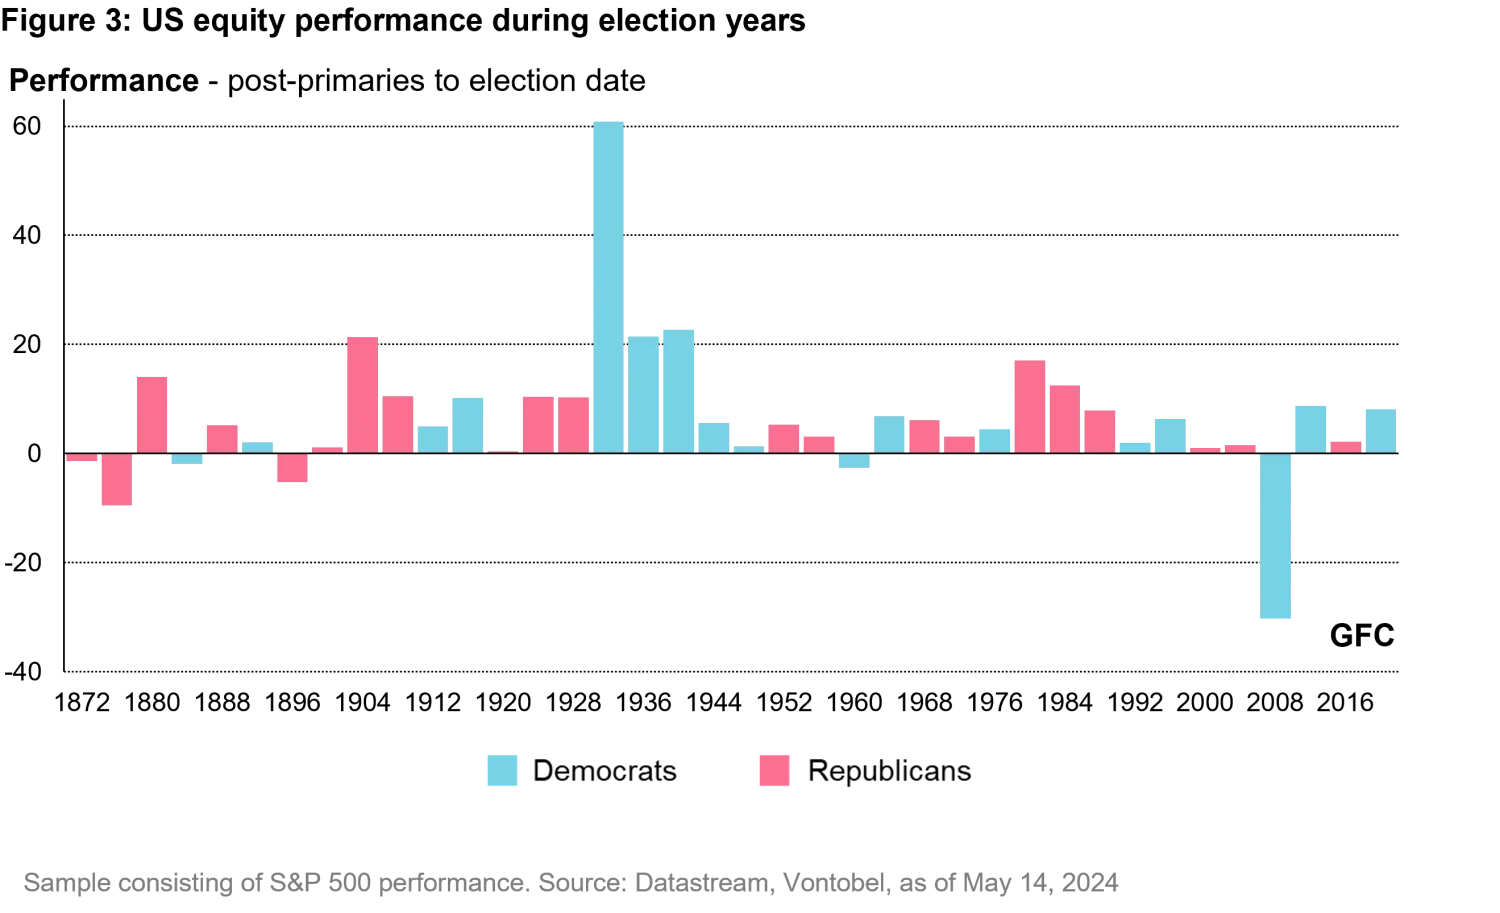
Our analysis of historical returns calculated between the primaries and the election date shows that while the average returns for Democrat years were slightly higher (Mean = 7.70 percent, Median = 5.64 percent) compared to Republican years (Mean = 5.58 percent, Median = 5.17 percent), these differences were not statistically significant1. This tells you that knowing the winning party in advance would not yield any information advantage.
When comparing election vs. non-election years since 1951, one notices that on average non-election years performed better than election years, and that by 4.1 percentage points, as represented in Figure 4, where the average cumulative returns for the S&P 500 are shown. Remember that there is a difference in sample sizes (19 election years and 52 non-election years), as elections only occur every four years.
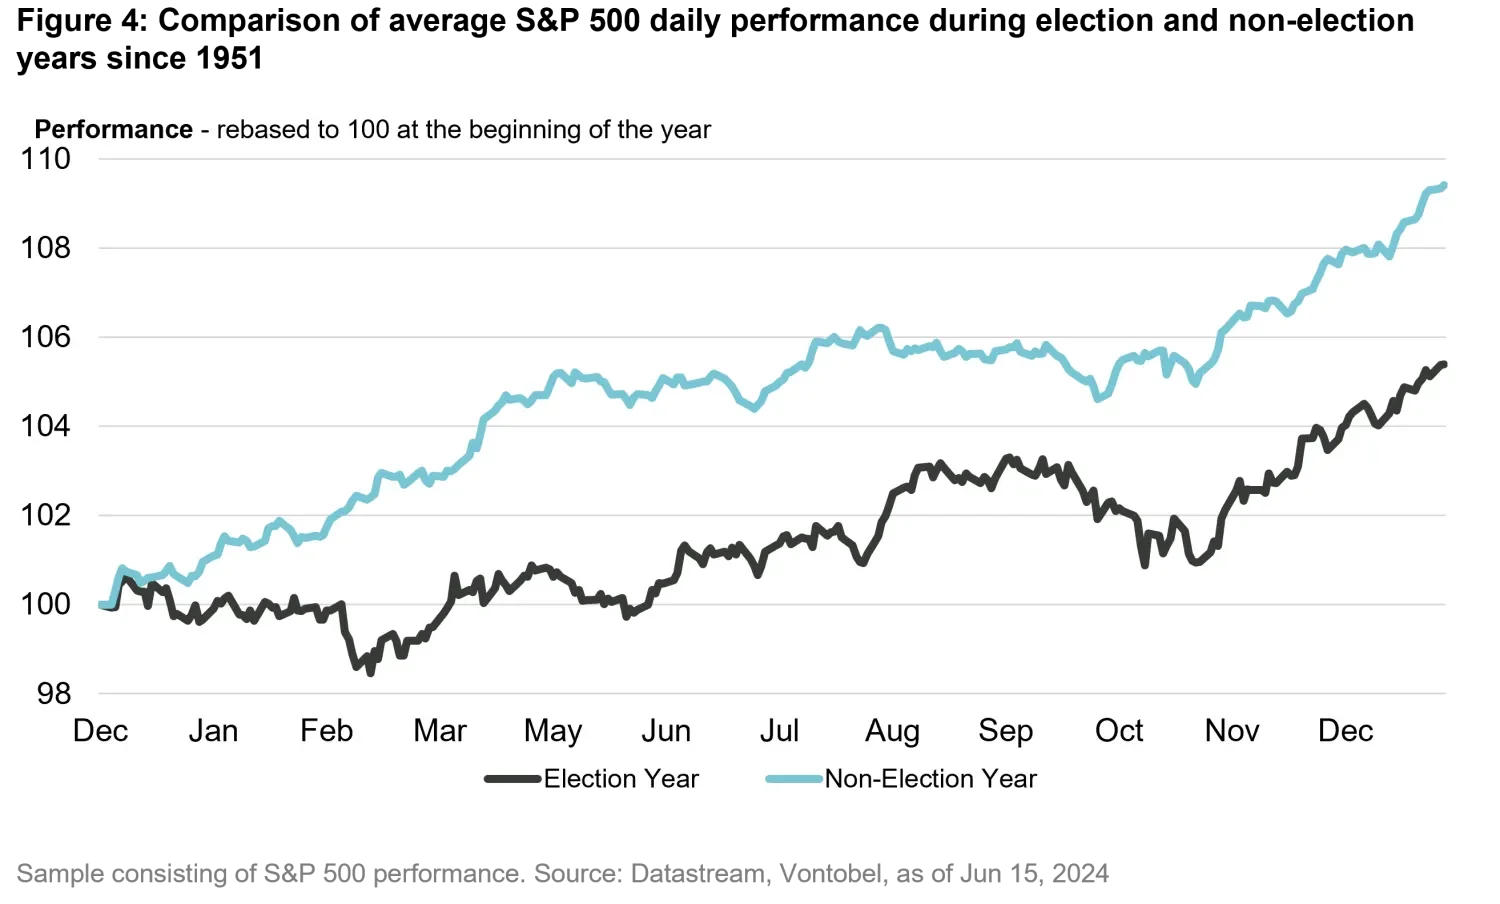
Figure 5 shows the performance if we invested after the primaries. Our analysis shows that there is no statistically significant difference between election and non-election years if you take a long position in S&P 500 and hold it through to the end of the year.
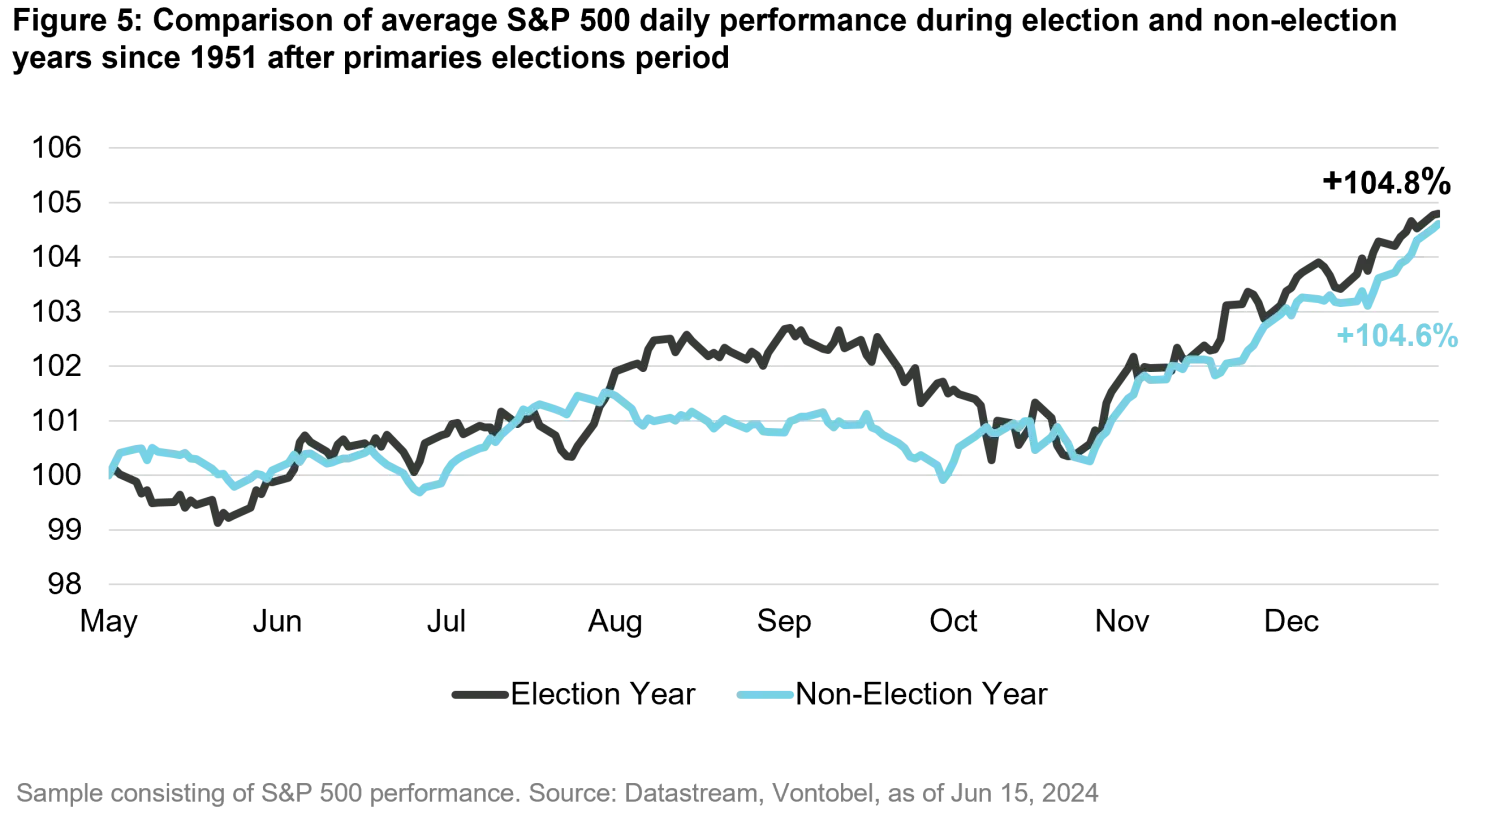
What does it all mean? The conclusion is that the difference in performance during an election year stems from the resolution of the uncertainty post primaries.
Should you obsess about predicting winners?
The analyses conducted in the previous paragraph highlight that, while it makes sense to build a long position in the S&P 500 post primaries during election years, knowing which party will win does not add extra value. At least if the only option you have is to go long the S&P 500.
Why do we then obsess about predicting the winner (beyond of course the entertainment value of the act)? The answer lies in the sectors and market segments that are poised to profit from the policies of the winning candidate.
If, for example, we knew that one of the two candidates would favor investments in the health care industry, pharma companies should rise faster than the market as the odds of the candidate winning improve.
This is indeed what happens. As an example, Figure 6 depicts the evolution of the probability of Trump winning (right y-axis) vs. the performance of related thematic portfolios2 (left y-axis). As one can see, the two rise in unison.
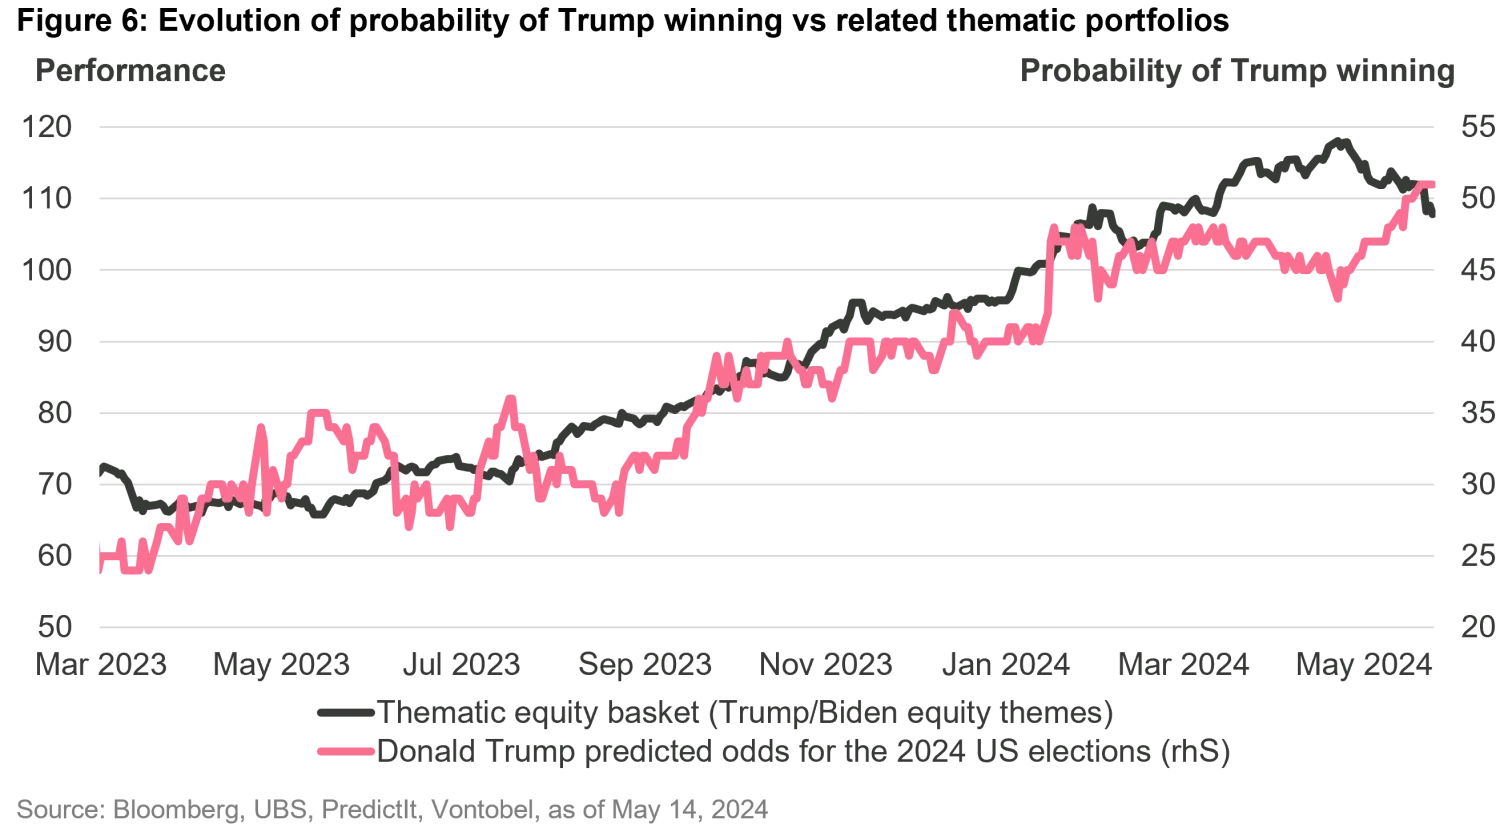
This correlation between poll predictions and theme performance makes the case for why it may make sense to forecast who’s winning.
What’s the situation now?
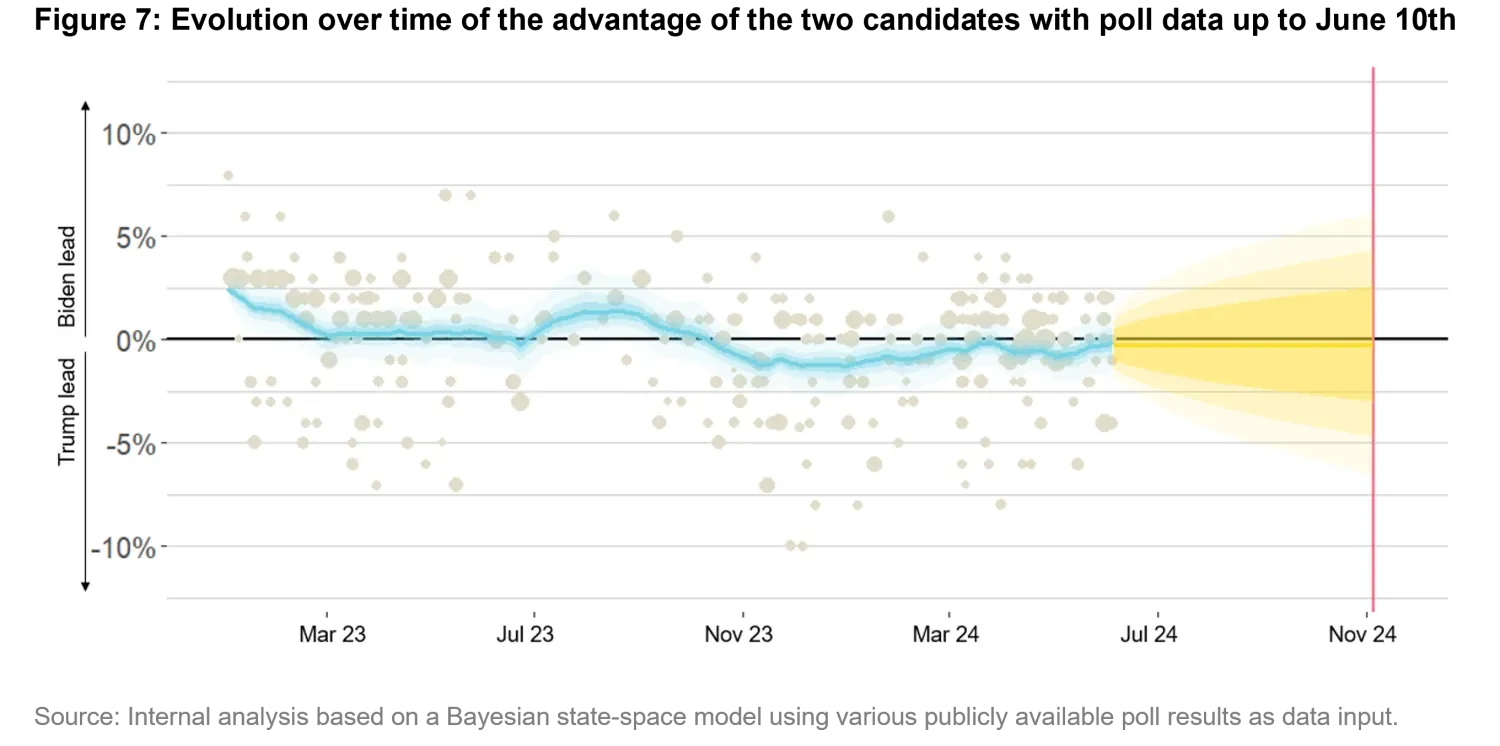
Figure 7 depicts the evolution over time of the relative advantage of the two candidates (blue line) based on poll results (grey dots), and the resulting forecast (yellow cones) for election day. As one can evince, Trump slightly leads the polls since October 2023. However, as we will discuss later, this margin is not statistically significant.
How does the model work?
While single polls are useful to get an initial idea of current election preferences, a more robust approach involves aggregating multiple public polls from different poll houses to achieve a more meaningful sample size. In our case, we use a Bayesian state-space model for the aggregation.
Different polls can have different results even on the same date (look at the dispersion of the sand-colored dots corresponding to poll results. Incidentally, the bigger the dots, the bigger the sample size). This happens because of systematic biases that poll houses have while conducting the poll, due to different sample characteristics and different methodologies.
The model addresses this challenge by aggregating those results and accounting for each poll house's bias (by assuming a zero-cumulative poll houses bias). This increases the overall precision of the prediction.
The outputs of the model are the blue line, which tracks the changes in polls advantage over time, and the prediction cone (in yellow), which projects the blue line to the election date.
Note that one limitation of the model is the fact that the U.S. does not have a majoritarian election system but uses an electoral college system, where each state votes for a number of Grand Electors, who then vote for the president. As a result, predictions based on polls will only approximate the election mechanism.
Is the Republican lead statistically significant?
In short, and as mentioned earlier, the answer is “no”. Our answer is based on the application of the model on a cumulative sample size of 500,000 individuals questioned by 45 poll houses from January 2023 to Jun 2024. Figure 8 shows the distribution of the election prediction at the election date (the yellow cone projected on the pink line in Figure 7) along with the confidence intervals associated with the prediction.
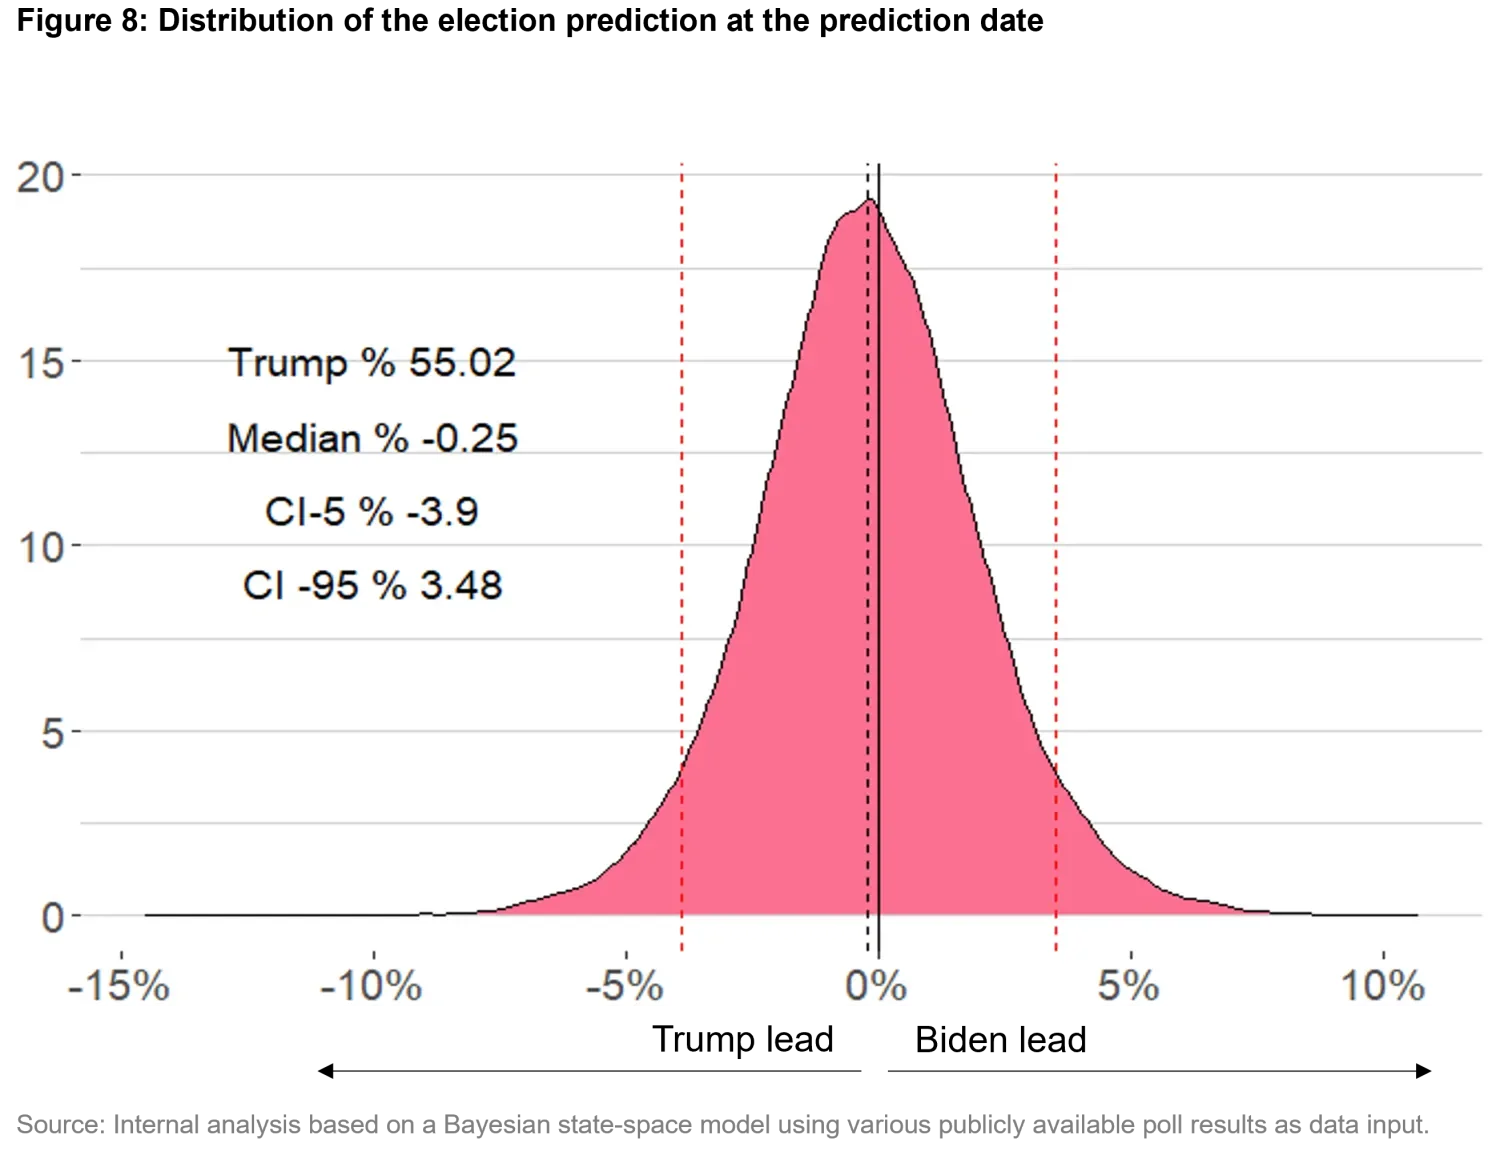
Negative numbers indicate a Trump lead, while positive numbers a Biden lead. In this specific case, while Trump is leading, the prediction is not statistically significant (i.e., undistinguishable from a 50/50 prediction), as the confidence interval includes zero.
The median prediction Is at -0.25 percent, suggesting a slight lead for Trump. However, the confidence interval ranges from -3.9 percent to 3.48 percent. The inclusion of zero in this interval means that neither candidate is definitively leading, underscoring the high level of uncertainty in the outcome.
Said differently, the Trump margin would have to increase (in absolute levels) from -0.25 percent to -3.73 percent (i.e., the 3.48 p.p. difference mentioned above) in order for the difference to start becoming significant.
Beyond its forecasting capabilities, there is value in the model in that, as new poll results get published, the model can make sense of new results in the context of previous poll outcomes.
What should you do?
Overall, while U.S. presidential elections are undeniably significant events with wide-reaching implications, this analysis indicates that the party of the winning candidate has not historically had a meaningful impact on short-term S&P 500 performance.
The S&P 500 tends to rise during election years in the period post-primaries through to election day, regardless of the winning candidate.
However, knowing who wins does impact the respective thematic portfolios, defined as portfolios made of stocks which tend to benefit from the policies enacted (or promised by) either candidate.
Currently, our poll analysis reveals that neither candidate stands a statistically significant chance to win over the other. Therefore, we recommend a long position in both baskets.
1. We used both the Mann-Whitney U and the Kolmogorov-Smirnov tests to arrive at this conclusion.
2. I.e., portfolios that stand to benefit from the policies of the winning candidate.
Sources
Market cap data: https://data.worldbank.org/indicator/CM.MKT.LCAP.CD?end=2022&most_recent_year_desc=true&start=1975&view=map
The U.S. plays a critical role on the global stage, with significant influence over global energy markets: https://www.state.gov/briefings-foreign-press-centers/review-of-the-current-us-global-energy-policy-priorities
https://www.csis.org/analysis/us-natural-gas-global-economy-0 polls prediction model: Simon Jackman, Pooling the Polls Over an Election Campaign Australian Journal of Political Science, Vol. 40, No. 4, December, pp. 499–517


