

Quantitative Investments
Your partner for leading quantitative investment solutions.
Are we experiencing a bear market rally1 or entering a new bull market? As is so often the case, we will not be able to give a definitive answer to this question until a later date. Nevertheless, historical data can shed some light. To do so, we use our quantitative models that analyze and evaluate the market based on macroeconomic and financial market data.
Using a pattern recognition algorithm, our SDRM risk model 2 in particular is currently observing a striking number of similarities to market phases in 1990 and 2007. Both of these were turbulent times for financial markets. The macroeconomic top-down perspective also indicates an increased probability of remaining in the bear market: both the massive fiscal packages introduced in 2020/21 due to the pandemic and quantitative easing are currently being scaled back. This is reflected in a sharp decline in global liquidity, which serves as a forward-looking component of our business cycle model “Wave”.
However, remaining in a bear market3 by no means rules out further rallies. The last 20 years have seen a total of five bear markets (2000-02, 2007-09, 2018, 2020 and 2022), which – with the exception of 2020 – all included at least two rallies.5 In one of these rallies in 2000-02, the S&P 500 climbed by as much as 21% before prices dropped again. There are good arguments to assume at least one short-term rally within a bear market. This is especially true if the Fed’s monetary policy tightening and US inflation have already peaked.
This is supported by improvements in global supply chain issues and the fact that commodity prices declined again over the summer. Weaker global consumer data also point to a slowdown in inflationary pressure. This explains why interest rate and inflation expectations decreased between mid-June and the end of August, ultimately shoring up bond and equity markets. Lower interest rate and inflation expectations typically mean a steeper yield curve, based on the short end. Both our bond and our equity allocation model see this as a good thing, especially over the term spread.
According to this, bad economic news is a good sign as market participants assume that the Fed will ease its restrictive monetary policy in the future – even though representatives from the Fed and the European Central Bank at the annual central bank meeting in Jackson Hole were reminiscent of former Fed Chairman Paul Volcker’s extremely restrictive monetary policy. It thus remains to be seen how the Fed will respond to sustained weak economic data combined with declining inflation and whether it will be willing to adopt a potentially “painful” cycle of interest rate hikes. Our models are signaling reasonable doubt, as long as bad news for the economy is good news for the equity market. Given this, it seems like there is still scope for the bear market rally to continue.
Would you like to gain further exciting insights into our in-house business cycle model? Then register now for our monthly Wave Call.
Pre-crisis phases since the 1990s became increasingly important in our SDRM model in August, which compares the similarity of past market situations with the current market environment. Of the 50 most similar days in the past – the closest neighbors to today – many days in spring 1990 and fall 2007 stand out.
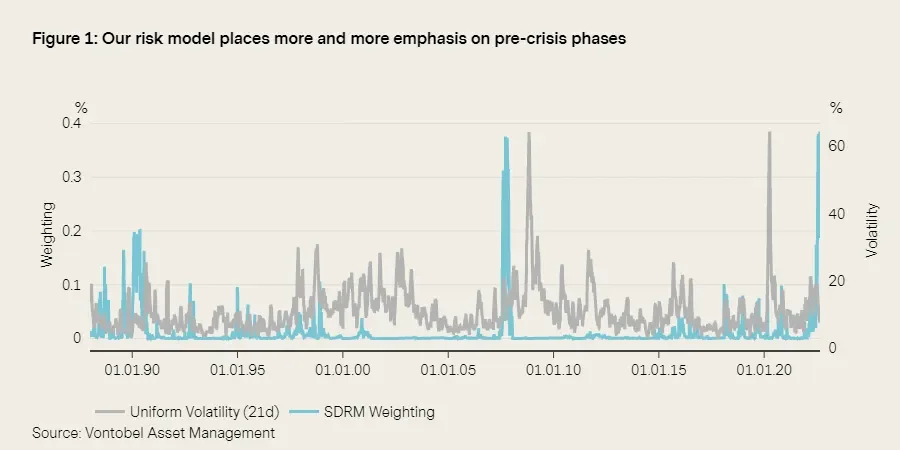
Figure 1: Period: January 1989 to August 2022.
Looking at historical events at this time, February 1990 saw a serious political crisis unfold between the US and Iraq, which led to the Second Gulf War in the summer and massively pushed up the price of crude oil. A market downturn began in late fall 2007, with the prices of financial products collapsing and a loss of confidence on the interbank market at a time when it was already clear that the global economy was about to enter a difficult phase. In addition, the model is also currently giving significant weight to the period prior to 1994, when bond yields increased unexpectedly sharply and caused considerable price losses.
We believe that current market uncertainty is coming primarily from the bond market, which is still heavily impacted by central bank monetary policy and, in turn, by interest rates. This can also be seen in the Move volatility index developed by Merrill Lynch, which measures the implied volatility of US Treasuries with varying maturities. It has risen steadily since the start of the year to a historic high of 1.16%. The same trend was seen in 1994.
Although we observed a temporary increase in August, the trend towards lower equity volatility as measured by the VIX Index indicates that equity markets are stabilizing. The index temporarily fell below the 20-point mark in August, reaching levels seen in April 2022 when the Fed began its cycle of interest rate hikes. As well as the decrease in inflationary pressure recently, the main reason for this easing and recovery on the market is that corporate profits in the current reporting season were better than expected. This caused fears of a recession, which had dominated the last few months, to fade into the background somewhat.
Prices for futures contracts suggest that market participants are now pricing in a less rigorous schedule of interest rate hikes and expect interest rates to fall again next year.
Wave has been in “recovery” both for developed and emerging markets since the end of June. However, about a week ago we began noticing that the number of countries returning to “contraction” was picking up again. This is consistent with our analyses, where we examine the drivers that are required for a sustained economic recovery. We conclude that key variables such as fiscal and monetary policy, money growth, yields and yield curves are not yet giving the green light for sustained economic recovery and thus for the start of a bull market.
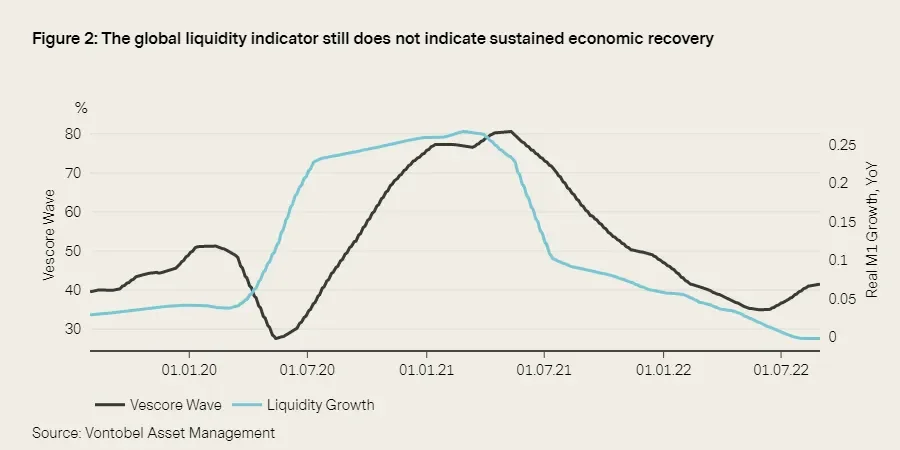
Figure 2: Period: July 2019 to August 2022.
Our proprietary business cycle model Vescore Wave had been signaling an economic recovery on both developed markets and emerging markets since mid-June, but the economic scenario now seems to be clouding over again slightly. While both the developed and emerging market Wave remain in “recovery”, the number of countries where economic momentum is declining at present or that have returned to “contraction” has risen to 46%. This has also slightly increased the probability of the global economy dropping into a period of “contraction” to 40% for the month ahead.
As monetary policy decisions tend to take 12 months or more to have an effect on the economy, the narrative of monetary policy tightening as a reason for this slow flattening of the “recovery” seems premature. Nevertheless, the cycle of interest rate hikes was well anticipated by forward markets, with US interest rate futures already beginning to increase rapidly last summer. Prices of commodities and, in particular, energy have also skyrocketed, and this is increasingly being felt by private households. The first sign that higher interest rates are gradually affecting the economy can be seen on the real estate market, with the housing market component of the Wave currently showing the weakest economic momentum at 23%.
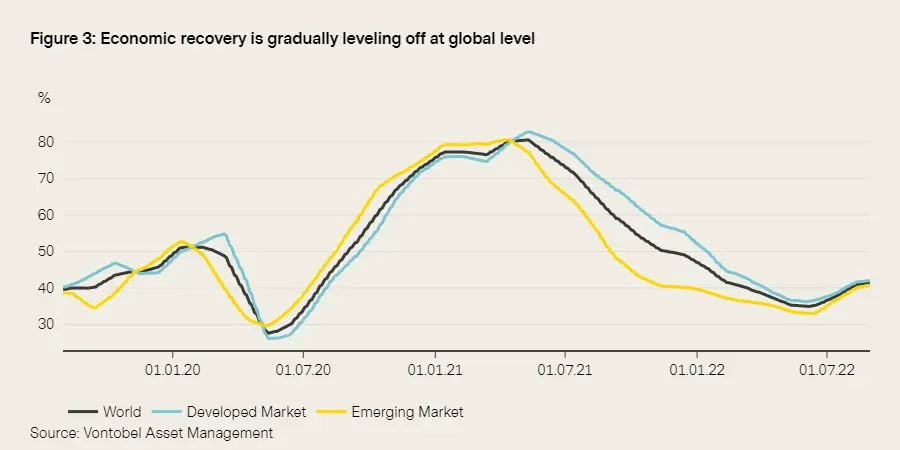
Figure 3: Period: July 2019 to August 2022.
At 42%, the Wave in developed markets is still in “recovery”. Nonetheless, 50% of developed markets are again in “contraction”. This increase in the number of countries is attributable exclusively to Europe, with the sharpest declines being seen for Germany (down 6 percentage points), Spain (down 6 pp.), and Portugal (down 5 pp.). The economy is improving chiefly in developed markets outside Europe, with the US (up 5 pp.), Australia (up 4 pp.), and Japan (up 3 pp.) topping the board.
Sustained high US inflation, combined with robust economic data and a far tighter labor market, suggest that the Fed will continue to tighten monetary policy. The latter has already increased the rate of wage growth significantly, as there are currently two vacancies for every person out of work. This situation was last seen in the 1950s. US monetary policy is causing slower growth in global liquidity, which creates headwinds for the global economy and calls the potential “recovery” into question – especially for Europe, which could also be hit by an energy crisis this winter. Given these factors, the Wave currently shows a very high probability of a “contraction” (82%).
After a substantial recovery in June and July, the emerging markets Wave picked up only barely in August (+1 percentage point), with the economic knock-on effects of the war in Ukraine now increasingly evident in eastern Europe – despite a lack of data published in countries that are directly affected such as Russia and Ukraine. While eastern Europe receded into “contraction”, Asia is still in “recovery”. Nevertheless, this is due primarily to China. Although the country’s zero-COVID-19 policy has been relaxed, consumer behavior weakened in July and the real estate sector, which is important to many sectors, has not yet bottomed out.
Despite the recent upturn, volatility on equity markets has declined significantly since mid-June. In turn, our equity allocation model increased equity allocation last month. After -20.4% in the previous month, at the end of August we put overweighting at 36.5%. The positive equity allocation is driven chiefly by tensions on the bond market, which makes equities more attractive than bonds.
All four of the underlying instrumental variables (term spread, credit spread, TED spread and dividend yield) made a positive contribution to the new overweighting. These variables provide information about economic and inflation expectations and the prevailing market sentiment. The term spread, which reflects market participants’ long-term economic expectations, is particularly striking here: It has trended downwards since mid-June (1.51%) and now stands at 0.25%.
In our model, the term spread is calculated as the difference between the long-term and short-term interest rates of the major industrialized countries, which are weighted based on gross domestic product. It thus comes as no surprise that the US is the most significant driver of this development. Global yield curves have flattened significantly since mid-June, resulting in a narrower term spread. Paired with continued interest rate hikes, this generates lower risk premia for bonds.
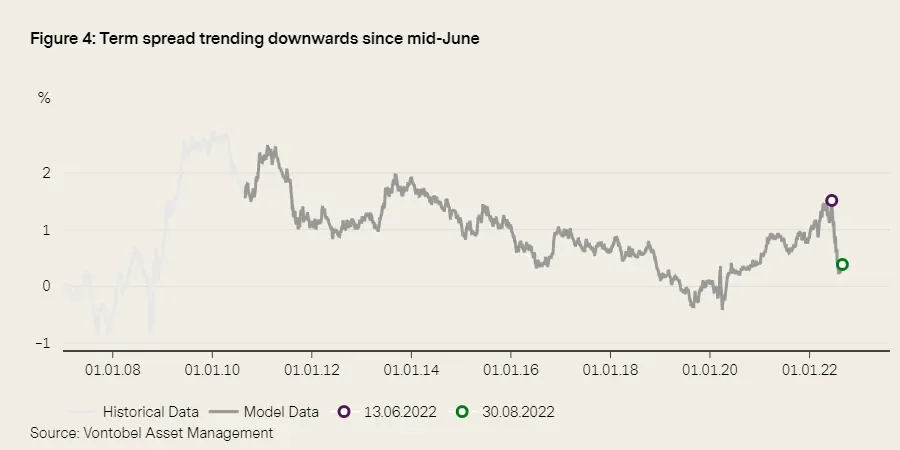
Figure 4: Period: January 2007 to August 2022.
The economic risks reflected by the flattening of the yield curve have increased credit risk premiums (companies’ credit risks) in the last few months. Despite this, we saw the credit spread narrow moderately in August. This was prompted by corporate earnings in the current reporting period, which were better than expected and so boosted market participants’ confidence. This moderate easing had a positive impact on the now significant equity overweighting in our model.
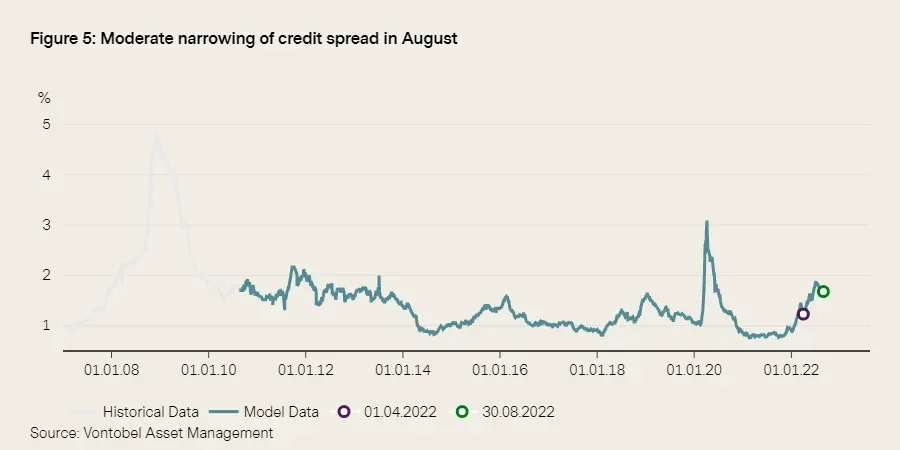
Figure 5: Period: January 2007 to August 2022.
Our bond allocation management model has increased bond allocation significantly since July to 46% at present. Two major trends explain why all three model components (carry, mean reversion and momentum) are signaling a higher weighting through their positive contributions. The first is that supply chain bottlenecks have eased, stabilizing inflation expectations on the main markets and thus meaning that lower interest rate hikes are expected for 2023/24. Secondly, recession risks have increased over the last few months. Both of these have gradually reduced bond market volatility slightly since mid-June, measured by the MOVE Index.
The combination of interest rate hikes – high interest rates for bonds with short maturities – and increasing fears of recession have resulted in far flatter yield curves since the fall of last year, although some countries such as the US have actually seen an inverse yield curve for some maturities in recent months (e.g., 2 to 10 years). An inverted U.S. yield curve has been a reliable predictor of a recession in the next 12-24 months over the past several decades. In our model, this development reduces the duration.
The Fed’s communication prior to and during the annual central bank meeting in Jackson Hole, which pointed to restrictive monetary policy, was interpreted by the model as a slight 6 percentage point reduction in bond allocation compared to the previous month. Nevertheless, the model confirms that lower inflationary pressure combined with ongoing economic risks limits the interest rate fantasy at the short end, showing a high probability that the markets will largely price in a 75-basis point increase in US interest rates in September.
Recession risks seem particularly high in the eurozone, as the region could face energy rationing and production shortages as a result next winter. Accordingly, the mean reversion component of our model in particular signals larger recovery potential for German bonds. However, about half of the bond overweighting is due to Japan. Despite high inflation at a global level, the Bank of Japan (BoJ) is continuing to credibly control the yield curve and so current yields on Japanese bonds (carry), adjusted for risk, still appear attractive.
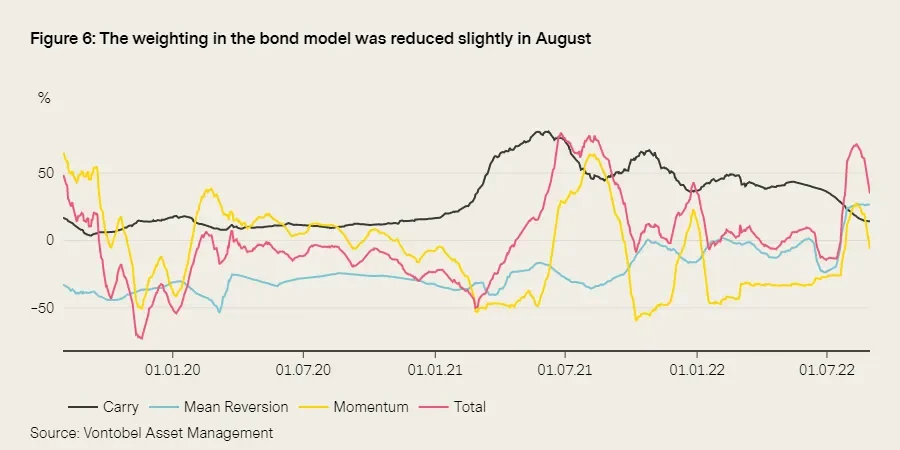
Figure 6: Period: August 2019 to August 2022.
Why it is worth diversifying in “value” and “growth”
In the current market environment, rising interest rates are the issue of the day. This is reflected in many aspects of the financial market. There is an interesting observation to be made in view of increasing capital flows into sustainable investments. According to Morningstar, these received about EUR 78 billion in the first quarter of 2022 in Europe alone. Most of these sustainable investments, which now make up 17% of fund assets in Europe, focus on young growth companies, which promise a relatively high “sustainable impact” on the basis of their innovative and sustainable products and services.
As a result, the current selection of sustainable strategies clearly tends towards “growth”. This benefited their performance in low-interest years, because the future profits of these growth companies had a higher present value. Some typical “value” sectors such as energy and utilities, on the other hand, are underrepresented or even excluded from the sustainable universe entirely.
Given this, a look at the fund universe in Switzerland and the fund universe labeled as sustainable in the Refinitiv database reveals an unsurprising picture: Classifying the funds by their investment style shows that “value” strategies are clearly underrepresented, accounting for just 22.8%, while just 21% of the funds invest in sustainable companies with a high asset value (“value”).
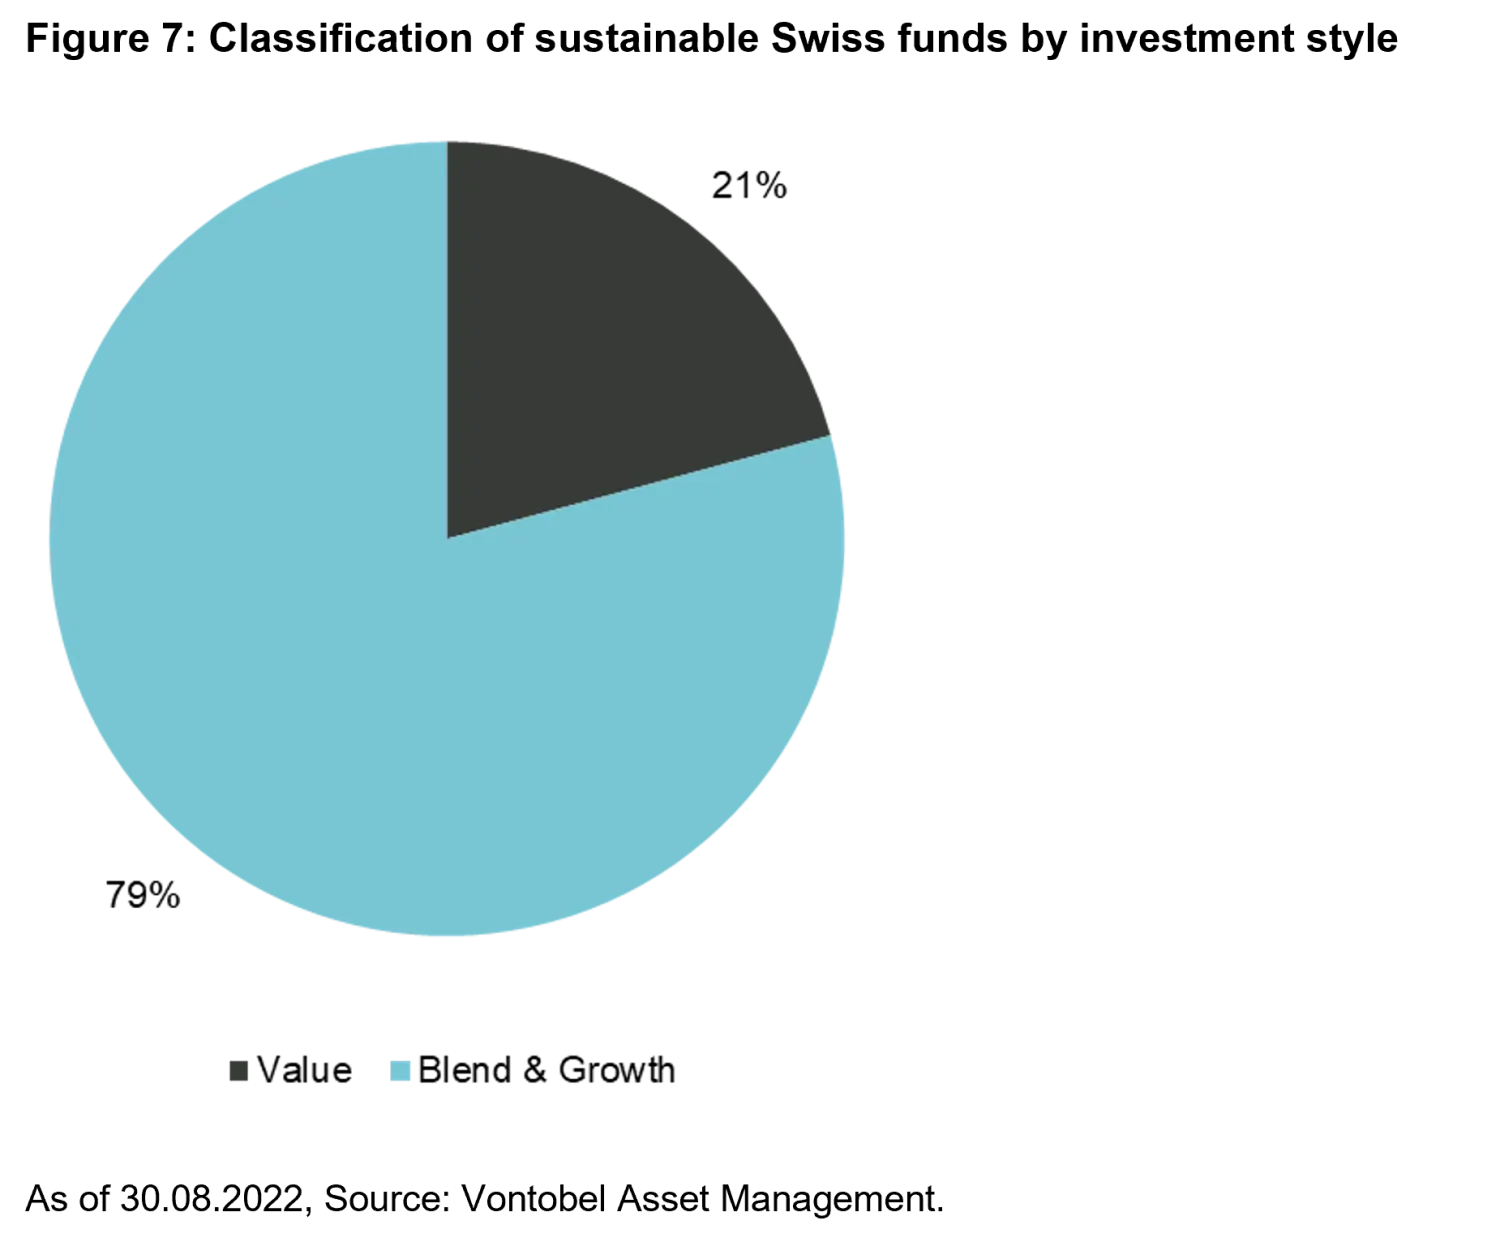
This supply gap makes it difficult to diversify sustainable portfolios across different investment styles. Interest rate hikes will likely have a negative impact on the performance of sustainable funds generally, as the future profits of growth companies will be discounted at a higher rate while the costs of debt financing rise. This is a welcome reminder of how important it is to properly diversify sustainable investments.
Diversifying by investment styles makes sustainable portfolios less vulnerable to style rotation. However, this requires a larger selection of sustainable “value” funds, which are still limited at present. Nonetheless, the fact that most sustainable funds are aimed at growth companies does not mean that there are no sustainable “value” investment options. We have identified numerous “value” companies that we believe are taking the right approach to sustainability and that should be considered for a truly diversified portfolio. Please contact us if you would like to look into diversifying your portfolio.
1. A bear market rally, also known as a “dead cat bounce” or “sucker rally” is a sharp, short-term rebound in share prices amid a longer-term bear market. According to one unofficial guideline, this is when prices recover by 5% or more before returning to new lows.
2. For a detailed analysis of the SDRM (State-Dependent Risk Measurement) model results, see,
“Is this time different from 2007?”.
3. A bear market is generally when the prices of securities fall by 20% or more compared to their most recent peak due to widespread pessimism and negative investor sentiment.
4. Our analysis refers to the S&P 500 in USD.
Past performance is not a reliable indicator of current or future performance.
Diversification and/or asset allocation neither assures a profit nor eliminates the risk of investment losses. Indices are unmanaged; no fees or expenses are reflected; and one cannot invest directly in an index Any projections, forecasts or estimates contained herein are based on a variety of estimates and assumptions. There can be no assurance that estimates or assumptions regarding future financial performance of countries, markets and/or investments will prove accurate, and actual results may differ materially. The inclusion of projections or forecasts should not be regarded as an indication that Vontobel considers the projections or forecasts to be reliable predictors of future events, and they should not be relied upon as such.
Vontobel reserves the right to make changes and corrections to the information and opinions expressed herein at any time, without notice. This document is for information purposes only and does not constitute an offer, solicitation or recommendation to buy or sell any investment instruments, to effect any transactions or to conclude any legal act of any kind whatsoever.


