Quantitative Investments
Your partner for leading quantitative investment solutions.
At first, I chose to ignore the latest version of ChatGPT when it was released in November 2022. But when the Economist claimed that “ChatGPT could replace telemarketers, teachers and traders”1, it finally did catch my attention. My initial dismissal was mainly due to my disbelief that a machine would be able to produce a high-quality investment research report that is of actual use to real investors. Even though I am not worried that the machine could take my job anytime soon, I must admit, I felt a kind of schadenfreude when ChatGPT barely scratched the surface when faced with questions like “what is the outlook for equities or bonds until the end of the year?” Instead of generating real answers, the machine spit out abstract platitudes before concluding with a blanket disclaimer of advising you to consult a financial professional in case you want to invest. Even after adjusting the question with some economic and financial assumptions, answers remained imprecise – and, frankly, utterly useless.
When asked about the 2023 economic outlook for China, ChatGPT turned out to be a bit more helpful. But even though the delivered content was more usable, it was outdated as the machine does not (for now at least) have access to current data. Plus, ChatGPT remains a blackbox since it is impossible to trace the answers given back to the sources and assumptions upon which they are built.
So, for now, I would rather stick to our tried and tested quant models if I want to get an outlook for a country or an asset class. They might not be able to tell their own story in fancy language but they offer full look-through and I can be sure that results are based on the latest data available.
Currently, our business cycle model Wave points to a sustainable economic recovery not only in China but also in the wider APAC region, which contrasts with the unabatedly high recession risk in some developed markets such as the US.
Nevertheless, our equity allocation model sticks to an equity overweight. Mainly because model components such as the term spread suggest an approaching policy pivot by the Fed, which allows investors to look beyond recession risks - provided the economic pain later this year is temporary and limited. Like our equity allocation model, our bond allocation model buys into the assumption of a potential dovish pivot as well, arguing for a small bond overweight with momentum currently being the driving force of the model.
1. Published on 14th April 2023 as an online article.
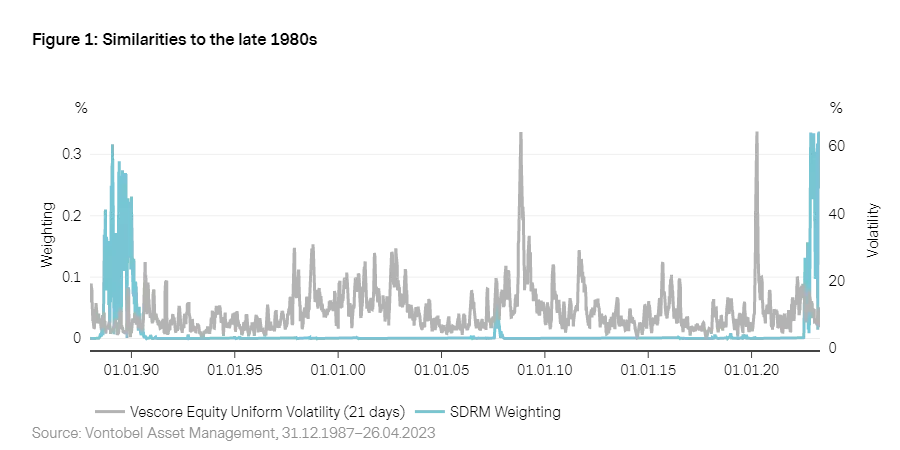
Financial market volatility has been retreating since the peak of banking sector stress in mid-March this year. While equity market volatility has reached its lowest point since late 2021, bond volatility is falling too but remains elevated by historical comparison. On the one hand, cracks in the banking sector make a Fed policy pivot much likelier. The recent drop of US headline inflation to 5% played a role as well. Despite good arguments for falling bond volatility, sticky core inflation argues against a return to early 2021 levels in the near term. Much will depend on whether a recession in the US will materialize and how deep it will be. A soft landing is generally good news but could lead to less easing than currently priced in keeping bond volatility elevated.
Uncertainty lingers on also in our models that for now remain reluctant to dismiss the possibility of above-average market volatility because a US recession in the upcoming quarters remains the base case2. Our risk model SDRM stubbornly compares the current environment to the late 1980s which is a phase marked by an extremely aggressive policy tightening cycle. Over the course of the late 1970s and 80s the Fed increased interest rates by almost 20%-points, leading to the default of approximately 30% of the US loan and saving associations followed by a recession in 1990. As we highlighted last month3, renewed stress in the banking sector later this year cannot be ruled out, depending on the policy path the Fed is going to take. But banking sector vulnerabilities have decreased since the Great Financial Crisis, making a full-fledged banking sector crisis less likely.
2. We tried to come up with a figure based on statistical evidence of 10 developed countries since the 1950s in our report “
What do our models think about US recession risks?
”.
3. See “
Vulnerabilities in the banking sector are below historical averages
” in the April 2023 edition of the Global Market Outlook.
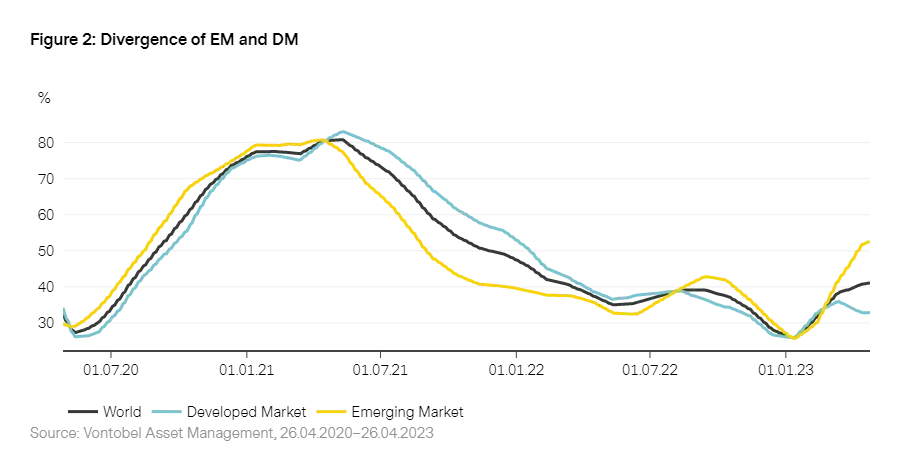
The banking sector turmoil in the US and a few other developed markets in March is leaving skid marks in the developed market Wave in form of a renewed fallback to contraction. The deterioration is not a big surprise to us as the forward-looking element of the Wave, our transition model, predicted this fallback quite precisely. The main reason for our model’s skepticism is the ongoing tightening of liquidity, measured by real M1 growth, which dropped by 10% year-over-year - the lowest growth rate since the 1980s. Contrary to developed markets, emerging markets entered the expansion phase due to the APAC region’s stronger growth momentum and a looser policy stance. Despite the significant divergence between the DM and EM Waves, the global Wave remains in recovery. However, the risk of a global fall back into contraction remains high (47%).
Within developed markets, three observations seem important to us. First, labor markets seem to finally be cooling off with a significant drop of the Wave’s labor market component from 52% to 26% . In the US, for example, hiring plans, temporary employment and initial unemployment claims indicate that non-farm payrolls, the most important US labor market indicator, could deteriorate fast over the upcoming months. Second, the recent banking sector turmoil is leaving grinding marks in the Wave component “banking”, which dropped in developed markets to 4%. The US seems most affected, as the US Wave fell back into contraction. This brings us to the third important observation this month: the divergence of US and European growth momentum. Europe represents most countries with a significant growth momentum improvement (Germany, UK, France, Spain, Belgium, and Ireland). Especially consumer and service sector sentiment keep recovering.
The emerging market Wave entered expansion in April, thanks to strong growth momentum in the Asian APAC countries, with China (+16%-points) and Taiwan (+6%-points) posting the biggest Wave increases. Lose monetary policy conditions in combination with the lifting of lockdown measures are finally leading to a broad-based improvement in growth momentum. Even the battered Chinese housing market shows clear signs of improvement, where all segments of the real estate market (investment, construction, and sales) seem to have bottomed. Real GDP growth for the first quarter of 2023 surprised to the upside with 4.5% year-over-year growth.
4. For further insight into the Wave business cycle model we refer to our white paper “
The Vescore Wave – a superior business-cycle model
”
5. The Wave is measured in percentages. The percentage refers to the share of indicators currently gaining momentum. Therefore, a drop to 26% means that less indicators (now only 26%) are currently improving (gaining momentum).
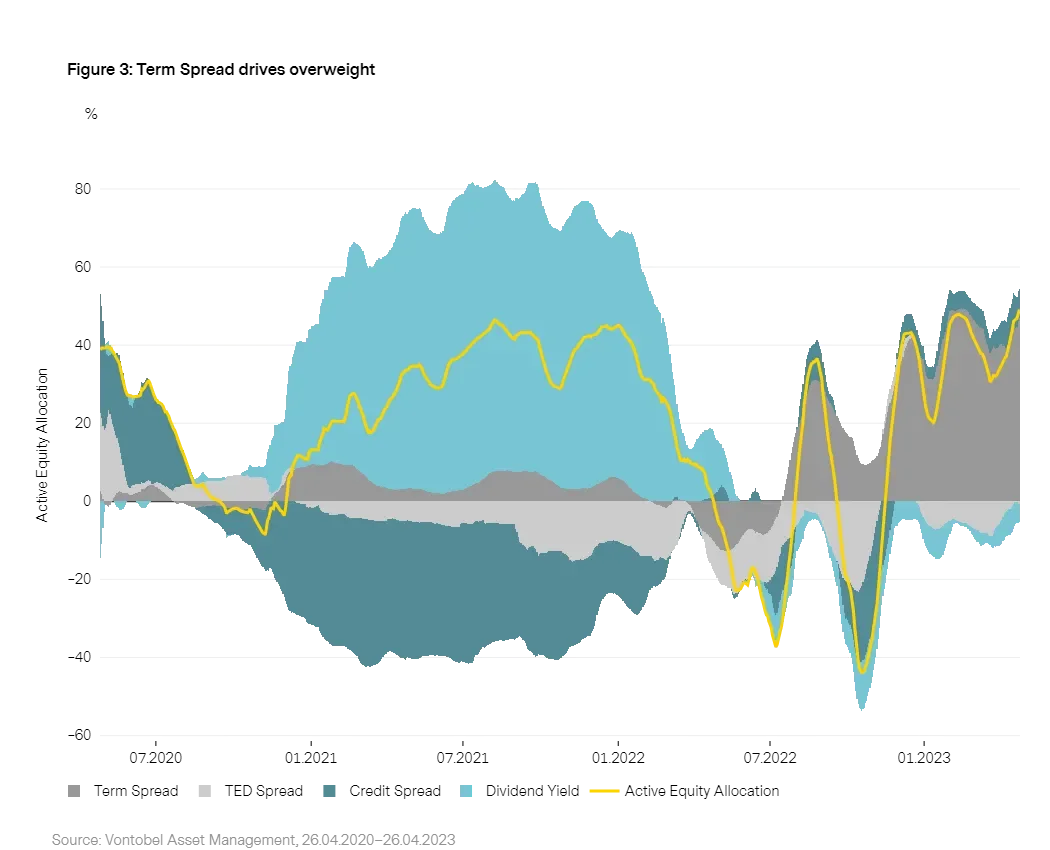
Market volatility increased in March due to the banking sector turmoil. However, the decline in banking sector vulnerabilities6 since the Great Financial Crisis, the US government’s implicit deposit guarantee and the Fed’s provision of liquidity for banks in exchange of high-quality securities (at face value) changed investors’ minds quickly, bringing equity volatility back down.
Our equity allocation model used the chance to increase the active equity allocation by 4%-points April. The main contributor (term spread) to the active overweight gained even further in significance, as the cracks in the banking system make a Fed pivot more likely over the upcoming months. The previously slightly negative contribution of the TED spread, a gauge of liquidity in the banking sector, reverted back to almost zero, which is another indication of investor perception of declining banking sector stress.
6. See the April 2023 version of the Vescore Global Market Outlook.
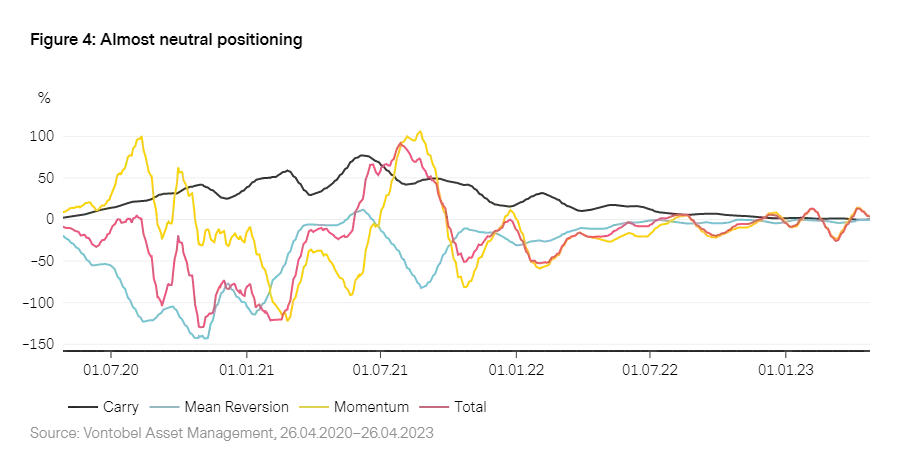
Our bond allocation model started to increase the allocation in the week of banking sector stress in the US mid-March. This is because cracks in the banking sector make policy easing much more likely as credit crunch and recession risks increase7. Ultimately, falling rates are positive for bonds.
The rising probability for policy easing was captured via the momentum component embedded in our bond allocation model. The contribution of other model components such as term spread, and mean reversion remain neutral with no sizeable contribution to the allocation.
7. In “ What do our models think about US recession risks ?” we concluded since late last year that US recession risks are well above 50% for 2023.
Despite almost reaching record high levels in mid-April 2023 compared to three years ago, gold prices should have further legs in the coming months. Lower yields, a weaker US dollar and financial sector uncertainties, created the perfect combination for gold to climb since early March. There might be some more short-term price corrections however, as the market has probably prematurely embraced a Fed pivot leading to gold prices overshooting to the upside. In addition, The US service sector is still strong, Fed members keep making hawkish comments and banking sector spill-over effects did not materialize. Therefore, gold had to give up some of its recent gains which can be interesting entry points for investors since gold is supported by several factors going forward:
With lower inflation expectations and lower energy prices, the Fed may choose to pause their rate hiking cycle in the summer. If the Fed sees a deterioration in economic activity, they might even cut rates in the second half of the year. Lower interest rates translate into lower opportunity costs for holding gold which makes them the most important driver for gold prices in the long run.
Until Fed rate cuts materialize, the market may price in a higher likelihood for a recession in the US which should support demand for safe-haven assets, such as gold.
A weaker US dollar supports all US dollar denominated commodities since it is simply less expensive to buy them. This applies particularly to gold. The European Central Bank is in a different situation than the Fed due to sticker inflation numbers, and unions fighting for higher wages. They might have to raise rates while the Fed is already pausing or even cutting, which is likely to weaken the USD against the EUR further.
Another bullish aspect for gold is the intensifying discussion around the debt ceiling in the US. The approaching deadline and the lack of progress so far might introduce some credit risk in the US treasury market which should benefit gold as an alternative safe-haven asset.
At the same time, physical demand for gold is still strong. Central banks bought record amounts of gold last year and we see still strong buying numbers at the start of this year. Additionally, the reopening in China is raising jewellery demand. The only demand factor which is still rather muted are gold ETF holdings (which remain at 3-year lows). Recently, we saw some small inflows. If they pick up in speed, gold prices could increase.
Important Information: Past performance is not a reliable indicator of current or future performance. Indices are unmanaged; no fees or expenses are reflected; and one cannot invest directly in an index Any projections or forward-looking statements herein are based on a variety of estimates and assumptions. There can be no assurance that estimates or assumptions regarding future financial performance of countries, markets and/or investments will prove accurate, and actual results may differ materially. The inclusion of projections or forecasts should not be regarded as an indication that Vontobel considers the projections or forecasts to be reliable predictors of future events, and they should not be relied upon as such. Diversification and/or asset allocation neither assures a profit nor eliminates the risk of investment losses. Vontobel reserves the right to make changes and corrections to the information and opinions expressed herein at any time, without notice. This document is for information purposes only and does not constitute an offer, solicitation or recommendation to buy or sell any investment instruments, to effect any transactions or to conclude any legal act of any kind whatsoever.