


Quantitative Investments
Your partner for leading quantitative investment solutions.
The market's faith in the possibility of a soft landing seems unbroken. So far, incoming data has been supportive of this view as inflation has been on retreat and retail sales and manufacturing production have been easing rather than crashing.
However, a soft landing combined with an imminent dovish Fed pivot should not be taken for granted purely based on recent economic data releases. In fact, the opposite scenario of a recession cannot be ruled out as the strong US labor market report in January and the first US inflation surprise to the upside in in the past four months may extend the US tightening cycle well into summer increasing the policy-driven recession risks. The fact that inflation has already proven to be somewhat more sticky than anticipated does not come as a surprise to us and has been well anticipated by our fixed income allocation model, which hesitated to take strong positions ahead of recent data releases.
Equity markets have digested recent data releases better than the bond market. This has to do with the lagged effects of monetary policy on the economy, which usually unfolds its full impact on the economy only one to two years after the start of the tightening cycle.2 Therefore, we still seem to be within a certain grace period during which the uncertainty of the economic impact makes it impossible to refute the arguments of either camp: bulls and bears.
Our equity allocation model remains convinced that we are more likely to stay in this grace period for the time being and that recession risks are not imminent. In this regard the 54-year unemployment low in the US in January 2023 is good news, as equity market selloffs often take place only a few months before a recession starts. Recessions tend break out three to four quarters after the unemployment trough3. Therefore, the equity overweight suggested by our equity allocation model is no contradiction to our models’ view of looming recession risks in countries such as the US4. It simply seems too early to worry about it.
Equity market volatility measures – such as the VIX – have come down significantly since October 2022. The VIX showed a decline from 32% to 20%. In contrast, bond market volatility (measured by the MOVE Index) remains elevated and has only moderately declined from its 2022 peak. Bond market volatility is also the main reason why our risk model SDRM5 detects strong similarities between today’s environment and the one that was prevalent in the 1980s. Back then, the Fed committed a major policy blunder which sent the economy and markets on a nefarious inflation rollercoaster – at least this is the consensus view that has emerged with the benefit of hindsight over the past decades. According to that view, the Fed is accused of failing to do its job of finishing off inflation properly in the early 1980s, which paved the way for inflation to creep back into the economy through the backdoor towards the end of the decade. Doesn’t this sound familiar to the current discussion of the risks of a premature Fed policy pivot?
Back then, aggressive policy tightening between 1977 and 1981 (+14%-points) led to a quick retreat in inflation, which allowed the Fed to justify an almost complete unwinding of previous rate hikes. But inflation struck back forcing the Fed to start another, albeit more moderate, tightening cycle in the late 1980s (+4%-points), which triggered a recession6 in the second half of the 1990s. While inflicting a lot of pain, it finally wrestled inflation down to below 5% and made sure it couldn’t get back up.
Currently, strong labor markets are used as an argument for a soft landing and against a 1990-recession scenario. True, the soft-landing probability has increased, but the 20-year unemployment low in March 1989 did not prevent a US recession in 1990 either. Caution is warranted.

5. For an introduction to the model, please see
Risk management: Forward on calm seas, adaptive and agile in stormy phases.
6. See Walsh, C.E. (1993). What caused the 1990-1991 Recession? Federal Reserve Bank of San Francisco. Economic Review 2, p. 33-48.
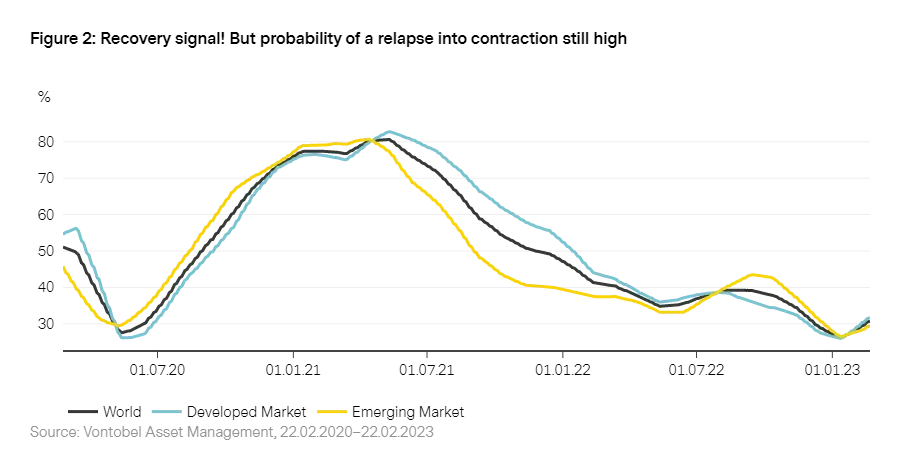
The economic outlook has brightened in recent weeks at least for the near-term outlook. For the first time since the summer 2022, our business cycle model Wave is signaling a recovery on a global level. However, a few important factors keep the probability of a contraction high (55%). First, with -7.6% year-over-year growth, real money supply is drying up as fast as last time in the 1980s. Second, the recovery signal is not yet broad-based as 52% of the countries we cover remain in contraction. Third, we observe an increasing disconnect between soft and hard data7, with soft data improving from historical lows and hard economic data deteriorating.
Blockbuster US data releases in recent weeks have moved the US Wave back into recovery. Although service and consumer sentiment indicators also exhibited solid gains, the labor market literally stole their thunder. The unemployment rate dropped to a 50-year low and there are twice as many job vacancies than job seekers currently out there. This does not mean though, that the US is out of the woods already since the fallback probability to a contraction remains elevated.
Elsewhere, labor markets are tightening as well, with most G7 countries experiencing historically low unemployment. Contrary to improving soft and labor market data, hard economic data continues to decelerate in developed markets. Good news about an averted energy crisis have been on the front covers of newspapers, but negative year-on-year growth of production and retail data point to continuously high recession risks in the eurozone. Therefore, the developed market recovery signal is overshadowed by a 64% fallback risk to contraction.
Also Asia is in recovery - a signal should not be underestimated in its importance. Since 2020, Asia has been leading the global business cycle. And the chances of the region to remain on the trajectory of an economic upturn (recovery and expansion) are currently higher than for developed markets, which is reflected in an 83% recovery probability. Why so? In the absence of hard economic data releases for January, Chinese mobility data – which jumped back to above pre-COVID levels – and a fading infection wave point to an economic recovery in 2023. No surprise that sentiment data soared in China, posting the largest monthly increase in history (excluding March 2020) for both service and manufacturing sentiment. And the government’s willingness to support the economy and particularly the real estate sector is reflected in accelerating real liquidity growth.
7. Soft data includes survey-based economic sentiment data. Hard data includes real economic data releases such as retail sales or production data.
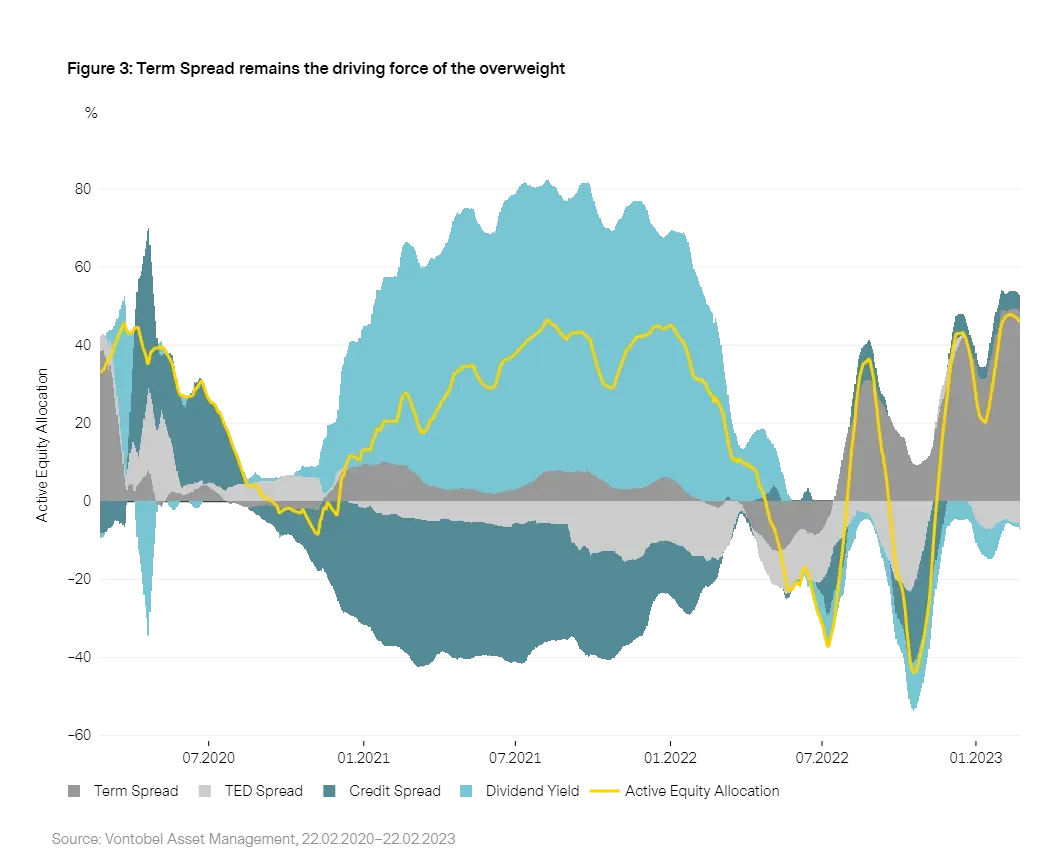
Market volatility increased slightly in the aftermath of the strong US labor market report and the inflation reading. But this has not been enough to undermine market participants’ confidence in a much-anticipated end of policy tightening. Therefore, the model variable contributions of our equity allocation model remain rather unchanged with the term and credit spreads having a positive contribution to the equity allocation.
The positive contribution of the term spread indicates that market participants are still confident that the Fed tightening cycle will peter out with just a few more of 25-basis-point steps. The positive contribution of the credit spread suggests that the strong US labor market report is seen as a piece of evidence against imminent risks of a deeper recession.
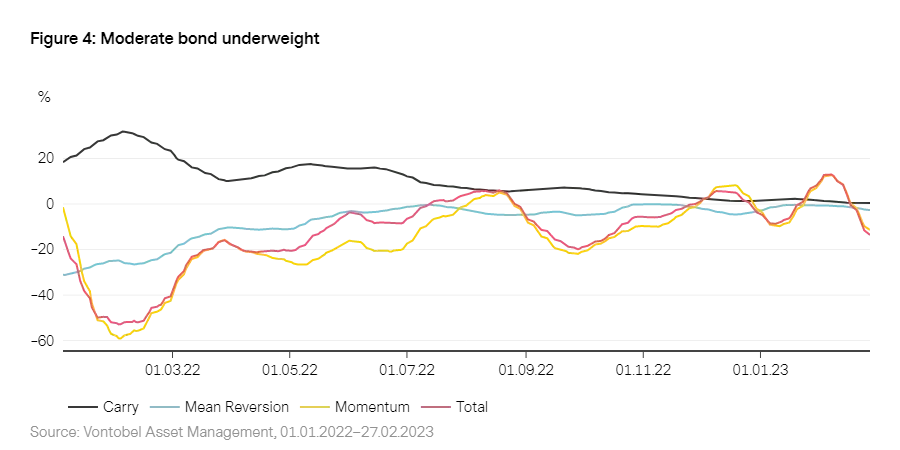
In contrast to our equity model, our bond model was less welcoming to the latest US data releases. While the strong labor market is positive news for growth and therefore for equities, it increases the risk of the “sticky” inflation scenario which is bad news for bonds. Just one week after the US labor market report, US inflation data's surprise to the upside was grist to the mills of advocates of the “sticky” inflation scenario leading to a re-pricing of rate expectations.
Consequently, the tailwind for bond markets of recent months in the form of easing inflation pressure and labor market conditions is partly fading fueling a rise in the MOVE index over the last two weeks. True, wage growth keeps decelerating in the US but the unemployment rate has never been lower since the 1960s. This translates into a moderate bond underweight of our bond allocation model, with mean reversion and momentum tipping the scale.
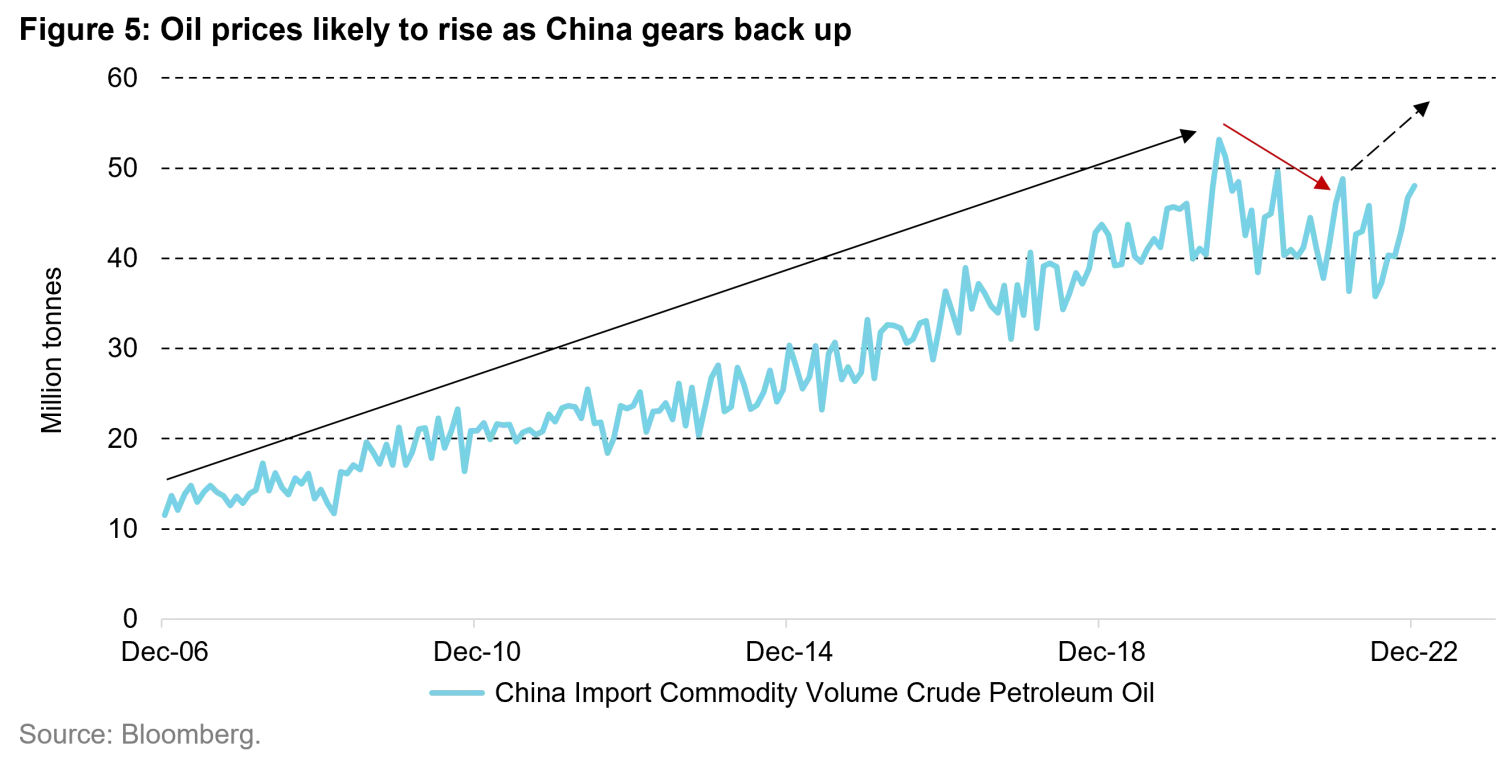
China's re-opening after an unrelenting three-year zero-COVID policy was a big game changer for base metals. However, oil prices seem largely unimpressed and haven’t really budged, although you would expect oil markets to jump on the release of massive mobility demand by 1.4 bn people being on the move again. There are several reasons for the muted reaction which delays the oil market response but won’t prevent it from accelerating later this year.
China's COVID-lockdowns were a huge drag on commodities demand in general as China is responsible for 50% of global metals consumption. Plus, it is the biggest oil importer globally. So not surprisingly, the sudden abandonment of all COVID-restrictions in November was a bullish driver for base metals as they pre-priced higher demand anticipating the government's renewed focus on economic growth.
However, oil markets did not respond at all to China's re-opening. For example, Brent has been trading in a narrow range between 75 and 85 US dollars per barrel since November and doesn’t seem to be able to break the upper cap. This is counterintuitive since Chinese domestic and international flight activity, which is an essential part of the country’s energy demand, shows a speedy recovery already. Missing jet fuel demand from China alone reduced oil consumption by around 1.5 million barrels per day for most parts of 2022. This does not sound significant with respect to the global consumption of 100 million barrels of oil each day, but a few hundred thousand barrels of over- or undersupply do usually move the needle for oil balances and therefore impact prices. Having oil demand of this magnitude evaporate from the global market was a big deal and explains why the oil market is in an oversupplied situation at the moment since supply did not decrease to the same extent. In addition, due to the Chinese New Year, only little data is produced for January. But high-frequency data reflect traffic congestion and subway passenger numbers already above 2019 levels and January domestic flight numbers increased by over 80% from a month ago. Once we see that the pick-up in mobility is being translated into official oil demand data, prices should benefit. Also, the improved growth outlook for Europe and the US, as most economists shift away from predicting a recessionary environment, is positive for oil demand for the rest of the year.
On the supply side, the surprisingly unconstrained flow of Russian barrels last year kept a lid on oil prices. China, India, and Turkey stepped in as alternative buyers and happily stocked up on discounted Russian oil. Also, frontloading by western buyers ahead of the implementation of the import sanctions filled global oil inventories sufficiently. However, we should not count on these flows to continue forever. First, Russia started to retaliate and recently announced 500 000 barrels per day of production shut-ins. And second, the implementation of the import stop of oil products (jet fuel, diesel, gasoline) by the G7 countries in February, may soon lead to frictions in the world freight market. Furthermore, OPEC seems to defend 75 US dollar per barrel and thus keeps a floor on oil prices. Additionally, US shale oil companies still exhibit high budget discipline which translates into lower expected oil growth for this year.
Despite a currently oversupplied oil market, there are several bullish drivers in the market for the months to come. Investors just need to be patient until fundamental market tightness trickles through to the data.
1. See “
Bruch mit der Vergangenheit: Das neue Gesicht der Märkte ab 2023
”
2. This conclusion can be dated back Milton Friedman (1961) “The lag in effect of monetary policy”, Journal of Political Economy, vol. 69, no. 5, pp. 447-466
3. Both conclusions are the result of our study of 10 developed countries since the 1950’s..
4. See Vescore (2023), “
What do our models think about US recession risks?
”
Important Information: Past performance is not a reliable indicator of current or future performance. Indices are unmanaged; no fees or expenses are reflected; and one cannot invest directly in an index Any projections or forward-looking statements herein are based on a variety of estimates and assumptions. There can be no assurance that estimates or assumptions regarding future financial performance of countries, markets and/or investments will prove accurate, and actual results may differ materially. The inclusion of projections or forecasts should not be regarded as an indication that Vontobel considers the projections or forecasts to be reliable predictors of future events, and they should not be relied upon as such. Diversification and/or asset allocation neither assures a profit nor eliminates the risk of investment losses. Vontobel reserves the right to make changes and corrections to the information and opinions expressed herein at any time, without notice. This document is for information purposes only and does not constitute an offer, solicitation or recommendation to buy or sell any investment instruments, to effect any transactions or to conclude any legal act of any kind whatsoever.
