Key takeaways
- Rising Treasury yields reflect a combination of resilient nominal growth, elevated fiscal deficits, and higher term premiums.
- The recent inflation uptick is primarily an energy-driven supply shock. Core inflation, wage growth, and services inflation remain on moderating trends, in our view, suggesting limited second-round effects.
- Strong headline economic growth is increasingly driven by AI-related investment, while labor market momentum has softened, helping contain underlying inflation pressures.
- With the 10-year Treasury yield now at the higher end of our estimated fair value range, we maintain our neutral stance on the longer part of the curve.
Rates are on the rise again, with yields in some markets reaching multi-decade highs as the energy-driven supply shock continues to keep inflation elevated. When we entered the third quarter, we still expected a de-escalation in the Middle East that would have rendered the recent spike in energy prices temporary. Now, six months into the conflict, however, we may need to adjust to a new status quo characterized by ongoing hostilities and hence elevated oil prices.
As rates have repriced, we are asking ourselves: are current levels commensurate with the economic backdrop or have they overshot fundamentals? To answer this key question, we assess the political landscape as well as fundamental drivers to form a view on the potential direction of markets from here.
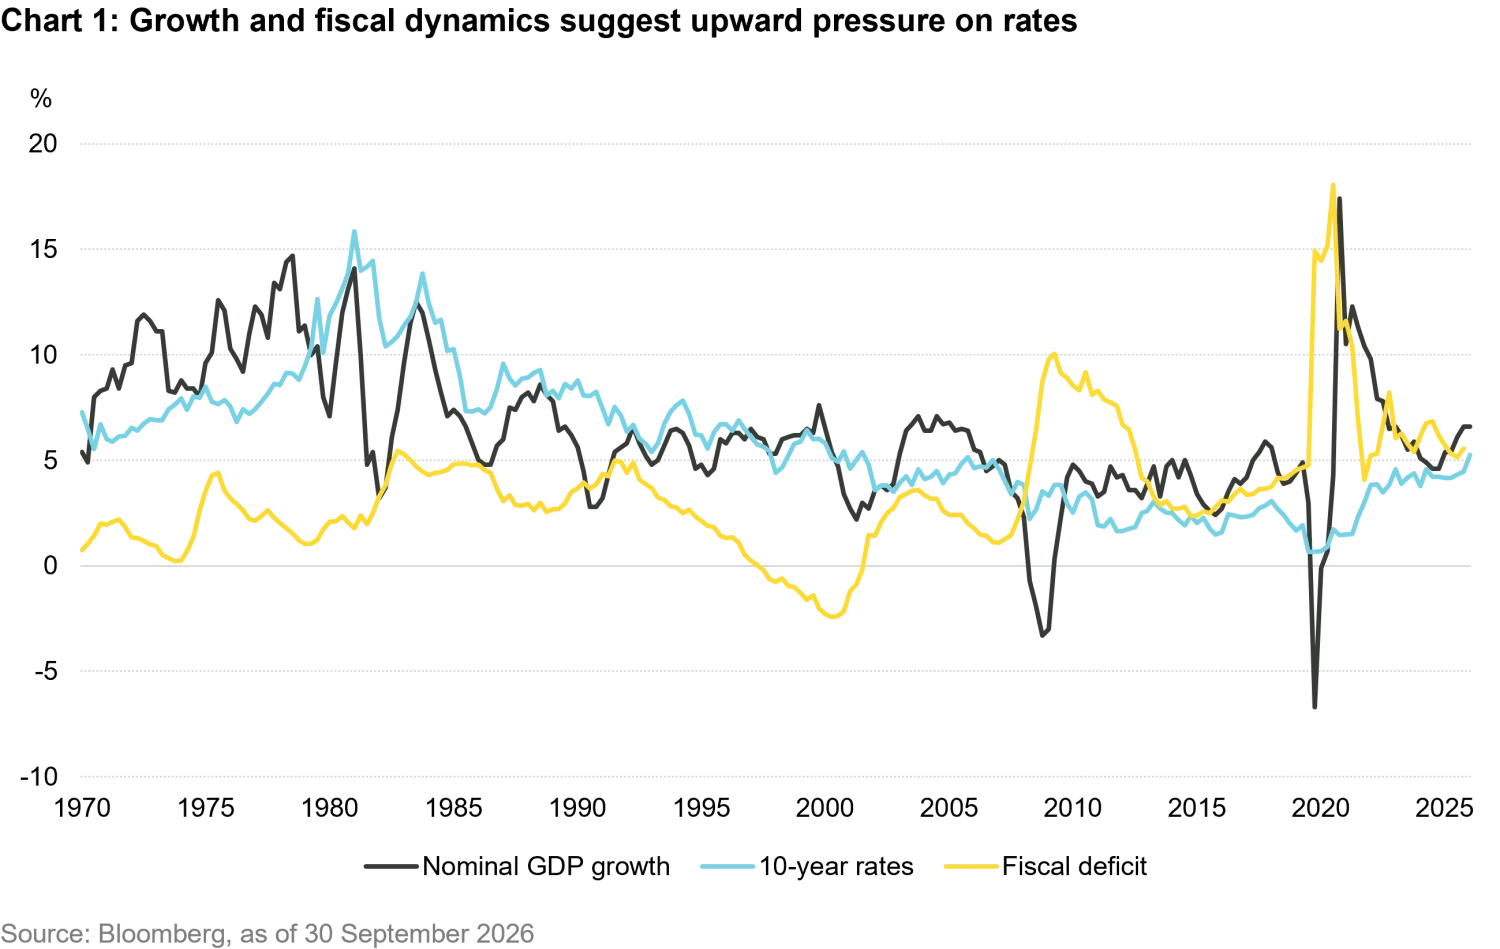
A starting point for assessing rate levels is to compare them with nominal GDP growth, using the rationale that investors want compensation for the opportunity cost of holding government bonds relative to investing in the real economy. US nominal GDP growth currently stands at 6.6% year-over-year, up from 4.6% a year ago, and at its fastest pace since Q3 2023, about 160 basis points (bps) above the 10-year US Treasury yield.
From a historical perspective, the average gap between nominal GDP growth and the 10-year Treasury yield has been roughly zero since 1970, which means current rate levels appear too low. That said, in our view, the average is not likely meaningful because it masks significant variation across different regimes. During the disinflationary period of the 1980s and 1990s, the 10-year yield averaged almost 190 bps above nominal growth. However, since the beginning of the century, yields have averaged about 90 bps below nominal growth, excluding the pandemic period. So, a 10-year Treasury yield at about 5.7% could still be consistent with the average relationship observed over the past 25 years, even without factoring in the fiscal side of things.
The fiscal backdrop brings us to the second factor that is driving rates higher. The current US deficit is expected to reach USD 1.9 trillion this year, according to the Congressional Budget Office's (CBO) projections, while total federal debt passed USD 40 trillion in August. Net interest outlays reached USD 857 billion over the first nine months of the fiscal year, up 13% over the same period a year earlier, according to the CBO. For bond investors, the question is: how much term premium does that actually justify?
Empirical research indicates that each percentage point increase in projected debt-to-GDP is associated with a 2 to 4 bps rise in long-dated Treasury yields. Under CBO projections, debt held by the public is expected to rise from 101% of GDP in 2026 to 120% by 2036. Applying this relationship, the cumulative increase in debt could add roughly 40 to 75 bps to the term premium over the decade, equivalent to around 4 to 8 bps annually.
Since 2020, debt-to-GDP has increased by about 20 percentage points. Using the same methodology, we believe that increase could justify between 40 to 80 bps, somewhere between a third and a half of the 140 bps rise in term premium. We believe that pressure is likely to persist. With this framework in place, we turn to the outlook for rates and what we deem fair value for the 10-year Treasury yield.
An energy shock, not a broad inflation reacceleration
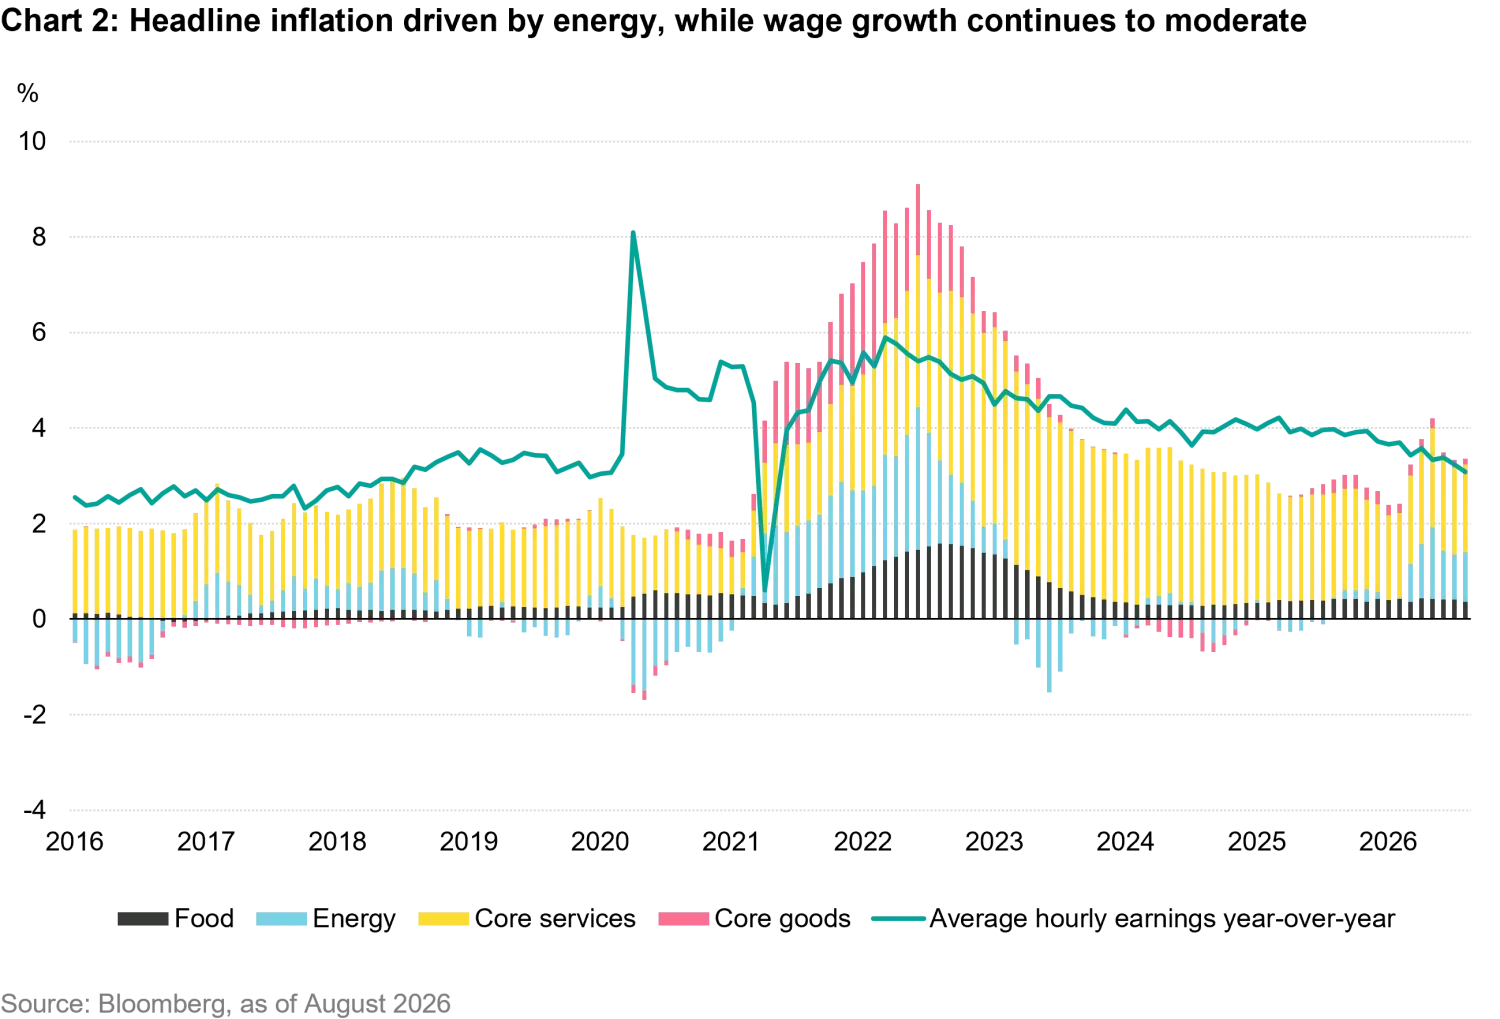
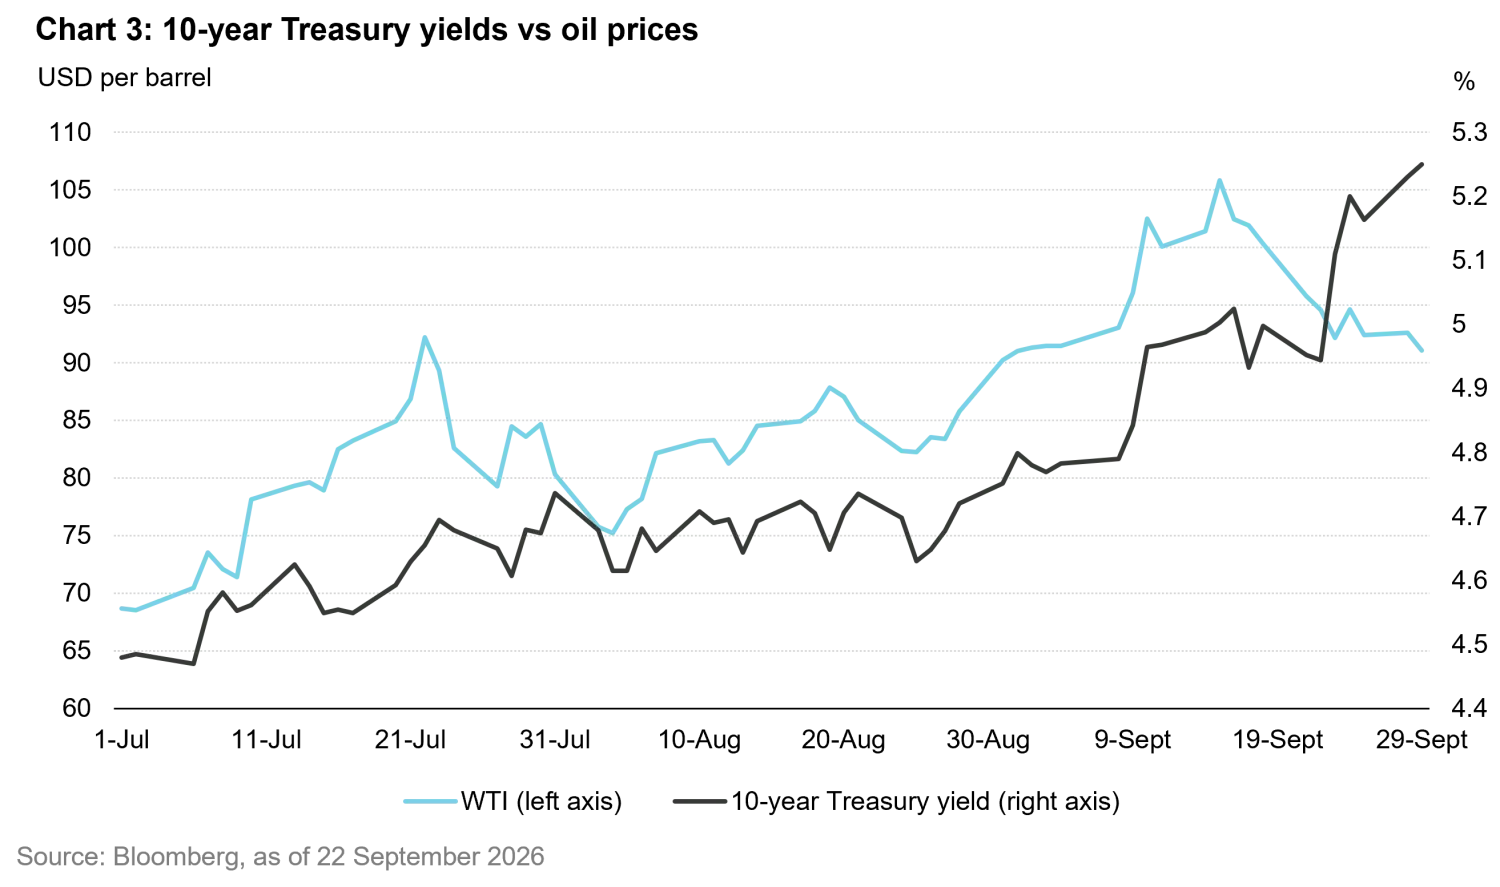
To start, we look at headline Consumer Price Index (CPI) inflation, which is currently running at 3.4%, down from 4.2% in May. Much of the recent inflation pressure has been driven by energy, which has contributed one percentage point to headline inflation over the past few months. With Brent crude trading above USD 100 per barrel again, we expect headline inflation to remain elevated and potentially even accelerate slightly from here.
However, core CPI stands at just 2.4%, its lowest level since March 2021. This gap between headline and core inflation lies at the heart of the debate about the type of inflation we are experiencing. An energy supply shock caused by a blocked shipping route can raise the price level, but whether it generates sustained inflation depends on the extent to which higher energy costs pass through to services prices and wages.
Wage growth has continued to decline, with average hourly earnings slowing to 3.1% from the high of 5.9% in Q1 2022. Core services inflation has likewise trended lower, despite a period in which goods prices first collapsed and have since rebounded. Core services inflation, now largely driven by shelter costs, is roughly in line with its pre-pandemic average and is not showing signs of upward pressure. Overall, we would argue that the recent rise in oil prices is increasing the price level but is not materially raising the underlying rate of inflation, and neither wage growth nor services inflation currently point to second-round effects.
Resilient growth masks a softer labor market
Growth is the other side of the coin and, likewise, we view the picture as bifurcated. Real GDP growth is expected to slow modestly to 1.7% in Q3 before reaccelerating to 2.1% in Q4 and largely remaining at that level for the next several quarters. Private investment, mainly driven by the AI capital expenditure cycle, is the primary driver and we expect that to remain strong. Consumer spending is expected to moderate but still remains healthy, with the latest retail sales numbers appearing encouraging after a slump in July.
The labor market, on the other hand, appears less encouraging. August nonfarm payrolls increased by 162,000, comfortably surpassing consensus expectations of 53,000, and the unemployment rate remained steady at 4.1%. However, the 12-month payroll average is around 50,000 jobs per month, well below trend. Overall, we would describe the economy as growing in nominal terms while creating very few jobs. In our opinion, this should help contain second round inflation effects, but we also see limited room for inflation to slow to the US Federal Reserve’s (Fed) 2% target in the near term.
Bringing these factors together and basing our analysis on current consensus forecasts, we expect nominal GDP growth to remain in the 5.5% - 6% range over the next few quarters. Applying a 90 bps discount to the 10-year Treasury yield and an additional fiscal premium of approximately 10 bps, slightly above the 4 to 8 bps range implied by our estimated coefficients to reflect the CBO’s front-loaded fiscal deterioration path, yields a fair value of roughly 4.7% - 5.2% for the10-year US Treasury yield.
While these estimates are approximate and based on long-term drivers, they provide a useful estimate of a fair value point based on fundamentals. The next piece of the puzzle is the political backdrop, which has become more complicated in recent months.
The tug-of-war over Treasury yields
The interaction between fiscal and monetary policy has changed, with the two US policy levers now exerting opposing influences with respect to long-term interest rates. In our view, the first phase of this shift began when Fed Chair Kevin Warsh’s comments at the June and July press conferences didn’t convincingly reaffirm the Fed's commitment to fighting inflation. Although he subsequently sought to correct this perception at the annual Jackson Hole symposium on August 28 and again at the press conference following the latest Fed meeting, the long end of the Treasury curve had already repriced.
Warsh has also removed forward guidance from the Fed's communications, arguing that markets should be reading data rather than Fed rhetoric. The result has been greater uncertainty surrounding the path of short-term rates, and investors demand compensation for uncertainty. The 10-year term premium, as estimated by the Kim-Wright model, now stands at 0.96%, 27 bps higher than in June and at its highest level since 2010. In effect, this is what investors demand for absorbing supply without the guidance that previously helped anchor expectations for policy rates.
Meanwhile, the US Treasury has been attempting to push the same premium back down. Since September 9, it has at least doubled the size of its liquidity to support buybacks in the 10-to-30-year sector, so the operation is a reallocation toward the long end of the curve. Treasury Secretary Scott Bessent has said that individual operations could exceed USD 4 billion and that current yields do not reflect fundamentals. The market initially rallied for a day in August and then sold off again.
More broadly, the signals coming from the US Treasury suggest that fiscal consolidation remains unlikely. Policymakers appear focused on containing long-term yields through Treasury interventions rather than on addressing the underlying fiscal imbalance.
Why the midterms are unlikely to change the rate outlook, in our view
A further consideration for the positioning outlined below is the upcoming midterm elections. We believe the elections are unlikely to be a major catalyst for rates. In general, we do not think there is a credible path to fiscal discipline on either side of the aisle, which is what we believe would matter most for the long end of the curve.
Generic ballot polling and prediction markets both point to gains for Democrats, with the House appearing more likely than the Senate to change hands. The Senate remains the larger source of electoral uncertainty. Beyond the election itself, we could envision the current administration challenging close results, potentially extending uncertainty through the certification process into January. While such an outcome could increase market volatility, we would view this as noise around yield levels rather than as a fundamental driver of them. Ultimately, we believe in the stability of the US institutions, and as long as growth remains resilient, we would view any election-related spread widening as an opportunity to add risk exposure.
From underweight to neutral on duration
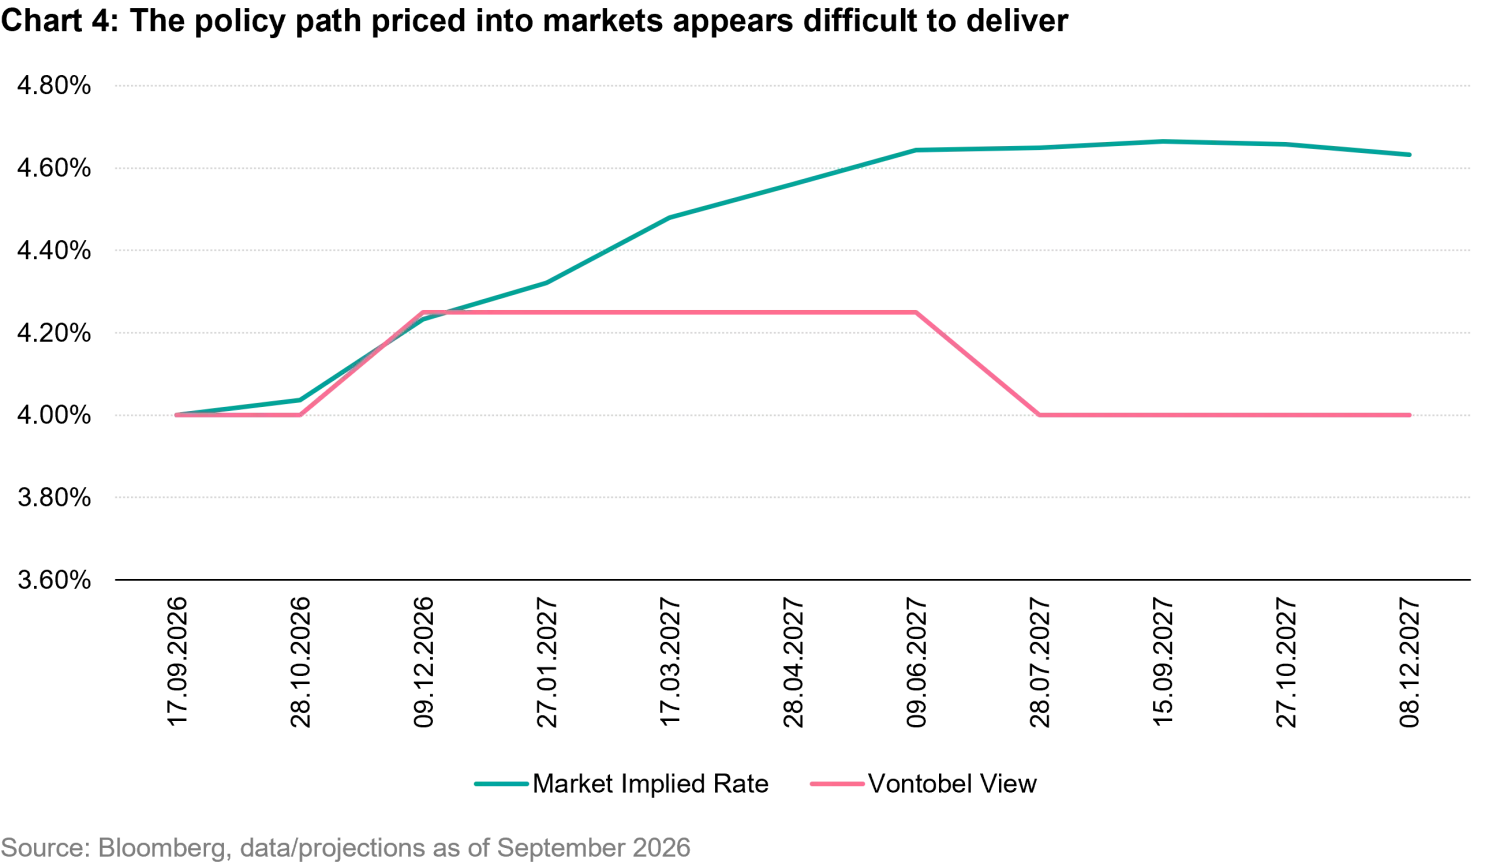
Bringing our views together in our positioning, we believe the outlook is now being driven by energy more than anything else. At the front end of the curve, we are not disputing that the recent hike was warranted, with core inflation running at 2.4% and headline inflation likely to face further upward pressure from high oil prices. However, we do not believe this will become a hiking cycle.
Should the situation in the Middle East persist, we would expect another rate hike in December but ultimately see that as the top. In our view, a more prolonged sequence of hikes would likely require evidence of second-round inflation effects through the labor market and consumer spending. Coupled with the political constraint discussed above, we believe the policy path currently priced into markets for 2027 may be difficult to deliver, which is why we favor a long duration position on the short end.
At the long end, fundamentals still point higher. We had a short duration position based on exactly the supply and term premium argument set out above. However, the 10-year Treasury yield has risen from 4.4% at the end of June to 5.2%, placing it at the higher end of our fair value range. We have recently closed that underweight and now remain neutral on the longer end. Currently, we are not yet comfortable in taking a position and rather maintain our neutral stance on the longer part of the curve.
From here, we want the market to give us better odds before we take a position again. That means either a significant overshoot in yields that would create an attractive opportunity to go long, or a rally that would re-establish the case to go back short. An unexpected ceasefire in the Middle East or a change in the long end Treasury supply could trigger the latter outcome. For the long side, however, we would prefer to see some form of capitulation on an upward move. With the MOVE Index, an implied volatility index for Treasury bonds similar to the VIX, still only 106 we believe that wash out in positioning has not happened yet.
What are the risks to our views?
The clearest challenge to our thesis would be a meaningful increase in services inflation back to May levels of about 3.5%. Such a move would undermine the argument that the current episode is primarily a goods and energy shock, as it would indicate that the broader pass-through into the domestic economy which we currently view as limited is, in fact, taking hold. Similarly, we would need to revise our case if wage growth were to start accelerating again.
At the front end of the curve, our base case is that the bulk of the repricing has already occurred. As a result, a further tightening move accompanied by guidance signaling a hiking cycle would invalidate that view, and we would likely step aside rather than argue with it.
The tail risk we take most seriously is the possibility of a ground campaign against Iran after the midterm elections, which could push oil prices into territory that we cannot sensibly model and would make the front-end policy debate largely academic.
The opposite tail risk deserves equal consideration. Brent crude fell by around 40% in a matter of weeks earlier this year when an agreement over the Strait of Hormuz appeared close. A durable reopening of the strait could remove the premise of the recent hawkish repricing, in our view.



