Emerging market bonds: The gateway to income and spread tightening
Fixed Income Boutique
- Spreads have tightened since end-of-March highs, but still remain elevated from a historical perspective
- Majority of yield currently comes from the spread
- For investors seeking income, emerging-market spreads look attractive compared to equities where dividend pay-outs and share buybacks can and are being cancelled
- Emerging-market bonds are an underinvested asset class, providing opportunities for active investors
Introduction
Investors are struggling to manage the economic ramifications of the global coronavirus shock. With most industries affected in every corner of the world, investors are wondering where to allocate their assets.
To ease the economic impact, central banks across the world reacted to the corona crisis with swift monetary easing, resulting in yields plummeting. In developed markets (DM), this brought yields back down to sub-zero levels. With income now scarce and limited spread-tightening potential left in DM, investors will have to either sit on their hands, or go searching for yield further abroad. Fortunately, this is where emerging markets (EM) can still offer a wealth of opportunities.
Particularly as spreads are still above pre-corona levels, and even at the investment-grade sovereign level, investors can find yield in EM.
In addition, economic fundamentals support the case for EM. While economic contraction in 2020 is a fact across the globe, the International Monetary Fund estimates that for EM it will only be half of that compared to DM and with a faster return to growth in 2021.
The EM bonds universe is broad, containing many asset classes and different countries in various stages of the economic cycle. This means an opportunity set that offers maneuverability and a multitude of choices to suit investors with differing risk appetites.
To ignore EM bonds at this time, is an opportunity lost, in our view, and in this white paper, we strive to make the case why now is the time to allocate to EM bonds.
The “old” cycle provides a solid foundation
In recent history, there have been numerous “pull” factors, which have made EM debt an attractive proposition. However, it remains an underinvested asset class for many investors.
Economic fundamentals for EM have been favorable over the past years and now, with the onslaught of the corona crisis, they look more robust compared to DM.
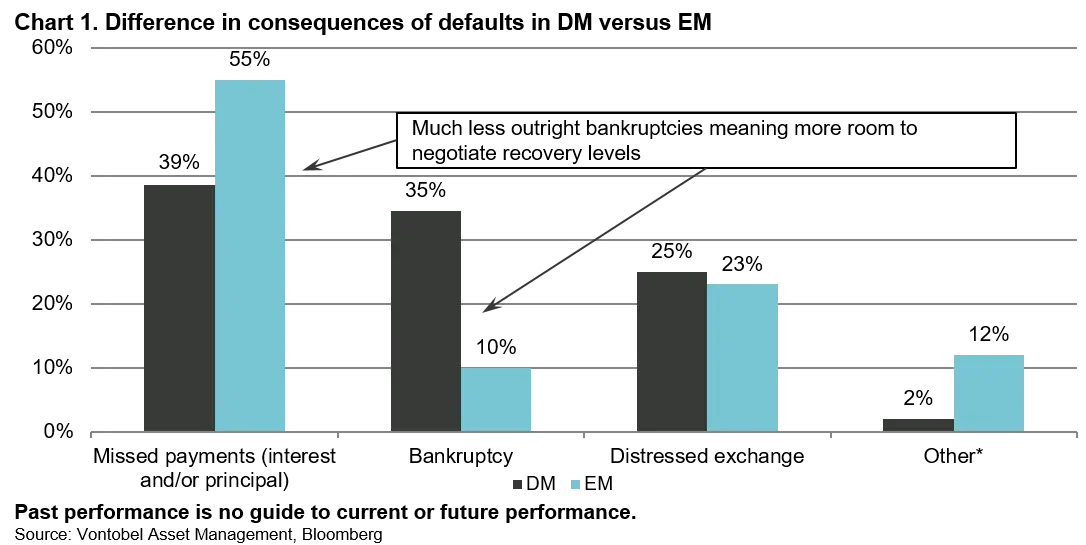
The concern that holds many investors back from investing in EM bonds is a fear of defaults. While defaults do happen – not just in EM but bond investing in general – they are rarer than generally perceived, and the consequences tend to be less severe than in DM (see chart 1).
Due to the underinvested nature of EM bonds, there is a structural inefficiency built into the asset class, this results in higher spreads, which are ever more pronounced in a low-yield environment. Furthermore, the structural inefficiencies create opportunities that active managers can exploit.
The dawning of a “new” cycle
Now, EM bonds are in a situation where spreads are elevated, markets have stabilized and the technical and fundamental landscape provides investors with plenty of opportunities for superior long-term risk-adjusted returns.
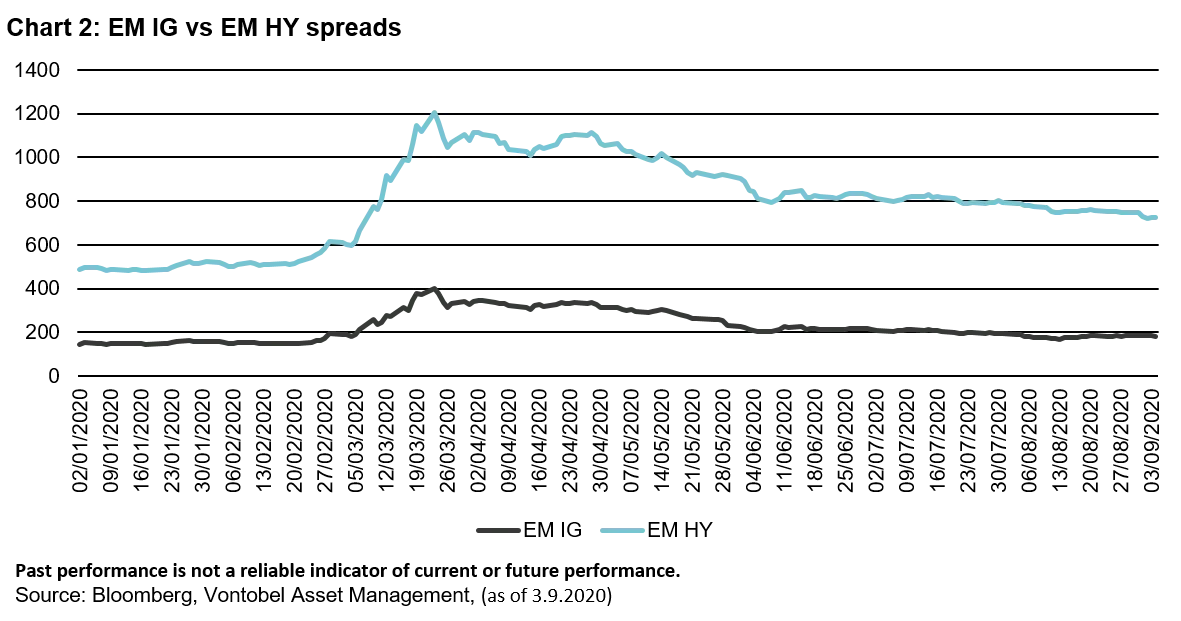
Recoveries from severe bond market drawdowns tend to happen in three stages. First, when investors begin to return to markets, they look for higher-quality countries and names. This is what has played out in recent months, as DM bonds began to recover, led by investment-grade bonds as investors sought to take advantage of the post-selloff premiums available in higher-quality names. The second stage comes as these premiums disappear and investors begin to move into DM high-yield names. The third rotation is the recovery of EM bonds, again, beginning with the higher-quality EM sovereigns and investment-grade corporates, followed by EM high yield.
This is what we see happening now (see chart 2). Spreads spiked in late February, but by late March, they began to recover. This shows that investors were and still are moving into EM bonds, as the markets have stabilized and investors look for yield and further spread tightening. While the recovery in EM still lags DM, EM is now catching up.
Where do we go from here?
Longer-term spreads depend on economic growth (fundamentals), liquidity (technicals) and relative value of EM bonds compared to alternatives (valuations).
In terms of fundamentals, issuers that can afford to pay the spread will do so, no matter where they are. If spreads are high, there will be fewer issuers (and less growth as less issuers can recoup the capital cost). If spreads are low, the reverse is true. However, EM remains supported by:
- Stronger short-term growth metrics, regardless of exceptions, Covid-19 appears to have affected EM less than DM due to a younger population and less stringent lockdowns. But health systems are less equipped to cope with the pandemic and these countries are less advanced in “flattening the (infection) curve”. Overall, according to the IMF, this translates into improved (or “less bad”) growth expectations for this year, compared to DM. Furthermore, growth is expected to be weaker in DM than EM in 2021 (see chart 3).
- Better debt metrics (less debt to GDP than in G4 for example), although access to capital is a bit harder now than before the crisis but this burden has been relaxed due to the liquidity creation

As the economy looks to recover, and fundamentals improve better/quicker than expected, this should be supportive of credit spreads tightening. In the meantime, spreads should remain wide of the lows seen in the first quarter of 2020, as a lot of spread tightening has already taken place.
Moreover, a rising tide will not lift all boats. We have observed increased incidences of default in both sovereign and corporate markets. As in DM, defaults and restructurings are likely to rise from here. Indeed, deteriorating individual names would probably keep a cap on benchmark-level spread tightening.
As concerns technicals, liquidity injections have been huge as chart 4 shows. In short, G20 central banks have injected an estimated 4.5 trillion US dollars (source: Deutsche Bank) into the financial system in the second quarter of 2020, an amount it took them over three years to achieve after the 2008 global financial crisis. This does not include fiscal or quasi-fiscal measures, which have been announced at a national (or pan-European) level. Furthermore, it is important to note that in response to unprecedented economic lockdowns, governments are expanding the fiscal deficits in a manner rarely seen in the past.

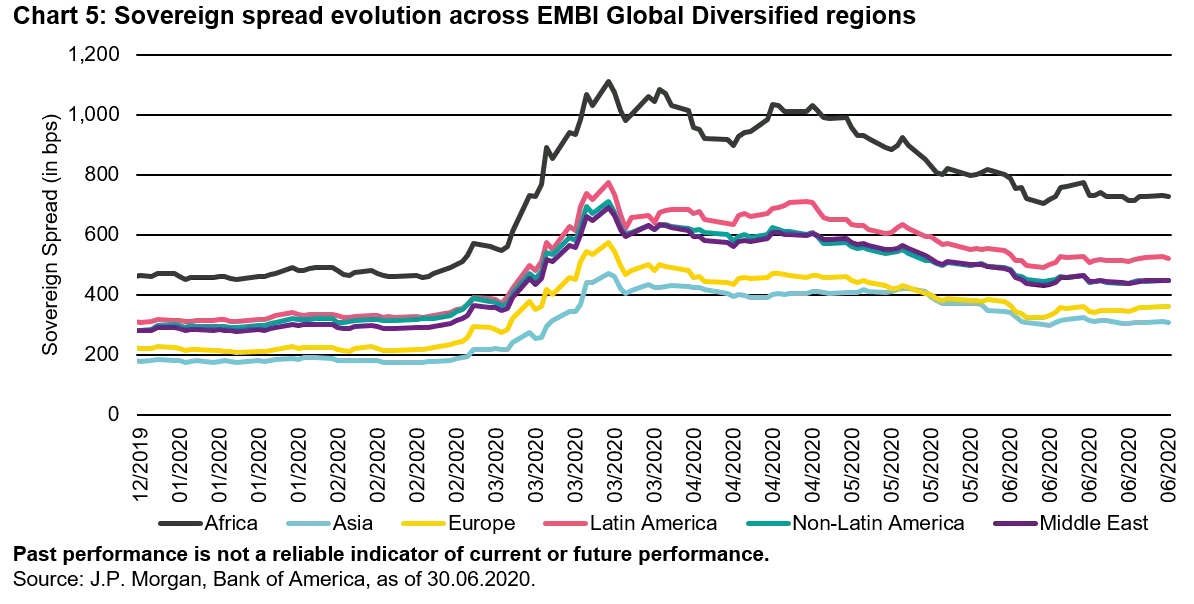
Just as equities and most spread markets, EM debt is a flow driven asset class exposed to sharp changes in both inflows and outflows depending on investor sentiment. Therefore, it is the higher-quality EM countries with a stronger base of domestic savings that perform best during and following a selloff (see chart 5).
Indeed, outflows were severe in the first half of the year. Even in 2018, with monetary policy tightening from the US Federal Reserve and the start of trade wars, flows were positive throughout the year.
Primary issues have also recovered, which leads us to believe that the recovery is on a solid footing. In fact, April (when markets had calmed down) was the month with the highest level of gross issuance in history. There were several successful new issuances from premium investment-grade names such as Qatar and Petronas, for example.
This is the current status quo: once again, investors are beginning to find it hard to find yield in DM investment-grade bonds. At the same time, hard-currency EM bonds, both sovereign and corporate, are at elevated spreads with flows beginning to return. This also explains why since the stabilization in April and the significant rally since May, the top regional performing region has indeed been Africa. Top country performer in May was Angola with a whopping +40% return. Even Ecuador and Argentina, which both defaulted in May, delivered circa +30%. This again serves to demonstrate that investors can generate significant returns in stressed names due to overreactions.
The key question for investors is, as always, about valuations: does the current price offer the potential for sufficient returns to compensate for the risk you take? Currently, we believe that EM bonds do just that based on flows and valuations.
We saw in chart 5 that spreads in EM are currently at an elevated absolute level. We believe they are also attractive from a relative perspective compared to other opportunities.
Tendency to bounce back
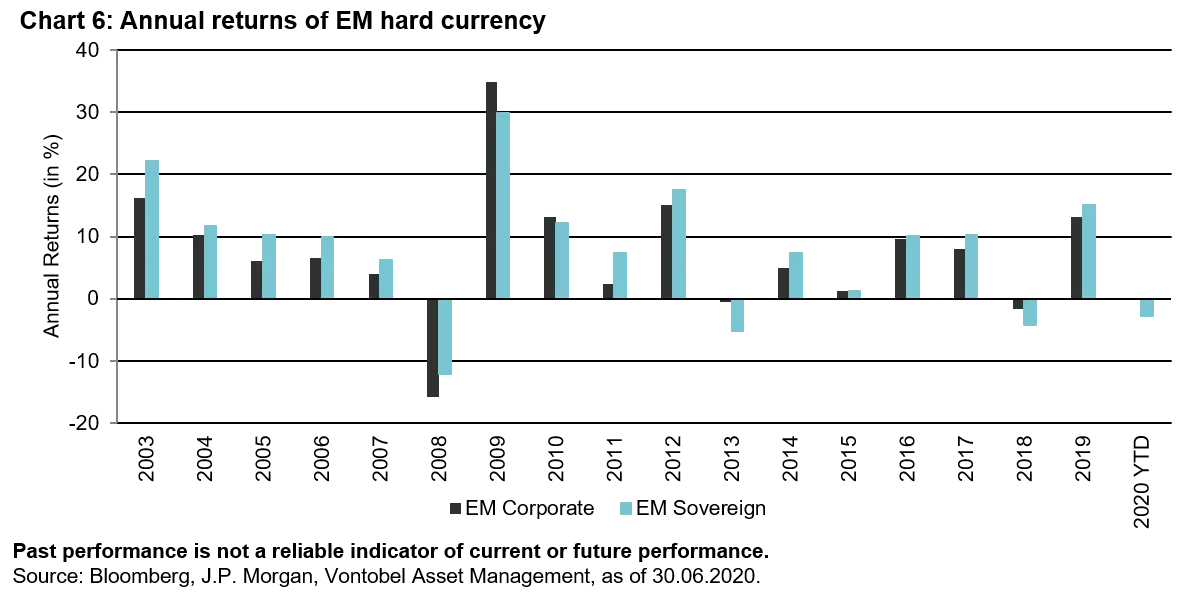
One key factor that shows the tendency for EM to bounce back from drawdowns is the fact that hard-currency sovereign and corporates have never had two consecutive years of negative performance (see chart 6). Furthermore, a year of negative performance tends to be followed by a year of strong performance. This, in our view, is because bonds are a contract to reimburse principal and pay coupons (unlike equities, where dividends are not mandatory). At some point, the price discount becomes too elevated and begins to attract buyers resulting in a sharp V-shaped recovery in prices. Only a real and present danger of a huge solvability crisis threatening principal and coupon payments could prevent this from happening. Whilst this could come to pass, the presence of the IMF, World Bank, bilateral lenders (who once again stood up to be counted in this crisis) have tended to dampen this risk in everyone’s interest. In this respect, specific cases of historic restructuration/default in EM sovereigns have resulted, most often, in relatively high recovery rates for bond holders.
EM bonds: an active manager’s paradise
Volatility leads to suboptimal behavior such as overreaction and segmentation, while creating opportunities for active, high-conviction managers. The goal of this paper is not to discuss the way we manage our portfolios, our approach, philosophy, and process, but to highlight stress-related dislocations rarely seen before. In our “spread optimization” approach, we seek to maximize spread over benchmark for a similar level of average rating. This excess spread above benchmark, in the immediate post-selloff period in March and early April, is the highest we have ever been able to generate, exceeding 400 bps at some stage (compared to 150 to 300 bps on average). This is an illustration of the mispricings, anomalies, and inefficiencies, which can reign in this asset class.
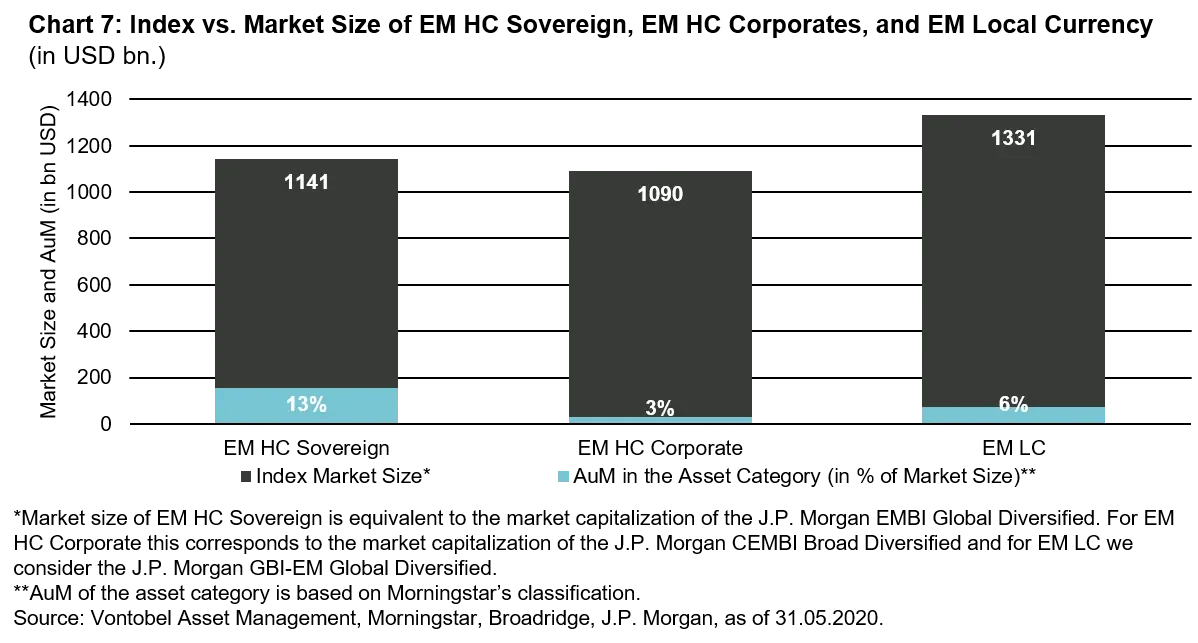
Whilst the inefficiencies in EM sovereigns are significant, in EM corporates they are on another scale altogether. EM bonds are an underinvested and inefficient asset class, and it is inefficiencies that create opportunities. The main cause of inefficiency is that EM bonds lack a large dedicated investor base. Chart 7 shows the total market capitalization of EM hard-currency sovereigns and EM hard-currency corporates (black bar) and the size of the Morningstar peer group of the category in question (blue bar). The chart demonstrates how large both asset classes are, yet how few investors specialize in them – this equates to inefficiencies and opportunities for active managers. This is why we believe that EM bonds are an active manager’s paradise.
As an inefficient and underinvested asset class, EM bonds offer many benefits for active investors. However, we would like to highlight the three main opportunities available to investors in EM bonds in the current environment:
- Event-driven opportunities as the EM asset class is prone to overreaction due to short-term news flows, resulting in both bouts of gloom and euphoria.
- Relative-value opportunities in non-benchmark bonds as bonds in an index trade at excess premiums due to passive flows.
- Lead and lag opportunities where EM lag DM after drawdowns and lead in times of euphoria.
Conclusion
Few fixed income sectors offer the same diversification, combined with the potential for income and spread tightening as EM bonds. Therefore, the case for allocating to EM bonds is now strong, in our view.
We have now left the old cycle and started a new one. The selloff this spring was unprecedented and the historical factors which “pulled” resources to EM have been to a degree put on “pause” and attractive fundamentals are clearly not a driver of EM credit spread tightening today. Arguments such as high spread in a low-yield environment, and the importance of the IMF as a lender of last resort remain valid.
The policy response to the crisis has also been unprecedented. We only need to remember the events of 2008 to understand how important liquidity provision is for market participants. The effect of the recent wave of liquidity has been to push risk-free rates (specifically in the US) to historical low levels. Lower risk-free rates are generally supportive of higher equity multiples or indeed tighter spreads. For EM sovereigns, the total yield is currently similar to the year-ago level (5.5% in USD), however, the two main components which make up the yield have rebalanced, with US Treasury rates falling and credit spreads widening significantly.
The effect has driven an all-time high in the spread/yield ratio, suggesting spreads are attractive barring a material and systemic impact on EM solvability. Which we do not foresee based on the fundamental outlook for EM.
With lower US growth, ballooning deficits and lower relative yields, the US dollar has started to turn lower. Traditionally this is a bullish signal for EM. Spreads have tightened since end March highs, but still remain elevated from a historical aspect. Given the deterioration in fundamentals (collapse of growth, trade, capex, etc.) higher yields compared to the recent past would appear justified. We would thus expect further spread tightening given the level of liquidity provision, but would not expect to see pre-crisis levels of spreads reached again in the short term.
The severity of the selloff has created unprecedented opportunities born of sub-optimal investor behavior, overreaction, and indeed blind panic. The opportunity set for an active manager remains tremendous, in our view, even if the lower-hanging fruit have already been picked.
With high benchmark spreads, EM bonds exhibit historically elevated yield-to-maturity levels for investors. High entry levels of yield to maturity have historically been good predictors of future returns for investors who remain for the long term (five years minimum). High yields also provide a “cushion” against a rise in risk-free rates and/or widening spreads. This has meant that EMD, sovereign and corporate, have never delivered two consecutive years of negative returns.
Compared to other spread asset classes (DM investment grade and high yield), EM is clearly lagging. The gap is significant, it is up to investors to decide whether this political/liquidity/Fed backstop premium is justified or not. We believe it is not.
For investors seeking income, EM spreads look attractive compared to equities where dividend payouts and share buybacks can and are being cancelled. Indeed, some equity markets are looking a bit expensive, in our view.
But this, on aggregate, positive outlook does not mean that investors should expect spreads to tighten in a linear manner. There will be volatility, due to the medical, economic, or indeed geopolitical situation.
The big picture is that EM debt remains a risk asset. Investors need risk assets in their portfolio construction, and EM debt remains attractive within the risk asset space.


