Our Asia Equity Strategy is a concentrated portfolio of our best ideas across Asia ex-Japan. Our approach is based on returns being driven by a long-term investment in companies with relatively stable and predictable earnings growth that can be sustained for extended periods of time. The strategy draws on the expertise of our exclusive 21 strong investment team. ESG is integral to our approach given our focus on relatively stable and predictable ‘quality’ earnings growth combined with long-term holding periods. While the strategy is benchmark agnostic, performance is shown relative to the MSCI All Country Asia ex Japan Index.
Strategy name changed from Asia Pacific Equity to Asia Equity effective February 15, 2022.
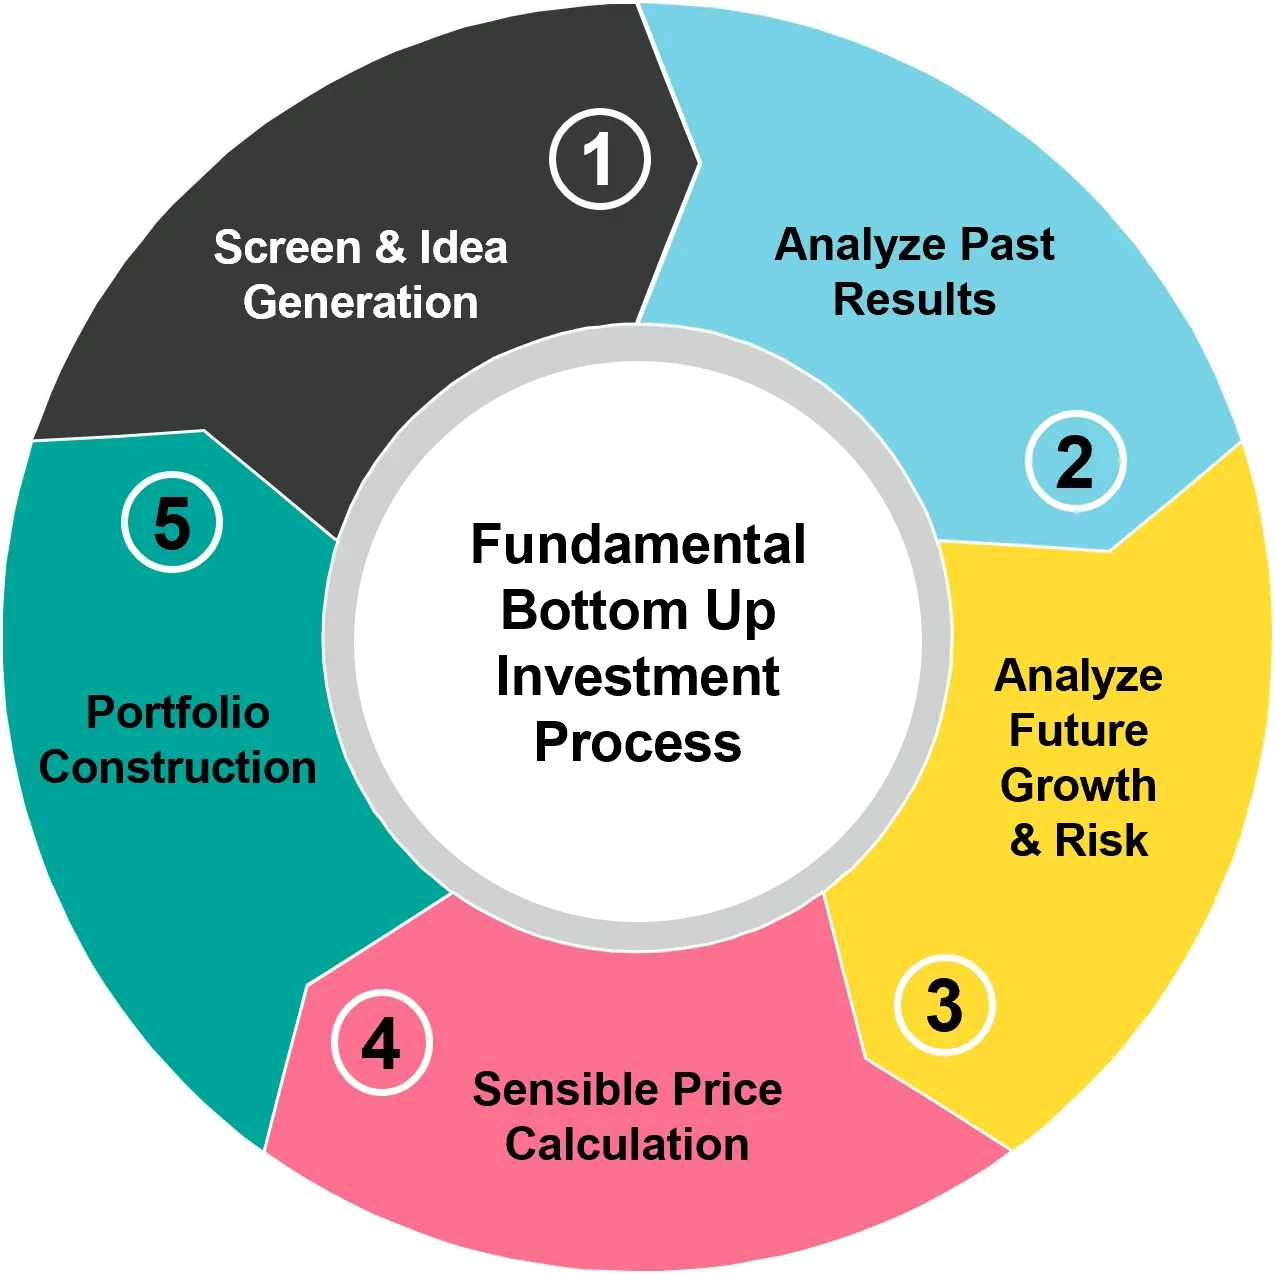
Investment Process
Many asset managers follow a high quality growth style, but what sets the Quality Growth Boutique apart? We have spent decades building our team and distinct investment approach. Members of our research team discuss our philosophy and process.
Continuous five-step investment process
Concentrate on business analysis (bottom-up approach)
Source: Vontobel. All results portrayed are expressed in U.S. dollars. Periods under one year are not annualized. Past performance is not necessarily indicative of future results.
The composite‘s gross rates of return are presented before the deduction of investment management fees, other investment-related fees, and after the deduction of foreign withholding taxes, brokerage commissions and transaction costs. An investor‘s actual return will be reduced by investment advisory fees. The composite‘s net rates of return are presented after the deduction of investment management fees, brokerage commissions, transaction costs, other investment-related fees and foreign withholding taxes. Results portrayed reflect the reinvestment of dividends and other earnings. The comparison to an index is provided for informational purposes only and should not be used as the basis for making an investment. There may be significant differences between the composite and the index, including but not limited to the risk profile, liquidity, volatility and asset composition. The MSCI All Country Asia ex Japan Index is a free floatadjusted market capitalization index of approximately 700 stocks that is designed to measure equity market performance in 13 countries in the Asia region, excluding Japan. The index is calculated on a total return basis with net dividends reinvested. It reflects withholding taxes, but not fees and other investment expenses.
Data as of 12-31-2024
Characteristics1
Vontobel Asia Equity
Capitalization (US$ bn), weighted avg
286.3
P/E - Forecast 12-month, weighted harmonic avg
16.9
Dividend Yield (%)
1.6
5 Yr Historical EPS Growth (%)
10.9
Return on Equity, weighted avg (%)
17.6
Risk Statistics (5 Year)2
Vontobel Asia Equity
Annualized Alpha
-3.6
Beta
0.9
Sharpe Ratio
-0.2
Annualized Standard Deviation
17.1
Top 10 Portfolio Holdings3
%
Taiwan Semiconductor Manufacturing Company Limited
9.8
Tencent Holdings Limited
7.8
SK hynix Inc.
7.1
Samsung Electronics Co., Ltd.
5.2
Cipla Limited
3.2
Reliance Industries Limited
3.1
Power Grid Corporation of India Limited
3.1
President Chain Store Corporation
3.0
NVIDIA Corporation
2.9
HDFC Bank Ltd.
2.8
% in Top 10 Holdings
48.0
Source: FactSet.
1 Based on a representative portfolio and shown as supplemental information to the composite presentation. Other accounts contained in the composite could have materially different statistics. The basis for which the representative portfolio was selected is that the portfolio is the oldest and most representative account. The securities identified and described do not represent all of the securities purchased, sold or recommended for client accounts. The reader should not assume that an investment in the securities identified was or will be profitable.
2 Based on gross performance of the Asia Equity Composite. The composite‘s gross rates of return are presented before the deduction of investment management fees, other investment-related fees, and after the deduction of foreign withholding taxes, brokerage commissions and transaction costs. An investor’s actual return will be reduced by investment advisory fees
3 The top 10 holdings are based on a representative portfolio, and are shown as supplemental information to the Asia Equity Composite. The securities identified and described do not represent all of the securities purchased, sold or recommended for client accounts. The reader should not assume that an investment in the securities identified was or will be profitable.
Data as of 12-31-2024
Country Allocations
Sector Allocations
Source: FactSet. Data is based on a representative portfolio and shown as supplemental information to the composite presentation. Other accounts contained in the composite could have materially different statistics. The basis for which the representative portfolio was selected is that the portfolio is the oldest and most representative account.
Asia Equity Composite
Composite description
The Asia Equity Composite includes all discretionary accounts, excluding wrap accounts and private client assets, whose principal investments include equity or equity-linked securities of issuers located in the developed and emerging markets of Asia excluding Japan. The minimum account size for this composite is $1 million. The composite was created and incepted on January 1, 2001.
Benchmark description
Since February 15, 2022, results of the composite are shown compared to the MSCI All Country Asia ex-Japan Net Total Return Index (MSCI AC Asia ex-JP ND).The benchmark is used for comparative purposes only and generally reflects the risk or investment style of the investments in the composite. Prior to February 15, 2022, results of the composite were shown compared to the MSCI All Country Asia Pacific ex-Japan Net Ttoal Return Index.
Claim of compliance
Vontobel Asset Management, Inc. claims compliance with the Global Investment Performance Standards (GIPS®).
Firm definition
Vontobel Asset Management, Inc. is an investment advisory firm registered with the Securities and Exchange Commission, under the Investment Advisers Act of 1940, as amended, and a subsidiary of Vontobel Holding AG, Zurich, Switzerland. For GIPS Compliance purposes, Vontobel Asset Management, Inc. is defined to include all institutional accounts managed by the Quality Growth boutique, excluding wrap accounts and private client assets managed in previous years.
List of composites and how to obtain a GIPS Report
To receive additional information regarding Vontobel Asset Management, Inc. including a GIPS Composite Report for the strategy presented in this advertisement and a list of all composite descriptions managed by the firm, contact the GIPS Compliance Office at gips@vontobel.com or write Vontobel Asset Management AG, GIPS Compliance Office (G27 611), Gotthardstrasse 43, 8022 Zurich, Switzerland.
Fee schedule
The standard annual management fees charged by Vontobel for the Composite are: 0.95% on the first $100 million, 0.85% over $100 million. Certain accounts may have negotiated management fees, which may be higher or lower than the standard fee schedule. Investment advisory fees are further described in Part 2 of its Form ADV.
Past performance and investment risk
Past performance is not indicative of future results. Investing involves risk, including possible loss of principal. Value and income received are not guaranteed and one may get back less than originally invested.
CFA Institute
GIPS® is a registered trademark of CFA Institute. CFA Institute does not endorse or promote this organization, nor does it warrant the accuracy or quality of the content contained herein.
Important information
The index comparisons in this presentation are provided for informational purposes only and should not be used as the basis for making an investment decision. Further, the performance of the composite and the Index may not be comparable. There are significant differences between the composite and the indices referenced, including, but not limited to, risk profile, liquidity, volatility and asset composition. Please note that an investor cannot invest directly in an index. Investments discussed in the presentation is based on a representative portfolio and there is no assurance that Vontobel will make any investments with the same or similar characteristics as the representative portfolio presented. The representative portfolio is presented for discussion purposes only and is not a reliable indicator of the performance or investment profile of the composite.Any projections contained in this presentation are based on a variety of estimates and assumptions. There can be no assurance that the assumptions made in connection with the projections will prove accurate, and actual results may differ materially. The inclusion of projections should not be regarded as an indication that Vontobel considers the projections to be a reliable prediction of future events and projections should not be relied upon as such. This disclaimer applies to this presentation and the oral or written comments of any person presenting it. The inclusion in the composite of the performance of wrap accounts and private client assets could result in a material difference in the performance returns. There can be no assurance that investment objectives will be achieved. Clients must be prepared to bear risk of a total loss of their investment. Due to a varying frequency of the fees being paid and associated compounding effects, the actual difference between gross and net returns may differ from the stated annual fee. For example, on an account with a 0.50% fee, continuous monthly gross performance of 1.50% and the fees being deducted monthly, the compounding effect will result in an annual gross return of 19.56% and a net return of 18.97%. Thus, a $10,000 initial investment would grow to approximately $14,295 gross of fees, versus $14,155 net of fees, over a two-year period. Effective January 2016, the net-of-fees rates of return are calculated based on the fee schedule. All net returns that were previously calculated on a cash basis are linked to the returns being calculated under the new methodology, reflecting daily accrual of fees. Vontobel Asset Management, Inc. (“Vontobel”) is registered with the U.S. Securities and Exchange Commission as an investment adviser under the Investment Advisers Act of 1940, as amended, in the USA. Registration as an Investment Advisor with the U.S. Securities and Exchange Commission does not imply a certain level of skill or expertise. Vontobel is exempt from the requirements to hold an Australian Financial Services License under the Corporations Act in respect of the financial services it provides to Australian wholesale clients under ASIC Class Order CO 03/1100. Vontobel is regulated by the US Securities and Exchange Commission under US laws, which differ from Australian laws.