

Quantitative Investments
Your partner for leading quantitative investment solutions.
Almost every economist is currently forecasting a recession in the eurozone and the US in the coming year, even though the labor markets in the industrialized nations are remarkably robust and equity markets have been rising for the past two and a half months. However, the statistics support the more pessimistic view: Recessions typically follow on from aggressive interest rate hikes1. The US yield curve, which is relatively reliable when it comes to forecasting recessions,2 also currently indicates a 60 percent likelihood of a recession starting in the second quarter of 2023.
This view is shared by the Wave, our business cycle model, which shows that emerging markets and industrialized countries alike are in “contraction”. The high degree of financial market volatility and the market distortion in 2022 also suggests that 2023 is likely to see economic collateral damage. Our risk model, which compares the current financial market environment with snapshots from the past, is currently also showing a lot of similarities with 1989. One year later, the US entered a deep recession accompanied by a sharp correction on the equity market – something that has been a feature of many US recessions since records began in 1900. In this context, the US stock market tended to enter a bull market only after a recession had begun.3
The equity markets have been unimpressed by this statistical evidence since mid-October. Our allocation model explains why: The model sees a rising expectation among market participants of interest rate hikes ending soon and the first rate cuts at the end of 2023. If these expectations are reinforced, this could provide further impetus for market performance in the coming weeks. This is also likely to explain the clearly negative market response to the hawkish central bank comments by Fed Chairman Jerome Powell and ECB President Christine Lagarde (“our job is far from being completed”) following the interest rate decisions in December. The potential recession is still too far in the future (second quarter of 2023), while inflation is falling more sharply than expected.
The next litmus test for the markets will be the US inflation figures and the central bank meeting on February 1, 2022. These will get us a little closer to answering the question of whether things will be completely different this time – and whether a bull market has already begun despite the prospect of a US recession.
1. Our analysis of the 10 largest industrialized countries since 1950 (59 rate hike cycles) shows that such an aggressive rate hike cycle as we are currently seeing in the U.S. has often led to recession.
2. All recessions since the 1980s recorded an inversion of the yield curve 12-24 months before they began, i.e., higher yields on short-dated than on long-dated government bonds.
3. 1918, 1926 and 1945 were the only occasions on which US equities entered a bull market before the recession began. The sample covers a total of 24 recessions since 1900.
In December, the phase prior to the recession in the early 1990s remained extremely important in our SDRM Model , which compares the similarity of past market situations with the current market environment. Of the 50 most similar days in the past – the closest neighbors to today – days in September 1989 still stand out almost exclusively.
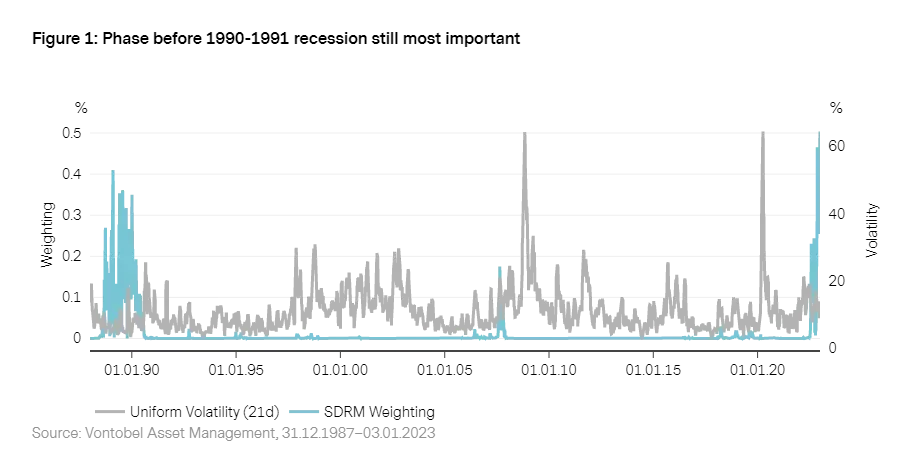
In addition to a banking crisis (savings and loan crisis), the economy was confronted with rising inflation ahead of the 1990 recession. To prevent growing pressure on prices and wages, the Fed extended the tightening of monetary policy conditions that had begun in early 1988. However, it proved unable to gradually lower inflation without also weakening an already recession-prone economy. Indeed, the development of the money supply between 1987 and 1989 is believed to have contributed to the economic slowdown ahead of the actual downturn in mid-1990.4
A year earlier, in 1988, the Merrill Lynch Option Volatility Estimate (MOVE)4 was introduced. It is a weighted average that measures the implied volatilities of at-the-money options5 on U.S. government bonds with 2-, 5-, 10- and 30-year maturities. Since its inception, the MOVE has moved in a base range of 80 to 125 basis points.6
At the beginning of 2022, it exceeded 100 basis points and has fluctuated in a range of 125 to 160 since the summer.8 In response to the Fed meeting, it temporarily fell to 111 in mid-December and currently stands at 120 basis points. The long period of increase in the index indicates that the bond market is currently reducing a great deal of risk, which was often accumulated in advance through leverage effects.
On the equity market, the VIX index9 – the counterpart to the MOVE, which measures market expectations of the 30-day implied volatility of options on the S&P 500 – moved in a range from 19 to 25 basis points in December and currently sits at 22 points. The diminishing uncertainty is attributable to the slowdown in the tightening of key interest rates, falling inflation, and the fact that the economic environment remains robust.
4. Walsh, C.E. (1993). What caused the 1990-1991 Recession? Federal Reserve Bank of San Francisco. Economic Review 2, 33-48.
5. The MOVE index was the first relevant index to attempt to measure expectations of the future volatility of exchange-traded interest rate derivatives based on government bonds (mainly US Treasuries) and interest rate swaps.
6. An option is described as at-the-money when the strike price is equal to the price of the underlying stock.
7. Since this is normalized volatility, it implies daily Treasury rate volatility of about 5 to 8 basis points.
8. The last time such high figures were observed over such a long period was during the financial crisis of 2008.
9. Since it was launched in 1997, the VIX has mostly moved between 18 and 35 basis points, albeit with occasional downward (10) and upward (85) deviations.
The economic outlook for the world economy deteriorated further in December. The Wave 10 remains in “contraction”, the most negative phase of the economic cycle for risky asset classes. 54% of the emerging economies and industrialized nations we study are now in contraction. The contraction signal is being driven in particular by the weak business and consumer climate, which is close to a 30-year low at 12%, and the real estate market.
The sharp rise in yields at the long end of the curve, driven by historically high levels of inflation and globally restrictive monetary policy, has led to plummeting real estate prices in Scandinavia and Australia in particular. This trend is most pronounced in Sweden, where house prices have now fallen by more than 10%. However, the higher yields are also reflected in the negative growth rate in global liquidity, which has reached a 40-year low in the industrialized nations of -3% p.a. in real terms. As a result, our economic cycle model puts the probability of remaining in contraction at 93%.
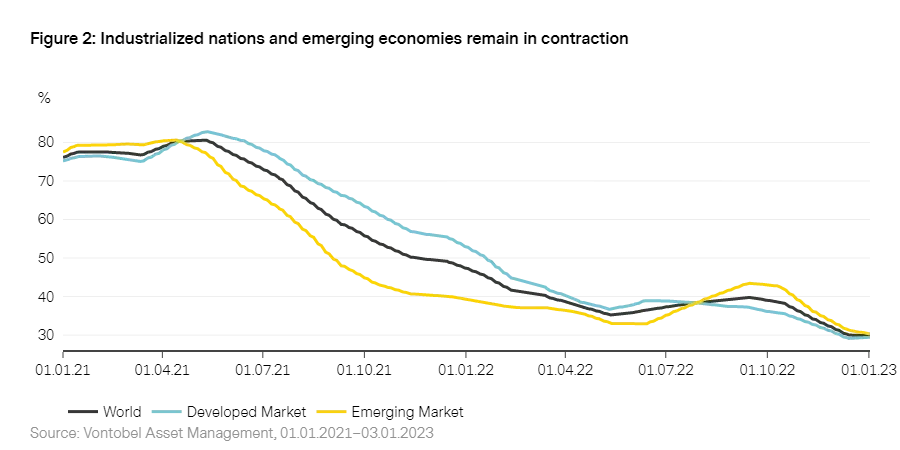
The ongoing restrictive monetary policy and the accompanying shrinking liquidity are reflected in a 65% probability of remaining in contraction in the industrialized countries, especially in Europe and the US. The likelihood of a recession in the US and the eurozone is rising accordingly, with the latter experiencing increased economic headwinds as the winter gets colder and following the ban on Russian energy imports that came into force in early December. Only Japan – whose central bank is sticking to its ultra-loose “yield curve control” monetary policy – saw considerably stronger economic momentum, with the Wave for the country gaining six percentage points as a result.
Although China has eased restrictions, its Wave is again in contraction. The recent restrictive COVID policy may have played a significant role. Dwindling economic momentum and unprecedented public protests in favor of easing COVID restrictions prompted the government to reconsider its policy. Although this is likely to help the Chinese economy and its Wave in the medium term, the economic damage in the short term could be even greater. With infections rising, a shortage of intensive care capacity and a low level of vaccination among older sections of the population, there is a risk of chaotic conditions in the immediate future. In addition to Asia, Latin America in particular, which was very robust in 2023, recorded the strongest loss of momentum.
10. For a detailed model description of our “Wave” economic cycle model, please see our white paper “ The Vescore Wave – a superior economic cycle model
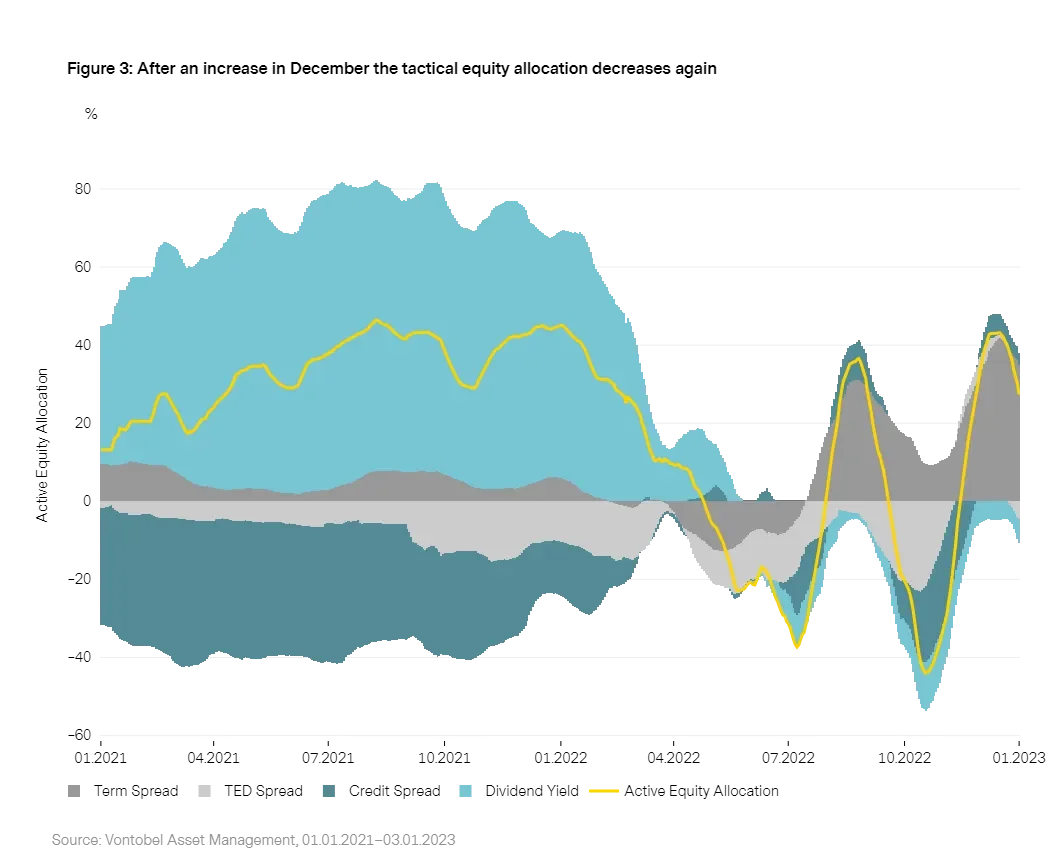
The diminishing uncertainty on the equity market, which is attributable to falling inflation and sustained robust economic data, suggests that the outlook among market participants is less pessimistic. However, this could cloud over in the first half of 2023 in anticipation of further Fed rate hikes and a recession.
Our equity allocation model had temporarily increased the tactical equity weighting to 93% in December (previous month: 76.2%), but lowered it again to currently 77.3% within the last week. On a monthly basis, the positive allocation contributions of the credit spread and the term spread have decreased. The latter represents the most significant single allocation contribution with 34.9%. In the current environment, the dividend yield and the TED spread show a short positioning.
After a year in which bond markets posted their worst returns ever, some optimism is returning due to easing inflationary pressures. However, uncertainty remains high. The MOVE index briefly fell to a lower level of 111 basis points following the Fed meeting in mid-December, but it remains in high territory at 120 basis points. Government bond prices also rose in response to the Fed meeting, leading to falling yields at the long end of the yield curve.
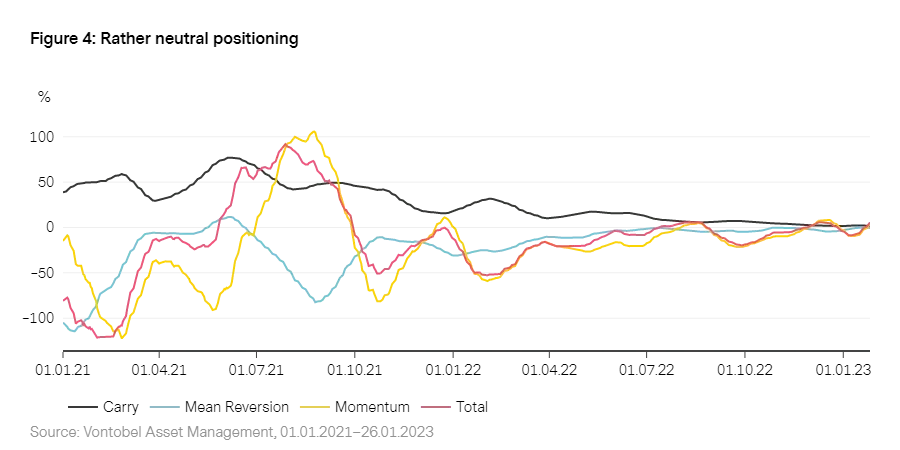
Our bond allocation management model had marginally increased the global bond ratio in December. In the past week, however, it has declined again and currently stands at a value of -5% . The Carry sub-model11, which we use to forecast future yield curve movements, continues to provide for positive positioning. The Momentum component12, which reacts to sentiment in the market, and the Mean Reversion sub-model13 indicate a short allocation in response to the lower yield curve level.
11. Carry strategies generally assume no or only minor changes in the yield curve.
12. The momentum component takes account of the fact that yield curves could change very substantially and permanently in a short period of time as a result of major announcements by central banks and political decisions.
13. Mean reversion strategies are based on the idea that short-term interest rates signal convergence to a dynamic equilibrium.
Important Information:
Past performance is not a reliable indicator of current or future performance. Indices are unmanaged; no fees or expenses are reflected; and one cannot invest directly in an index.
Any projections, forecasts or estimates contained herein are based on a variety of estimates and assumptions. There can be no assurance that estimates or assumptions regarding future financial performance of countries, markets and/or investments will prove accurate, and actual results may differ materially. The inclusion of projections or forecasts should not be regarded as an indication that Vontobel considers the projections or forecasts to be reliable predictors of future events, and they should not be relied upon as such. Diversification and/or asset allocation neither assures a profit nor eliminates the risk of investment losses.
Vontobel reserves the right to make changes and corrections to the information and opinions expressed herein at any time, without notice. This document is for information purposes only and does not constitute an offer, solicitation or recommendation to buy or sell any investment instruments, to effect any transactions or to conclude any legal act of any kind whatsoever.
