What do our models think about US recession risks?
Quantitative Investments
Inflation developments and recession fears will likely determine market sentiment in 2023. In our recent market outlook “MAS 2023 Outlook” we concluded that inflation, in particular in the US, will retreat quickly in the first half of 2023, mainly on the back of strong base effects and the global economic slowdown1. However, it remains unlikely that the Fed will reach its inflation target before 2025.
One way for the Fed to bring inflation down even faster would be to trigger a sizable US recession, leading to a faster easing of labor market conditions. According to Ball et al. (2022)2, bringing inflation down to target by 2024 would require a doubling of the US unemployment rate. This is probably unachievable without a US recession in 2023. Vescore’s model toolkit attaches a high probability for recession the Eurozone and the US.
And here is why:
Three ways of looking at recession probabilities
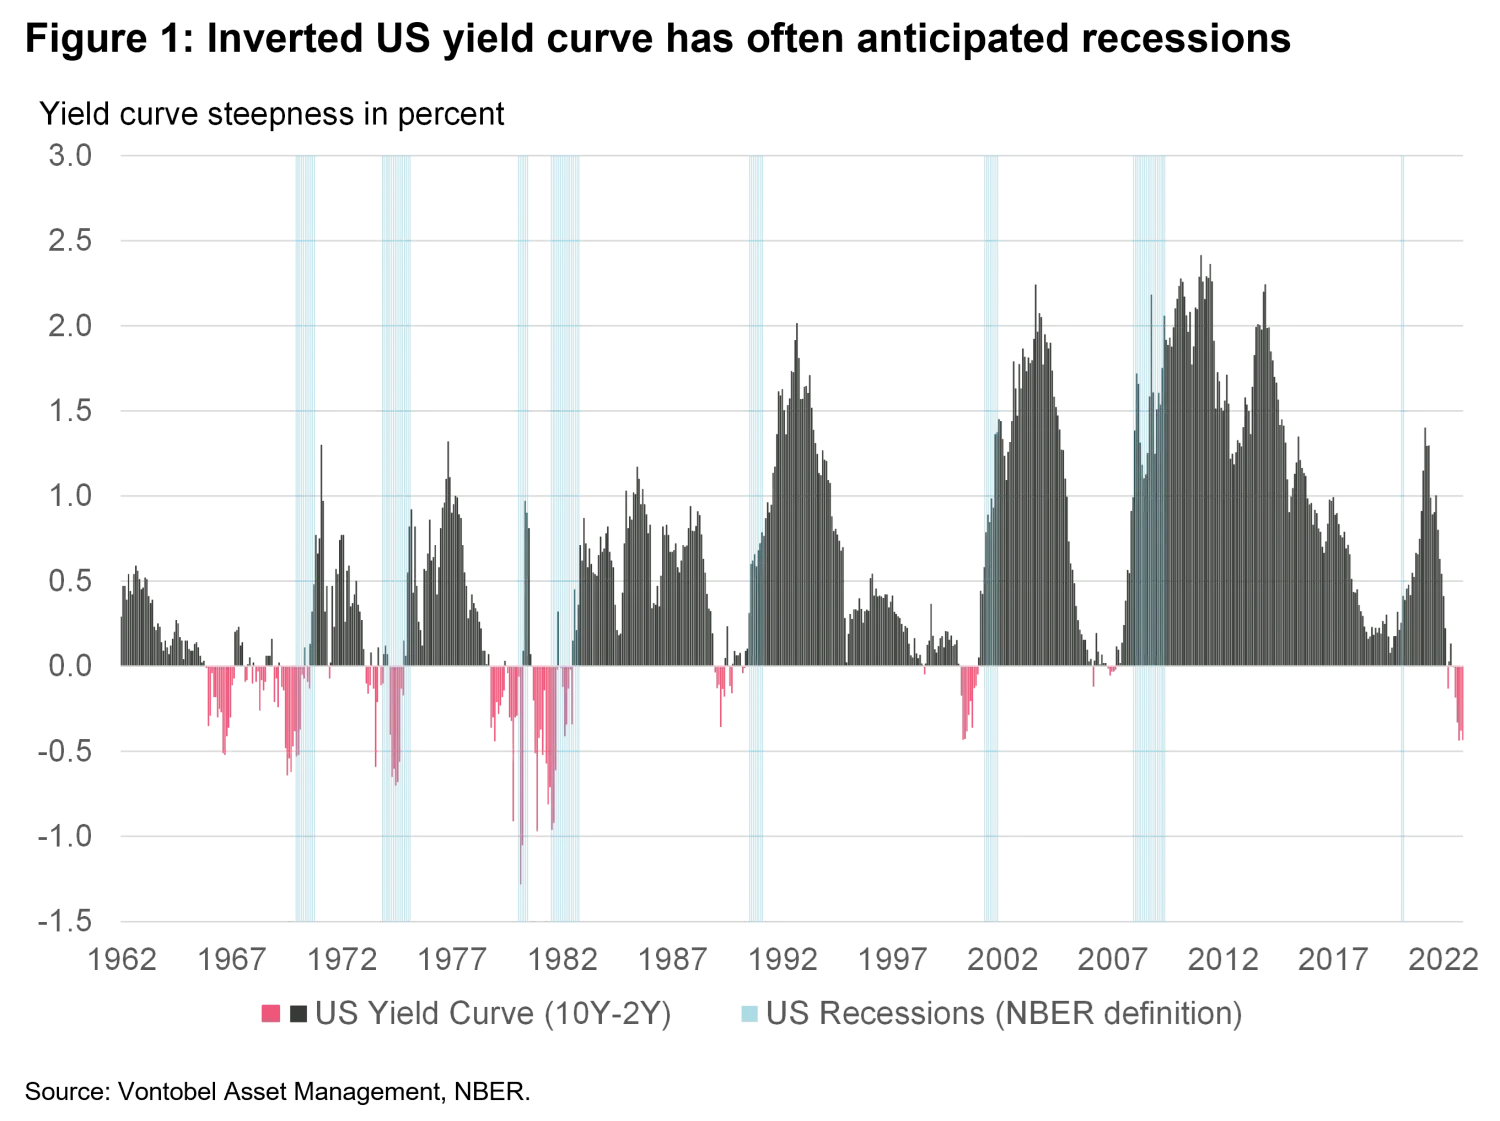
One way of assessing the likelihood of a US recession is the US yield curve, which has been a fairly reliable leading indicator of recession in recent decades (Figure 1). An inverted yield curve has often been followed by a recession. Our analysis reveals that the recession probability based on the inverted yield curve signal back in April 2022 is 70% for the 12 months following April 2023.

The second way of approaching the recession question is via our risk model State-Dependent Risk Measurement (SDRM)3, which uses a pattern recognition technique to find similar financial market conditions in the past that are similar to the current situation. By screening our database, the SDRM model concludes that 2022 shares major similarities with the year of 19894, in which the US experienced the savings and loan crisis triggering heightened financial market volatility. High and persistent financial market volatility often causes economic collateral damage with some delay5, as it did in 1990 when the US entered a severe recession. If history is any guide, the risk of a US recession in 2023 has significantly increased.
A third way of looking at the recession probability is our business cycle model “Wave”, which gave a contraction signal – the worst business cycle state for financial markets – already in December 2021.6 Going into 2023, the Wave remains pessimistic on the global and US economic outlook, still signaling further economic weakness from an already weak global growth environment.
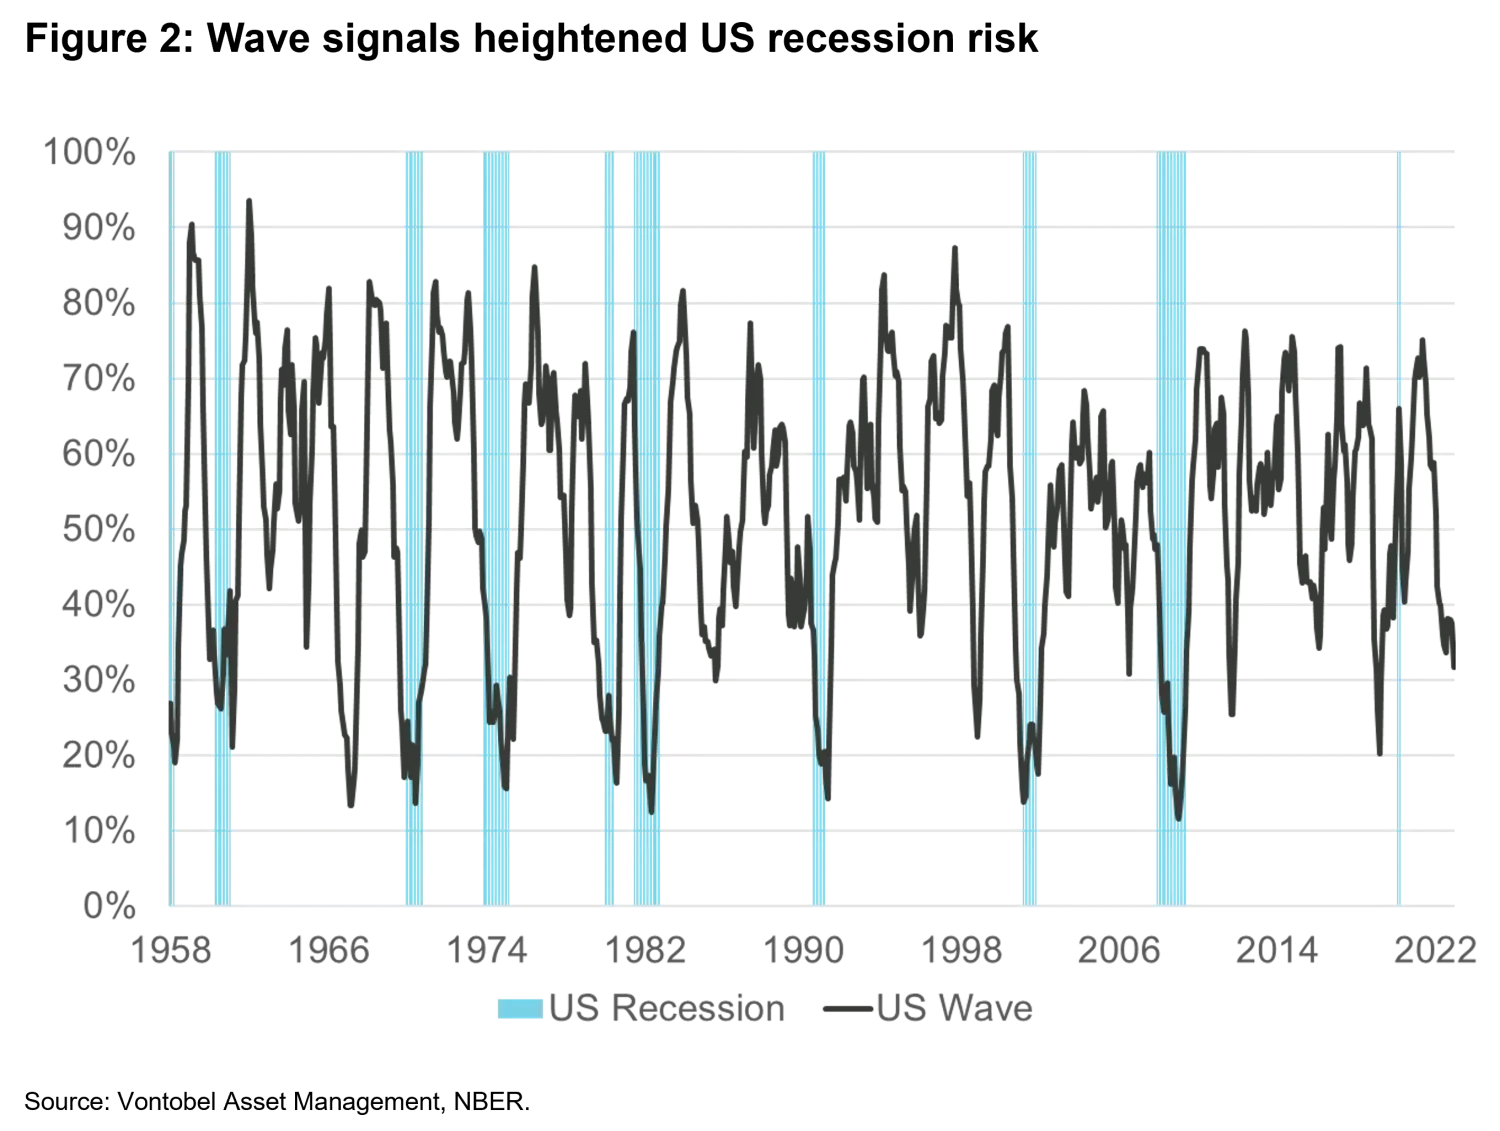
Even though the Wave concept is – by measuring growth momentum – most useful for asset allocation, there is a high correlation of the level of the wave and recessions (Figure 2). The further below 50% the wave is, the higher the recession probability. Our historical analysis for the US Wave – which dates back to the 1950’s – shows that the Wave contraction signal has been a necessary condition for a US recession (Figure 2). Except for the 2000 COVID driven recession, all recessions have been anticipated by the Wave in the 12 months before.
While a below 50% wave seems to be a necessary condition for an upcoming recession, there have been phases, in which the wave dropped below 50%, yet a recession did not occur. However, once the Wave dropped to levels as low as today, in 71% of observations a recession followed within the next 12 months.

What depth of the US recession should we expect?
As our Vescore models indicate a historically high recession probability, the pressing related question is how deep a US recession might be. Here we pursue an event analysis to shed light on this question by asking what happens to US GDP growth during or in the aftermath of policy tightening cycles.
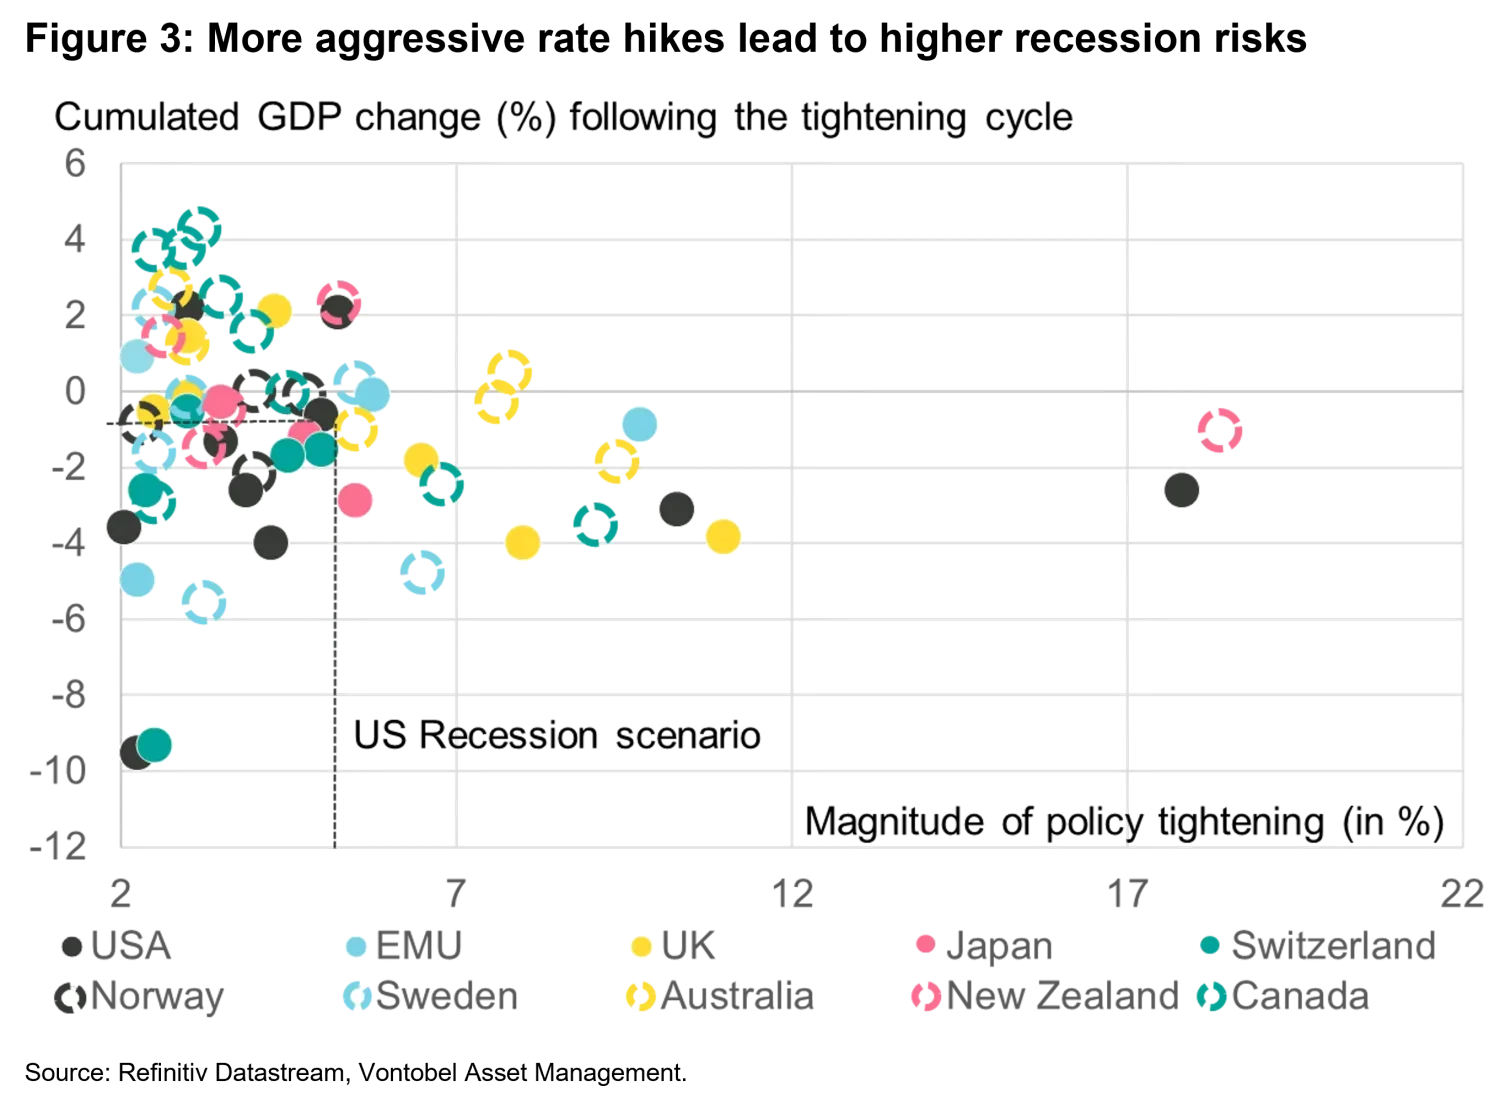
As expected, historical data since the 1950’s for 10 developed countries revealed a negative relationship between tightening cycles and GDP growth. Figure 3 shows the relationship between the magnitude of cumulated rate hikes per hiking cycle and the impact on real GDP growth during or in the aftermath of the policy cycle. For example, the US hiking cycle between 1977 and 1980 with 17.8 percentage points in cumulated rate hikes has been followed by a peak to trough GDP contraction of 2.6 percentage points between September 1981 and 1982. If history is any guide, our data sample indicates that a tightening cycle of 5 percentage points, roughly what we expect for the current Fed tightening cycle, leads to a temporary output contraction of one percentage point (dotted line). Assuming a quick policy pivot by the end of 2023 and a return to trend growth within two quarters would be in line with approximate -0.5% US real GDP growth in 2023.
Obviously, this analysis is leaving out important country specific factors such as the COVID saving buffer of households and corporates or fiscal policy effects in general. Moreover, there remains a high variability of the results for tightening cycles of up to 5% points7 But this analysis should serve well as a first approximation of what to expect for GDP growth in developed markets, depending on magnitude of rate hikes.

Methodology Figure 3
Real GDP and policy tightening cycles since the 1950’s (if data was available) have been analyzed for 10 developed countries. All policy tightening cycles with duration of at least two months and cumulative rate hikes of more than two percentage points have been considered, which brings the total number of analyzed tightening cycles to 60. To measure the impact of the tightening cycle on GDP growth, we screened the GDP development during the tightening cycle and the two years after the end of the tightening cycle. Within that period, the peak to trough GDP8 loss has been calculated. In cases in which an output loss has been avoided, the GDP change, in this case an increase, in the three quarters after the last rate hike of the cycle has been taken.
What does a recession mean for equity investors?
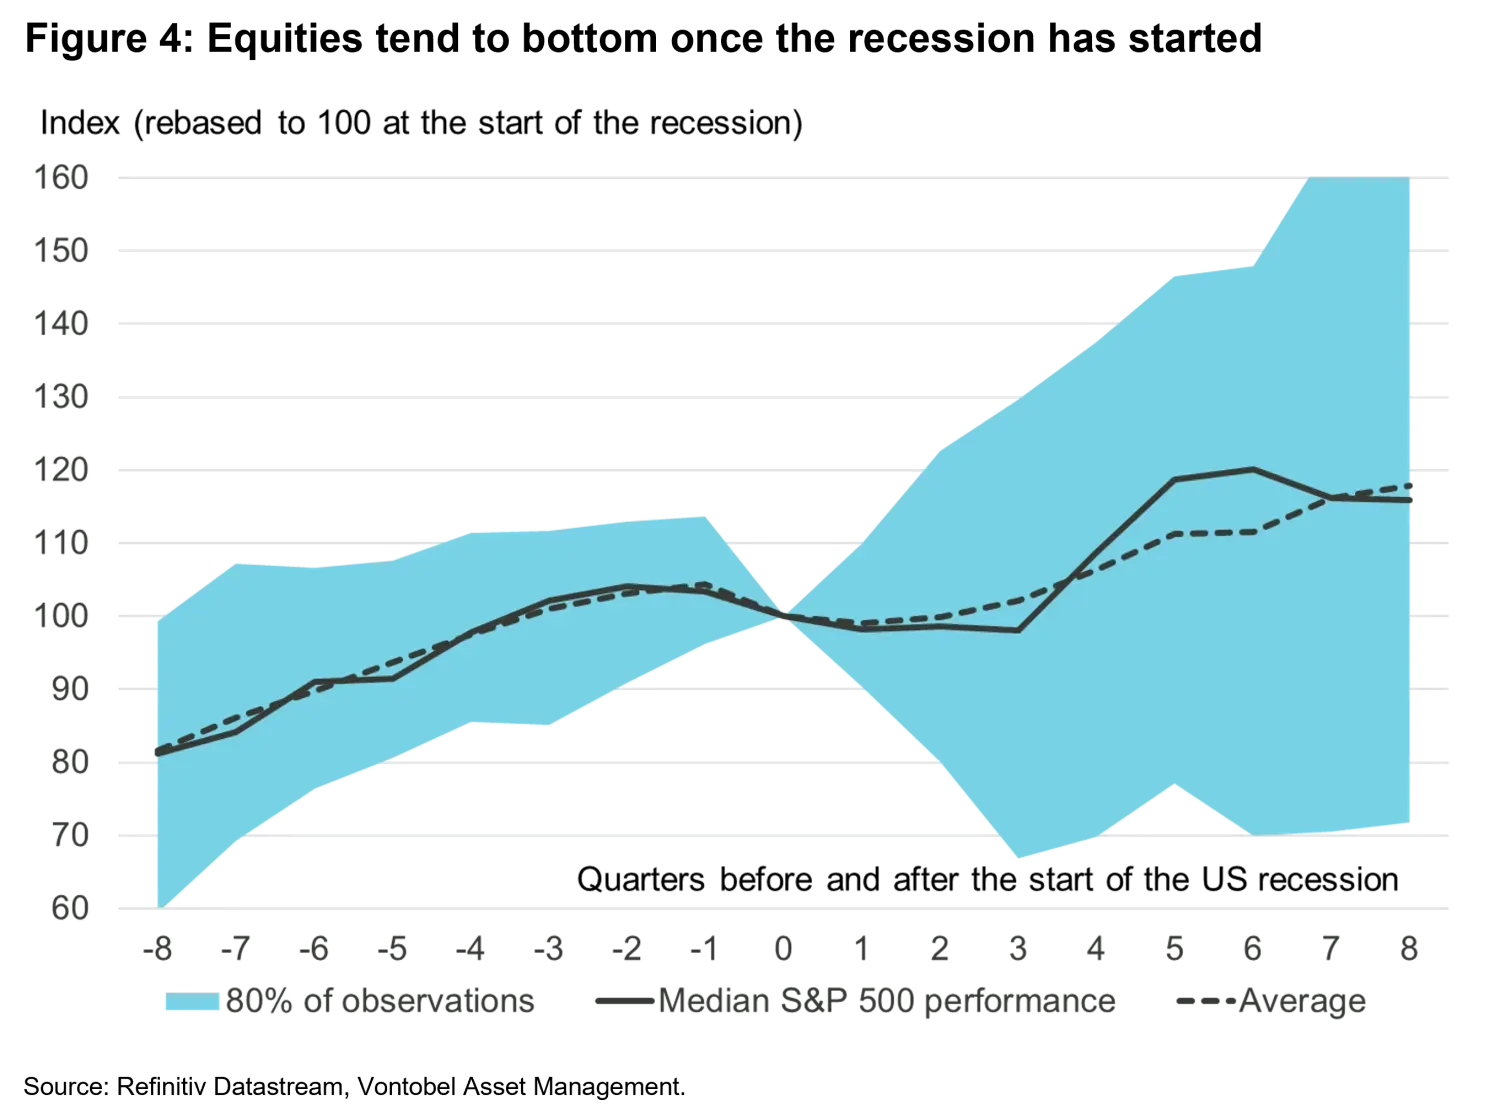
To answer this question, the S&P 500 and the NBER recession definition have been analyzed since 1900. This brings the total number of observations (US recessions) to 24. Figure 4 shows the result for the US equity market eight quarters before and after the start of these recessions.
The chart shows the median and average equity performance, rebased to the start of the recession. The shape of the line shows that the median equity market rose until two quarters prior to the recession, then fell by 5% roughly until three quarters after the recession, when it rebounded strongly until six quarters after the recession.8
In addition to the median and average performance, the blue shaded area indicates the performance range, based on 80% of observations. The shaded area shows that there have been strong outliers. Exceptions were 1918, 1926 and 1945. In these years the US equity market bottomed out well before the start of the recession. 2023 could be another exceptional year. But statistical evidence suggests, as we have highlighted in our “MAS Outlook 2023”, that investors should proceed with caution going into 2023.

1. See
Outlook 2023: Proceed with caution
.
2. Ball, L., Leigh, D. & Mishra, P. (2022). Understanding US inflation in the COVID area. Working Paper 30613, NBER 2022.
3. See
Risk Management: Forward on calm seas, adaptive and agile in stormy phases
for a model introduction.
4. See
Vescore Global Market Outlook December 2022
.
5. Huang, Y.-F. & Startz, R. (2020). Improved recession dating using stock market volatility. International Journal of Forecasting, 36 (2), 507-514.
6. The Wave is a big data-based business cycle model, processing more than 1200 time series on the global level. The percentage measures the share of indicators with positive growth momentum. A reading below 50% therefore indicated negative growth momentum for the majority of time series. As readers of Vescore publications are already familiar with the Wave concept we resist to dive deeper into the methodology. More details can be found in our white paper
The Vescore Wave – a superior business-cycle model
.
7. For policy tightening cycles of 5%-points and higher the GDP impact is mostly negative.
8. Four quarter rolling GDP has been used.
Important Information:
Past performance is not a reliable indicator of current or future performance. Indices are unmanaged; no fees or expenses are reflected; and one cannot invest directly in an index.
Any projections, forecasts or estimates contained herein are based on a variety of estimates and assumptions. There can be no assurance that estimates or assumptions regarding future financial performance of countries, markets and/or investments will prove accurate, and actual results may differ materially. The inclusion of projections or forecasts should not be regarded as an indication that Vontobel considers the projections or forecasts to be reliable predictors of future events, and they should not be relied upon as such. Diversification and/or asset allocation neither assures a profit nor eliminates the risk of investment losses.
Vontobel reserves the right to make changes and corrections to the information and opinions expressed herein at any time, without notice. This document is for information purposes only and does not constitute an offer, solicitation or recommendation to buy or sell any investment instruments, to effect any transactions or to conclude any legal act of any kind whatsoever.


