Big Data: Man and Machine as a Team in the Investment Process
Multi Asset Boutique
Big Data is everywhere. Most of the time, we are not even aware of how much this digital technology influences our daily lives. Even in the financial industry, the application of Big Data is gaining more and more influence, because the enormous amounts of data have the potential to improve the decision-making process by providing high-quality, reliable, and contextual information. Yet, interpreting the results often requires human judgment to accurately explain trends and make carefully weighed decisions. But how does the interplay between humans and technology work in the investment process? What are the benefits of using Big Data? And how can the machine's signals be put to good use?
What is Big Data?
Do you remember how, not so long ago, you used to study maps when you went on a trip by car? Back then, you had a map for just about every region in your glove compartment that you could pull out when you needed it. Today, you simply type a destination into your navigation system or cell phone app and off you go. Along the way, you then receive real-time instructions from the system, which navigates you along the fastest route to your desired destination, avoiding traffic jams and roadworks if necessary.
This rapid advancement is thanks to the widespread use and application of Big Data. Today, intelligent systems and map programs are not only replacing physical road maps; based on the data collected they are also constantly improving and can provide ever more precise information. But what exactly is Big Data?
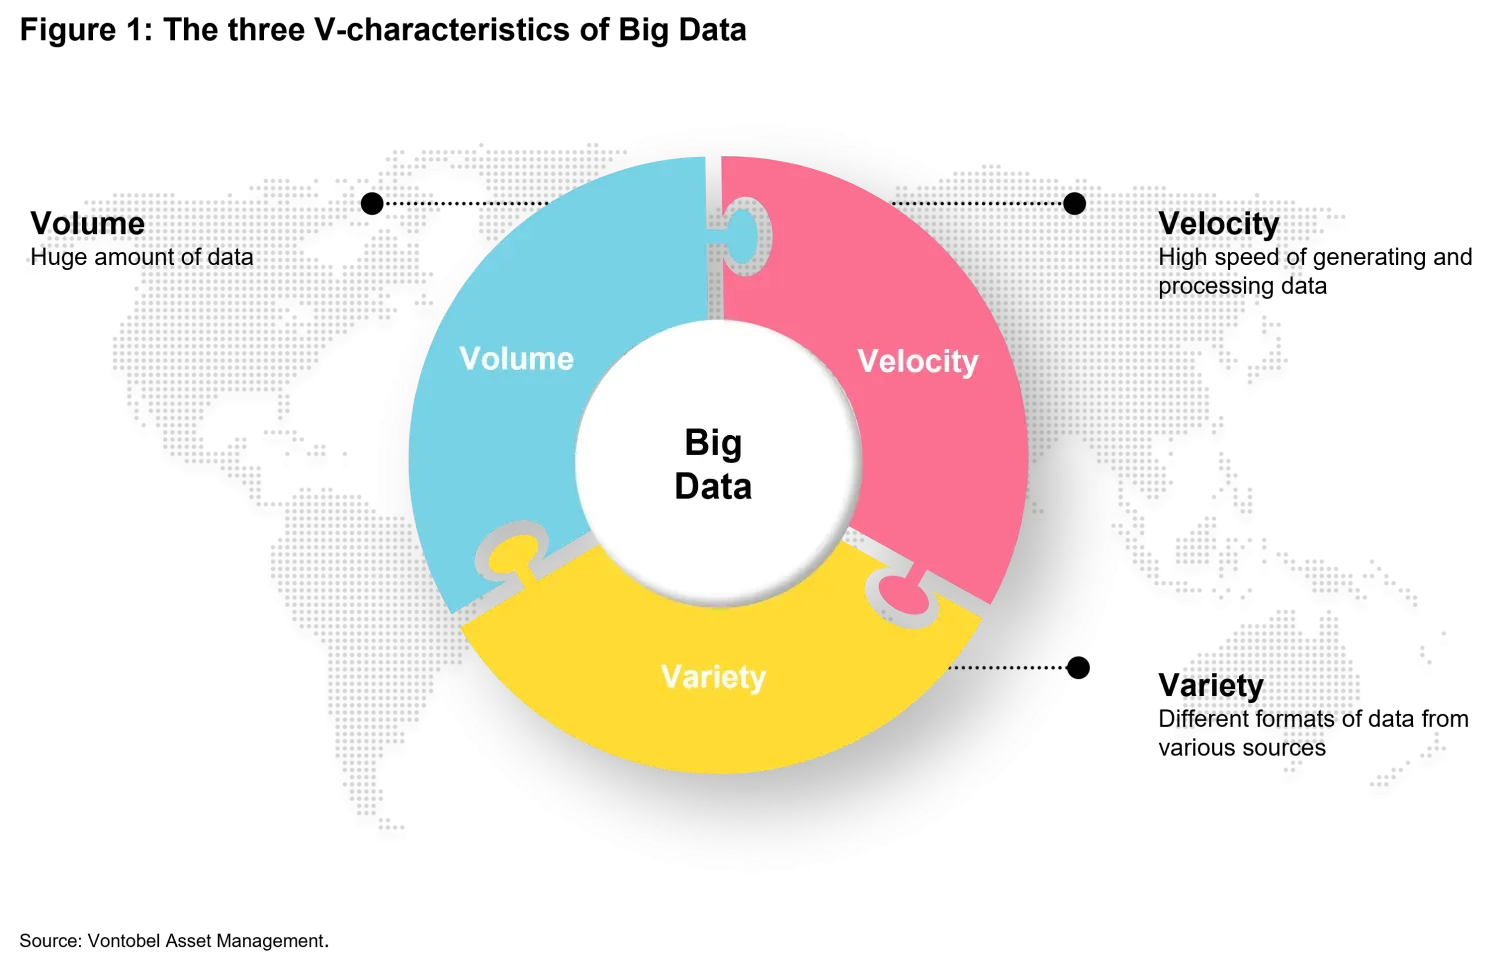
Although the term is a buzzword, its meaning remains shrouded in ambiguities. In general, Big Data describes the collection and analysis of large volumes of data sets that, due to their extreme size, place special demands on storage.1 Classical definitions2 encompass the three main characteristics of a large amount of data in heterogeneous and diverse dimensions (Volume), the speed at which the data is generated (Velocity), and the variety of data characteristics (Variety) (see Figure 1).3
Why Big Data
Big Data makes it possible to store, process and analyze large volumes of data at an unimaginable speed that is incomprehensible to humans.4 However, this requires modern methods and procedures, which are summarized under the term Big Data technologies.5 These aim to investigate complex and evolving relationships between data and to identify patterns and trends.
The advantages of using Big Data reveal themselves especially in solving complex decision-making problems that have a high demand for information.6 Due to limited sensory and cognitive capabilities, human processing capacity quickly reaches its limits when faced with the abundance and complexity of information (information overload).7 Big Data has the ability to manage this complexity, decipher unknown situations and support evidence-based decision making.
Within data-driven decision-making processes for problems that can be described mathematically, Big Data is considered an adequate solution that determines very good probabilities for trends and development patterns from a large amount of data. Moreover, the technology can detect weak signals and identify problems that would have been discovered or hidden only by chance. The analyses, which are based on data and not on emotions8, are a valuable decision-making aid and support human judgment.
Big Data in business cycle analysis
The potential of Big Data is also paying off in the financial industry. The technology can help increase accuracy in predicting relevant metrics within the investment process. This is especially true when forecasting the business cycle, which is considered key to successful market timing.9 In particular, timely and accurate information on economic developments is crucial for effective investment decisions. In this context, the state of the economy is treated as an unobservable variable that is estimated based on the development of numerous macroeconomic indicators.
The approach of estimating the unobservable variable from a large number of time series has proven useful in many forecasts.10 That's why we developed our in-house business cycle model Wave.11 Using a Big Data approach, it identifies the current stage of the business cycle for 50 countries and provides information on the most likely future stage of the economy. Our data sources, which are systematically collected and recorded, consist of more than 1,200 macroeconomically relevant indicators as well as asset prices that reflect the state of the economy.
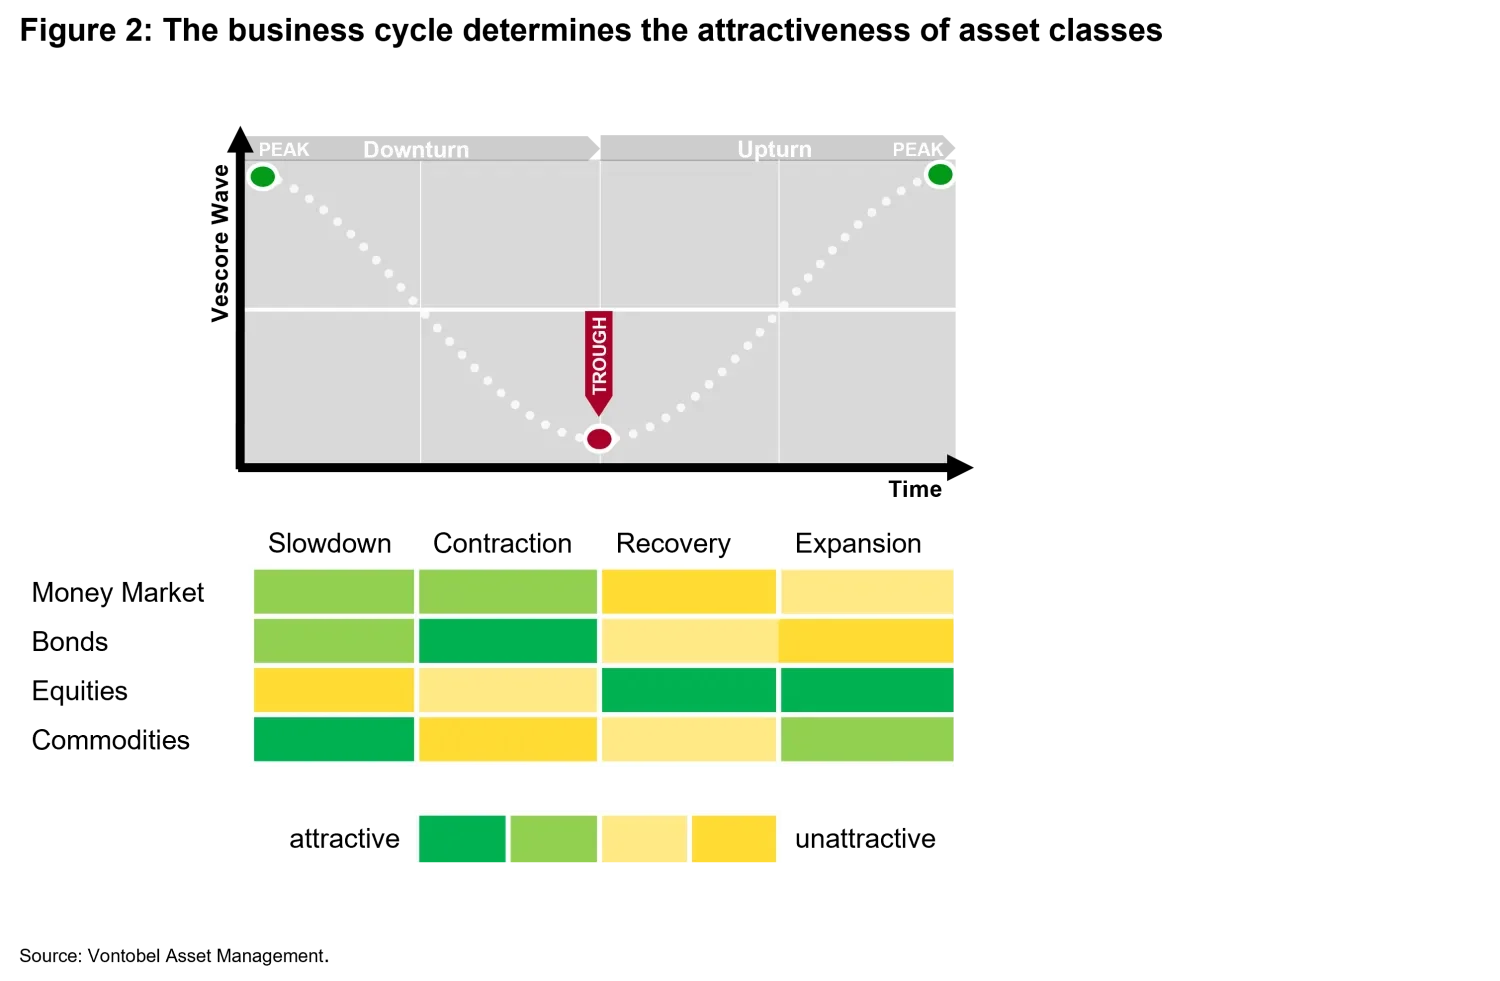
By using Big Data to process a large number of different indicators in order to identify economic turning points on the basis of their changes, the Wave can improve the potential analysis of the business cycle.12 This is particularly noticeable in asset allocation because the various asset classes develop differently depending on the stage of the business cycle.13 Therefore, a business cycle model can provide information on asset class preferences and contribute to portfolio optimization.
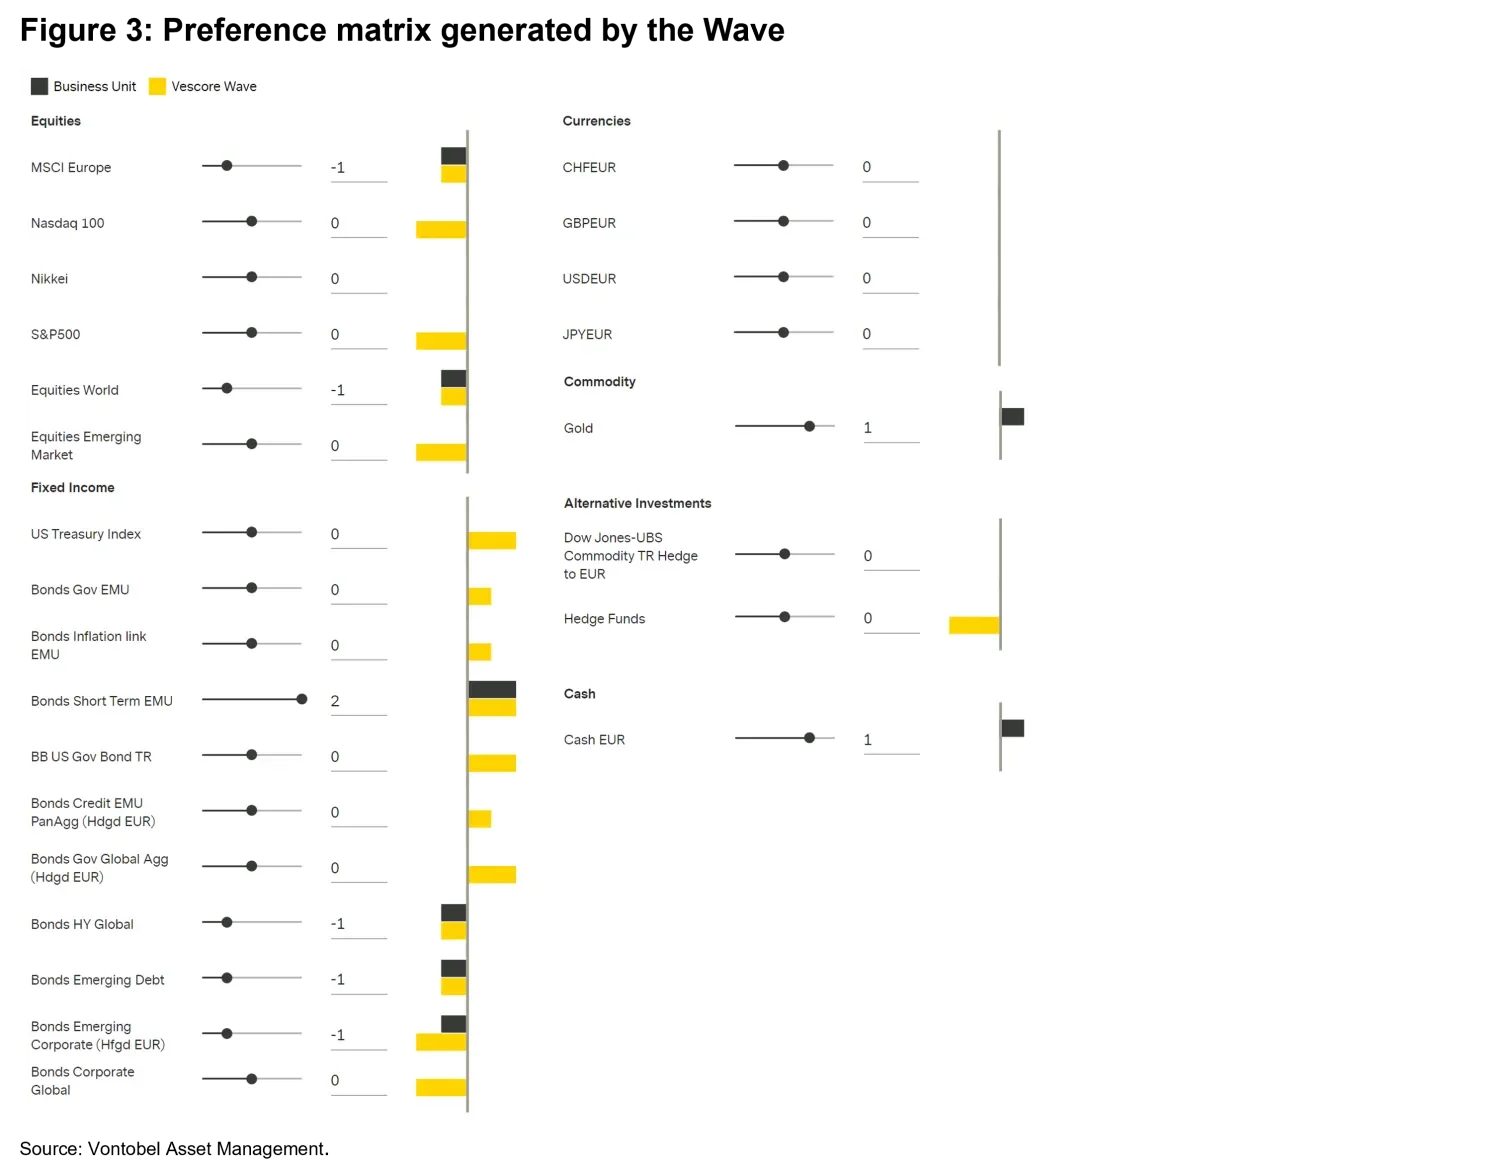
The Wave does this by deriving a preference matrix that takes into account the different phases of the business cycle. This serves as input to the Wave's portfolio optimization tool14 for optimal asset allocation. The business cycle, as well as estimates from historical data for return, volatility, and covariance, are used within the tool as a compass for optimal weighting. In addition, the client's constraints and risk aversion are taken into account to maximize the client's utility.
Man & Machine: Teamwork in the investment process
To avoid wrong conclusions, the results of the preference matrix generated by the machine have to be questioned and checked. This is where the man comes into play, as people have the unique ability to draw conclusions by means of logical thinking and reject errors which appear mathematically correct. This enables them to reflect critically and decipher unclear signals - something that the machine is often unable to do. Moreover, the human can identify various factors influencing the economy as well as external (economic) shocks that occur only rarely and are therefore underrepresented in macroeconomic data, such as the Corona pandemic.
The machine's preference matrix provides tactical guidance and serves as a valuable decision-making tool for the human in the investment process. With the help of his broad experience and technical expertise, the human analyzes the trends and development patterns that the Wave has identified. In areas where no timely or suitable indicators are available, he can fill gaps based on detailed knowledge and experience. In addition, he takes unknown parameters and various possible outcomes into account, so that many scenarios can be evaluated at once.
As a result, a comprehensive picture is drawn, which is used by the human to adjust the weightings of the asset classes where necessary. This way, an asset allocation is created within the investment process that combines the best of two worlds.
Conclusion
Big Data is worthless in a vacuum. Its potential value is only exploited when the enormous amount of information is condensed into actionable insights. If the user succeeds in processing the flood of information advantageously into new knowledge, this can open new possibilities for decision-making. The underlying idea is to combine complementary capabilities to create a system that overcomes the limitations of Big Data.
Our Big Data technology Wave is primarily designed to empower humans to make carefully considered and informed decisions. This combination creates a symbiosis that makes the machine an equal team member. The concept of this hybrid approach to the investment process aims to combine the complementary strengths of human intelligence and Big Data in the best possible way, so that they can perform better together than each can on its own.
We believe that collaboration between man and machines is not only the key to success, but also an opportunity to be seized. This is also supported by scientific studies that prove that organizations can achieve the greatest performance improvements when humans and machines work together.15
1. This definition should be distinguished from the general buzzword "Big Data," which is used in the media for a variety of other meanings.
2. Chen, H., Chiang, R. H. L. & Storey, V. C. (2012). Business intelligence and analytics: From big data to big impact. MIS Quarterly, 36(4), 1165–1188.
3. Currently, there are no universal benchmarks for volume, variety, and velocity that make up Big Data. Recently, the dimension of veracity has also been brought into focus. The question of how many V's of Big Data should be considered is controversial. Depending on the concept, however, it seems sensible to use other dimensions for characterization.
4. Saggi, M. K. & Jain, S. (2018). A survey towards an integration of big data analytics to big insights for value-creation. Info Proc Man, 54(5), 758–790.
5. Elgendy, N. & Elragal, A. (2014). Big data analytics: A literature review paper. In P. Perner (Ed.), Advances in data mining. Applications and theoretical aspects (214–227). ICDM 2014. Lecture Notes in Computer Science, 8557. Springer: Cham.
https://doi.org/10.1007/978-3-319-08976-8_16
6. Information requirements are understood as the quantity, type and quality of information needed to accomplish tasks in a given time.
7. Sammut, G. & Sartawi, M. (2012). Perspective-taking and the attribution of ignorance. Journal for the Theory of Social Behaviour, 42(2), 181–200.
8. Dorschel, J. (2015). Einführung und Überblick. Praxishandbuch Big Data. Springer, Wiesbaden, 5–14.
9.
https://am.vontobel.com/insights/the-business-cycle-as-the-key-to-successful-investment-decisions
10. Stock, J.H. & Watson, M.W. (2002a). Forecasting Using Principal Components from a large number of predictors. Journal of the American Statistical Association, 97, 1167-1179; Stock, J.H. & Watson, M.W. (2006). Forecasting with Many Predictors. In G. Elliott, C. Granger & A. Timmermann (ed.), Handbook of Economic Forecasting (515-554), 1, Amsterdam: Elsevier; Giannone, D., Reichlin, L. & Small, D. (2008). Nowcasting: The Real-Time Informational Content of Macroeconomic Data. Journal of Monetary Economics, 55(4), 665-676.
11.
https://am.vontobel.com/insights/the-vescore-wave-a-superior-business-cycle-model
12. Many other business cycle models use only a few key factors to determine the future course of the economy. In the long term, it has been shown that the Wave performs better on average in forecasting economic phases and also in anticipating turning points in the business cycle than the usual leading indicators, which it runs ahead of by around one month.
13.
https://am.vontobel.com/insights/the-business-cycle-as-the-key-to-successful-investment-decisions
14. The portfolio optimization tool is used to select the proportions of different assets in a portfolio. The goal is to maximize the risk-adjusted return by using a comprehensive set of portfolio optimization and analysis tools to perform capital allocation, asset allocation, and risk assessment. In addition, the optimizer provides a backtesting framework to backtest portfolio allocation strategies and an extensive performance analysis suite.
15. Wilson, H. & Daugherty, P. R. (2018). Collaborative intelligence: humans and AI are joining forces. Harvard Business Review, 96, 114-123.
Important Information:
Past performance is not a reliable indicator of current or future performance. Indices are unmanaged; no fees or expenses are reflected; and one cannot invest directly in an index.
Any projections, forecasts or estimates contained herein are based on a variety of estimates and assumptions. There can be no assurance that estimates or assumptions regarding future financial performance of countries, markets and/or investments will prove accurate, and actual results may differ materially. The inclusion of projections or forecasts should not be regarded as an indication that Vontobel considers the projections or forecasts to be reliable predictors of future events, and they should not be relied upon as such. Diversification and/or asset allocation neither assures a profit nor eliminates the risk of investment losses.
Vontobel reserves the right to make changes and corrections to the information and opinions expressed herein at any time, without notice. This document is for information purposes only and does not constitute an offer, solicitation or recommendation to buy or sell any investment instruments, to effect any transactions or to conclude any legal act of any kind whatsoever.
Read next:
2026 Large Language Models OutlookRelated insights

2026 Large Language Models Outlook

2026: Multi Asset Reloaded - Investors (Still) Need Diversification

Global rates: a mirage of diversification

The signals beneath the surface

When Many Own the Same Few
