The top 2%
Multi Asset Boutique
In a recent data analysis project during my summer internship at Vontobel, we examined the results of a backtest of an AI-Powered equities model. The model is based on Gradient Boosted Trees, a machine learning technique that builds an ensemble of decision trees to improve prediction accuracy through iterative learning. For the avid reader we have a more rigorous explanation in a previous article of our expl(AI)ning series.
Goal
The goal of the analysis was to evaluate how the model’s predictive performance varies across different market conditions, considering factors such as region, market concentration, and market dispersion. To evaluate performance, we used the metrics hit rate (aka precision) and excess returns.
To conduct the analysis, we first performed a backtest of the model using the MSCI ACWI universe as playground. The target of the optimization for the model is to learn the future one year ranking of the universe constituents based on excess returns with respect to the index. The model was trained using an expanding window approach and measures were taken to prevent forward-looking bias. Concretely, at a given month t, we trained on all data points up to t – 12 months (which is the forecasting horizon length) and therefore held out the most recent year to avoid forward leaking information. We then scored the out-of-sample data at time t. At t + 1 we appended the newly observed month and repeated, so the training window expanded over time. In each of these months, the model was used to rank all companies in the universe based on their predicted one year out excess returns. We then selected the top 2% of stocks based on the rankings (on average 50 companies) and conducted the analysis.
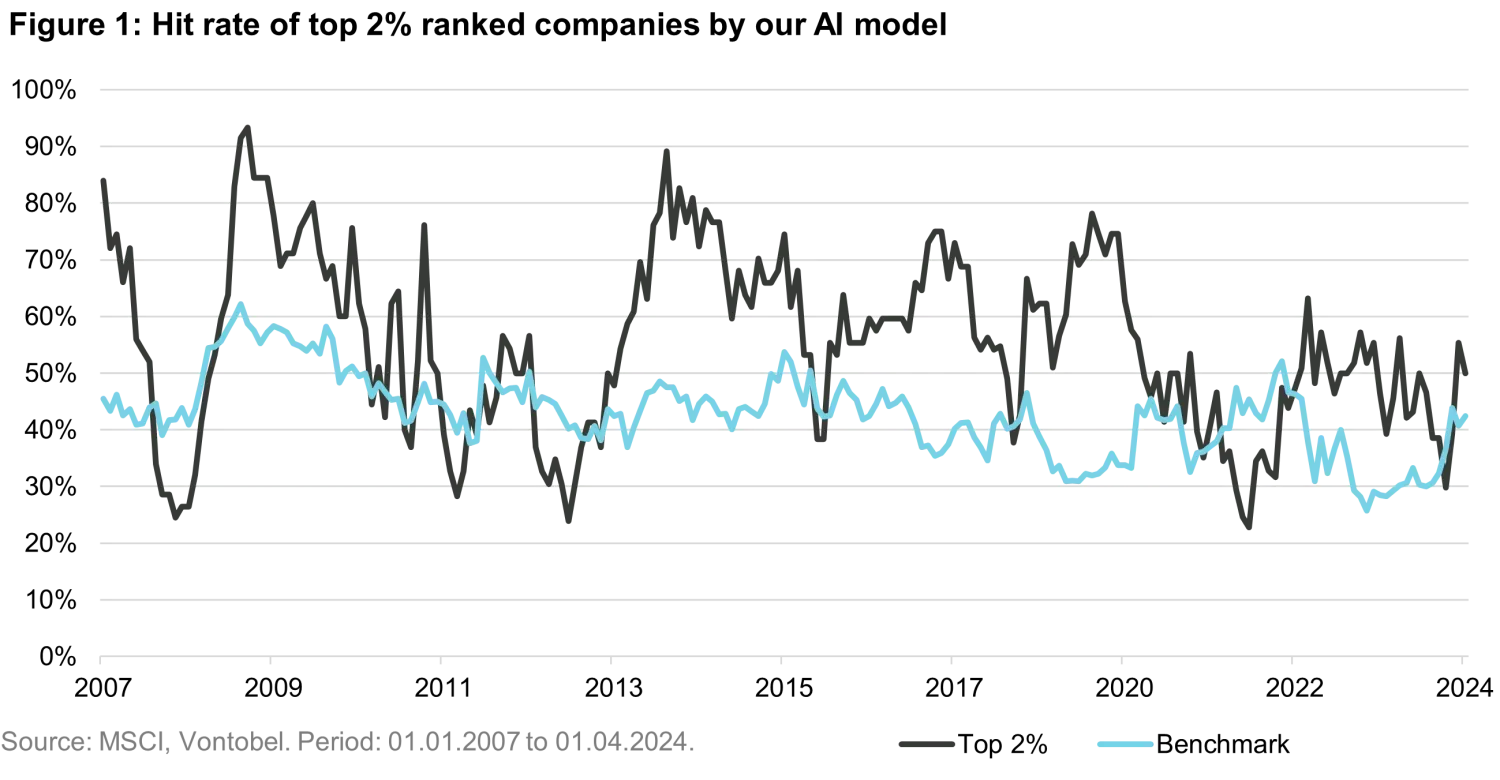
Hit rate
As an initial evaluation, we examined how the model’s hit rate evolved over time. The hit rate measures the proportion of selected stocks that achieved positive excess returns over the forecast horizon. This metric treats each stock equally - as it is applied as an equal-weight lens that isolates the model’s predictive performance. We compared this metric against the benchmark index. Interestingly, the hit rate for the index is not 50%, as one might intuitively expect. This is due to market concentration and that the benchmark index is market cap weighted, not equal weighted. E.g. in periods where only a few companies drive most of the returns, a significant number of stocks underperform the index.
Figure 1 shows that our model’s hit rate outperformed that of the average stock in the benchmark index across most periods in the backtest.
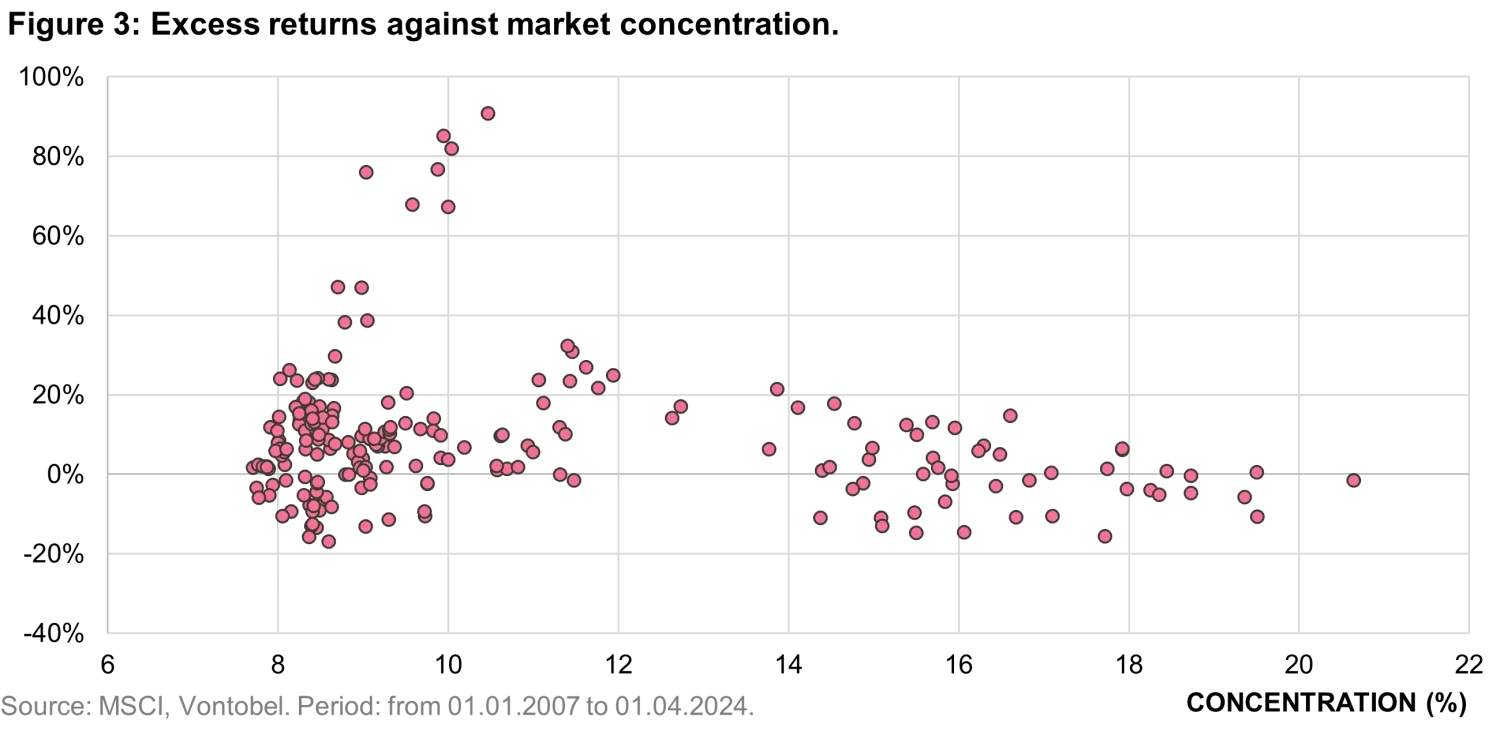
Market concentration
Why concentration matters: When a few mega-caps dominate a cap-weighted index’s gains, market breadth shrinks. The results are that more stocks underperform the benchmark, and active selection becomes harder. Figure 2 shows that the combined market weight of the top ten companies in the MSCI ACWI has risen steadily over the past decade, underscoring the growing dominance of a few names in driving index performance.

To explore the impact of market concentration on model performance, we calculated the excess returns of a simulated portfolio - a basket of approximately 50 stocks -corresponding to the top 2% of model-ranked companies each month. For each basket, we projected one year forward to observe the realized excess returns, averaging these to obtain monthly data points. These monthly averages are represented in Figure 3, where we observe a clear trend: although the model outperforms the average stock in the index (as shown in Figure 1), rising market concentration makes it increasingly challenging to identify the right stocks.
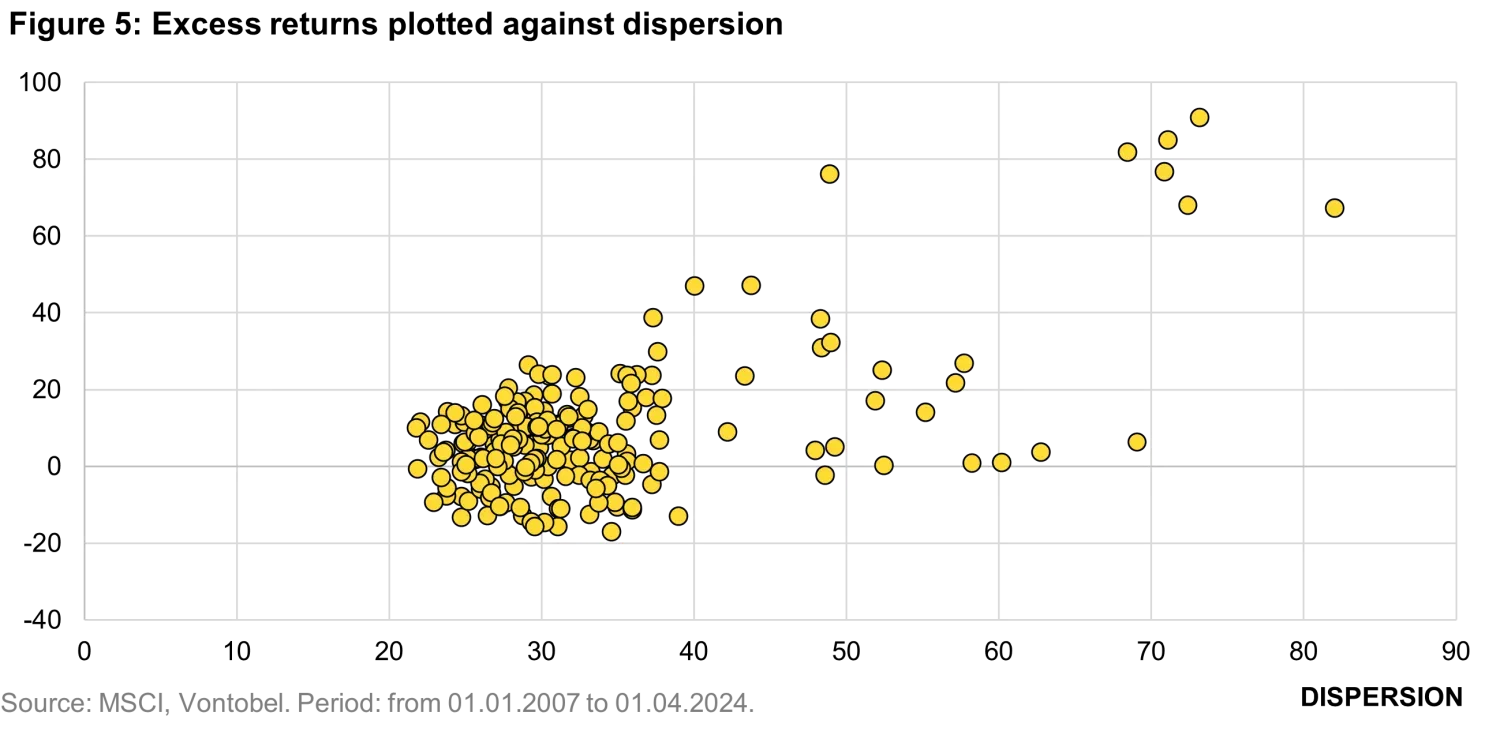
Market dispersion
Another important factor influencing the ability of active strategies to outperform is market dispersion. When dispersion is low, there are fewer performance outliers—making it more difficult for active managers to identify stocks that significantly outperform the average, especially when concentration is high. To quantify this, we calculated dispersion as the equally weighted standard deviation of stock returns1 within the universe:

Where M is the average return, r_i is the return of each individual stock and N corresponds to the number of stocks in the universe. In Figure 4 we show that over the past four years, return dispersion has been relatively low, resulting in more uniform performance across most stocks.

Like the recent shift in market concentration, we observe signs that this trend may now be starting to reverse. Taken together, both indicators—dispersion and concentration—could play a key role in shaping the model’s ability to generate excess returns in the near- and longer-term future.
To assess how dispersion affects model performance, we replicated the concentration exercise: each month we formed a basket of the top 2% ranked stocks, computed its one-year forward excess return, and plotted those outcomes against the contemporaneous level of dispersion. As intuition suggests, higher dispersion increases the opportunity set for selection alpha—and Figure 5 confirms this pattern: the model’s excess returns tend to be higher when dispersion is elevated.
Conclusion
The results of our analysis provide further indications that our AI-powered stock selection model demonstrates robust performance across a variety of market environments. Its consistently high hit rate over the past two decades, even during periods of rising market concentration and declining dispersion, highlights the model’s ability to navigate challenging conditions where many active strategies tend to struggle. Unlike traditional factor approaches with fixed exposures—or discretionary management reliant on human judgment—our AI-powered process is adaptive, repeatable and unemotional: it continuously re-estimates relationships using an expanding set of data and updates signals as market leadership rotates, delivering consistent, unbiased implementation across the full universe.
Important Information: The content is created by a company within the Vontobel Group (“Vontobel”) for institutional clients and is intended for informational and educational purposes only. Views expressed herein are those of the authors and may or may not be shared across Vontobel. Content should not be deemed or relied upon for investment, accounting, legal or tax advice. Diversification does not ensure a profit or guarantee against loss. Vontobel makes no express or implied representations about the accuracy or completeness of this information, and the reader assumes any risks associated with relying on this information for any purpose. Vontobel neither endorses nor is endorsed by any mentioned sources. This material may contain forward-looking statements, which are based on historical data, models, and assumptions that may not fully reflect future outcomes. Predictions are subject to uncertainty and contingencies outside of Vontobel's control. Recipients should not place undue reliance upon these forward-looking statements as they are subject to various factors, including changes in external conditions, unforeseen events, and the accuracy of input data. There is no guarantee that Vontobel will meet its stated goals. Past performance is not indicative of future results. Investment involves risk, losses may be made. The term "AI System" and “Our AI" as used herein stands generically for a theoretical view of AI by Vontobel, and is used to illustrate how Vontobel approaches the topics discussed. The methods and models as described do not refer to any strategy offered, and the content should not be understood as a description of any models and methods currently used by Vontobel. MSCI Inc’s data and analytics were used in preparation of this information for illustrative purposes only. Copyright 2025 MSCI, Inc. All rights reserved. While the information herein was obtained from or based upon sources believed by the author(s) to be reliable, Vontobel has not independently verified the information and provides no assurance as to its accuracy, reliability, suitability or completeness.

Related insights

2026 Large Language Models Outlook

2026: Multi Asset Reloaded - Investors (Still) Need Diversification

Quant 2.0 - The AI Revolution

Global rates: a mirage of diversification

The signals beneath the surface
