Global rates: a mirage of diversification
Multi Asset Boutique
Introduction
Global bond investors often assume that spreading exposures across countries delivers meaningful diversification. Different business cycles, policy regimes, and fiscal dynamics should, in theory, produce differentiated interest rate paths. This belief was reinforced by what happened in 2022, when interest rate hikes and de-globalization brought back monetary policy cycles driven by individual country economics rather than global trends. However, the promise of geographic diversification in interest rates has increasingly become a mirage. Over the past decade, and even more so after the end of Zero Interest Rate Policy (ZIRP), developed market yields have moved in near lockstep, with emerging markets offering only slightly more breathing room. The apparent breadth of the global sovereign universe hides a surprisingly narrow set of underlying risk factors.
This raises two practical questions for investors: Why are correlations so high, and what should they do about it? First, yes, rates co-move because inflation cycles, central-bank reactions, and global term-premium spillovers have become deeply synchronized. But investors can still extract diversification through systematic signals, curve dynamics, and risk-premia variation. Second, yes, post-ZIRP the dimensionality of rates has fallen further. But this only increases the relative value of FX, which remains far more heterogeneous. And third, while the global rate factor is inescapable, investors are not powerless: diversification must come from models, not maps.
In this Quanta Byte, we examine just how correlated global rates really are, and outline what that means for building portfolios in a world where geographical diversification is no longer enough.
Measuring diversification
Before we jump in, we need to decide on a meaningful way to measure diversification in rates markets. A candidate is the so-called effective dimensionality of the covariance matrix of (one-month) yield changes. While its mathematical definition goes beyond the scope of this piece, its interpretation is quite intuitive: given a universe of assets, it gives us the effective number of independent bets we can make. For a set of n markets, the effective dimensionality can be as high as n, indicating perfect diversification, and as low as 1, corresponding to no diversification potential at all. Examining this number helps us understand the mirage of diversification: if ten markets are driven by only one or two underlying forces, then you don’t have ten bets, but indeed only one or two.
While the effective dimensionality can tell us how much diversification to expect, clustering may help us understand the structure of dependencies – which markets move closer to one another and which may help add the most diversification.
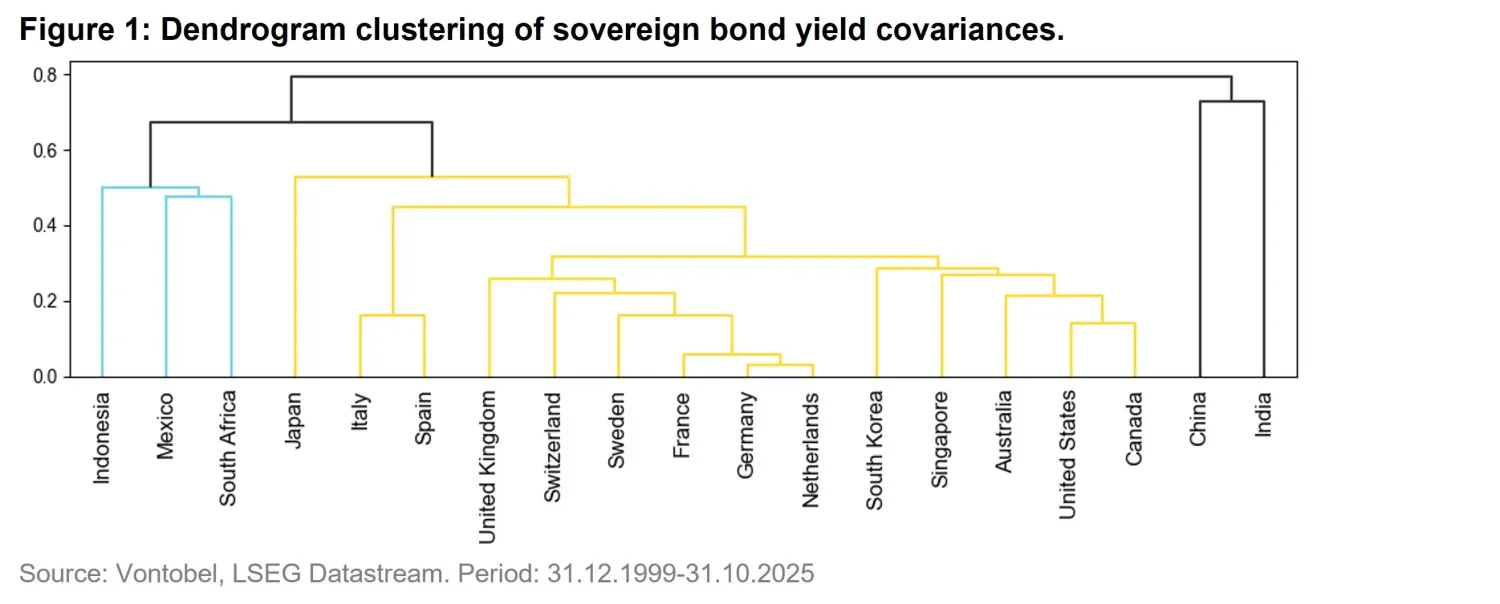
It is intuitive that interest rates - particularly in developed markets - tend to move in a somewhat synchronized manner: given that we live in a world of globalized trade, it should be no surprise that growth expectations (one of the drivers of long-term interest rates) are largely in sync, and with them the long-term interest rates. Moreover, if inflation overshoots, say, because of an energy supply shock, this is likely to affect many markets at once. The most prominent factor to counteract this synchronization is – as we’ve seen in Japan for the better part of the last decade – explicit intervention by central banks. This intuition is largely confirmed by Figure 1, which shows the dendrogram obtained by clustering global rates markets using their one-month correlations.
Dendrograms are read from bottom to top, where the lowest branches represent pairs of objects that behave similarly. One can see developed markets forming two clusters, alongside three outliers: the “Bund” cluster emerges from the middle group of yellow lines, revolving around German rates, and so does the “US Treasuries” cluster, formed with the right side of the yellow lines, which also includes several APAC countries. Of the three outliers, Italy and Spain may come as a surprise: while they share their central bank with several countries from the “Bund” cluster, their correlation is quite low, owing to a decade-long uncertainty regarding governments, budgets, and credit ratings. This is in contrast to Japan, which has seen lots of central bank interventions and therefore shows rather low correlation to the global rate cycles.
Counting independent bets
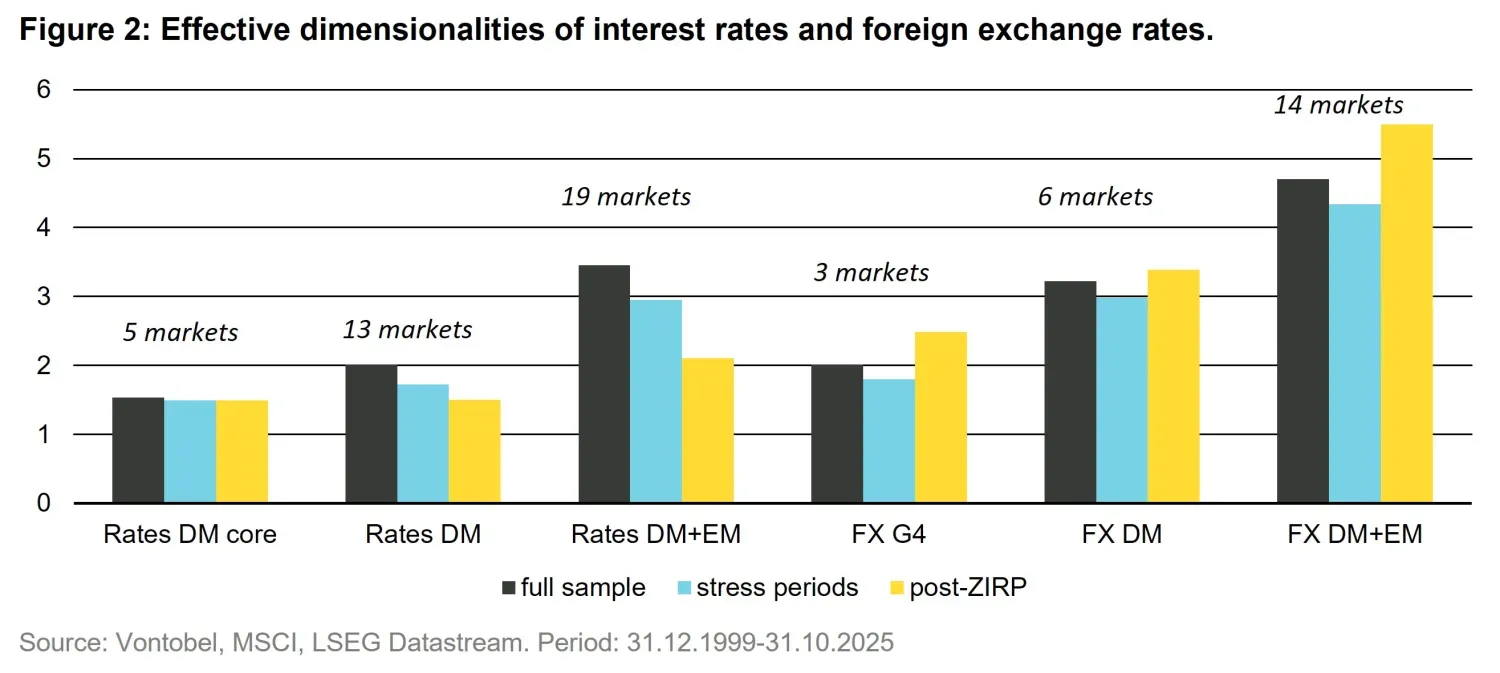
We now turn to the key results of this analysis: how many effective dimensions truly drive rates markets. To this end, we build three subsets of markets: DM core, consisting of Germany, the US, Australia, the UK and Japan, DM, which adds all other developed countries to arrive at 13 markets in total, as well as DM+EM which, by including six emerging markets brings the count to 19 countries. The left half of Figure 2 shows the effective dimensionalities for these sets of markets. In the whole sample, our core markets in fact only offer 1.5 independent bets – in essence, that’s one global interest rate risk factor plus some idiosyncrasies. Expanding the investment universe to include more DM and even EM sovereign markets appears to increase dimensionality, but only modestly. Much of the additional variation stems from credit and idiosyncratic macro risk rather than from independent rate cycles. More importantly, one must go very deep into the EM universe to add incrementally small diversification benefits, because all of the DM universe only yields two independent bets. To make matters worse, we observe that, as expected, the effective dimensionality goes down in periods of market stress (defined as the MSCI World trading below its 200-day average), giving the investor more concentration when plurality is needed.
What lies ahead?
The sudden surge in inflation in 2022 and the ensuing jump in interest rates brought an end to the four-decade downward trend in rates, as well as to the Zero-Interest-Rate-Policy (ZIRP) era. This naturally raises the question of how rate market diversification has performed since - and the answer is: poorly. As one can see in Figure 2, post-ZIRP effective dimensionalities of rates markets have gone down across the board. After a steep rise of rates across most markets in 2022, all eyes are now on the political uncertainty, which always may have spillover effects everywhere. The right side of the chart shows the same metric for FX markets which we discuss next.
Diversification in FX
Let’s put these results into perspective: in a globalized world, how much diversification is truly possible? FX markets suggest the answer is considerably more than what rates offer. If we look at various currencies versus the Euro, we find that even within a very narrow G4 universe (USD/EUR, GBP/EUR, JPY/EUR), FX returns show higher effective dimensionality than the full global DM interest rate complex, as depicted on the right half of Figure 2. And in recent (post-ZIRP) years, the diversification potential of FX has gone up, so much so that the effective dimensionality of the G4 FX markets has overtaken that of the DM+EM rates universe.
Why do three FX pairs provide more diversified bets than 19 bond markets? Generally speaking, that is because foreign exchange is relative by nature, whereas interest rates are absolute: FX is driven by short term rate differentials, terms of trade, or (dis-)parity in purchasing power It is no surprise, then, that exchange rates behave far more heterogeneously across markets.
This comparison highlights that the scarcity of diversification is not an intrinsic feature of macro markets in general: it is a distinctive feature of global rates - and is otherwise seen to this degree only in equities.
Investor take-aways
Given the structural nature of the global interest rate factor, a global allocator can draw three conclusions:
1. Embrace the global interest rate factor
Rather than attempting to diversify it away, one can view the global rate factor as a primary driver of returns and risk, for instance in an active multi-asset context, where a global split say between an equity and fixed income allocation is made.
2. FX is a genuine diversifier
We have seen how exchange rates show a significantly more nuanced movement between the underlying markets. Hence, foreign exchange rates should not only be seen as a risk to be hedged away, but as a driver of diversification in an active setup.
3. Diversify models, not markets
We have shown that in the greater scheme of things, interest rates tend to move in tandem over time. Does that mean that all markets are alike? No. Risk premia such as carry, value and momentum offer meaningfully different behavior across markets even when the underlying yield curves co-move. Diversification across models or styles merits a separate discussion, but the core point is straightforward: a multi-model quantitative framework can deliver more robust uncorrelated returns than merely expanding the country set. It does so by drawing on heterogeneity in signal construction, learning dynamics, and regime sensitivities - sources of diversification that go well beyond geography.
Stepping back from the details, the picture that emerges is clear: The global interest rate factor is alive and well. The global sovereign bond market may be vast in size but narrow in dimensionality, leading to unexpectedly stiff challenges for diversification, even if an investor takes up the challenge to go a long way in emerging markets. And in an environment shaped by tariff tensions, contested central-bank independence, and moving inflation anchors, that challenge has only intensified. For investors, the implication is clear: genuine diversification requires going outside the confines of global rates - towards FX exposures, alternative risk premia, and quantitative model-driven strategies that diversify by design rather than by geography.
Read next:
2026 Large Language Models OutlookRelated insights

2026 Large Language Models Outlook

2026: Multi Asset Reloaded - Investors (Still) Need Diversification

Quant 2.0 - The AI Revolution

The signals beneath the surface

When Many Own the Same Few
