When Many Own the Same Few
Multi Asset Boutique
At first glance, the S&P 500 appears to embody diversification. It holds 500 companies that collectively represent almost every corner of the U.S. economy — from consumer goods to biotechnology, from energy to software. For many investors around the world, it is the benchmark for equity exposure.
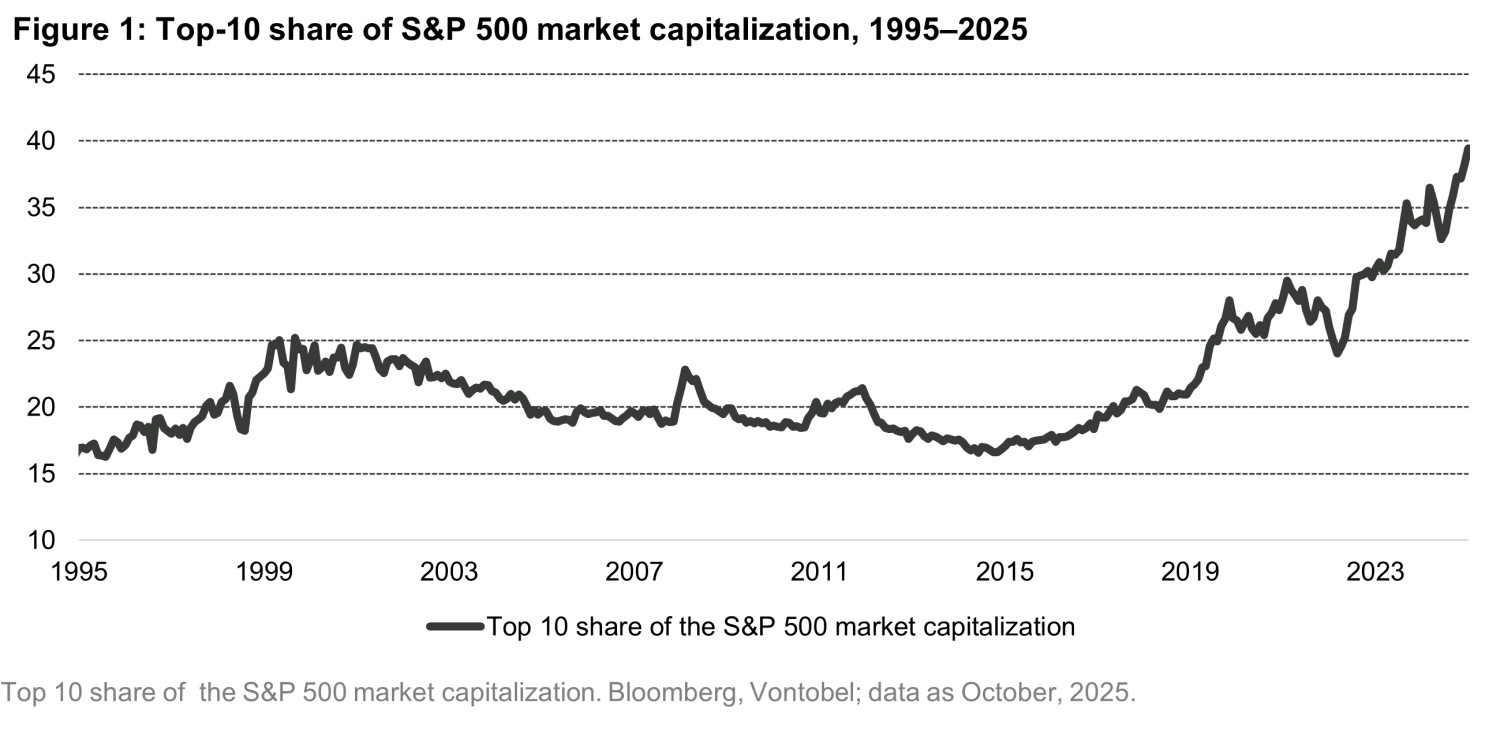
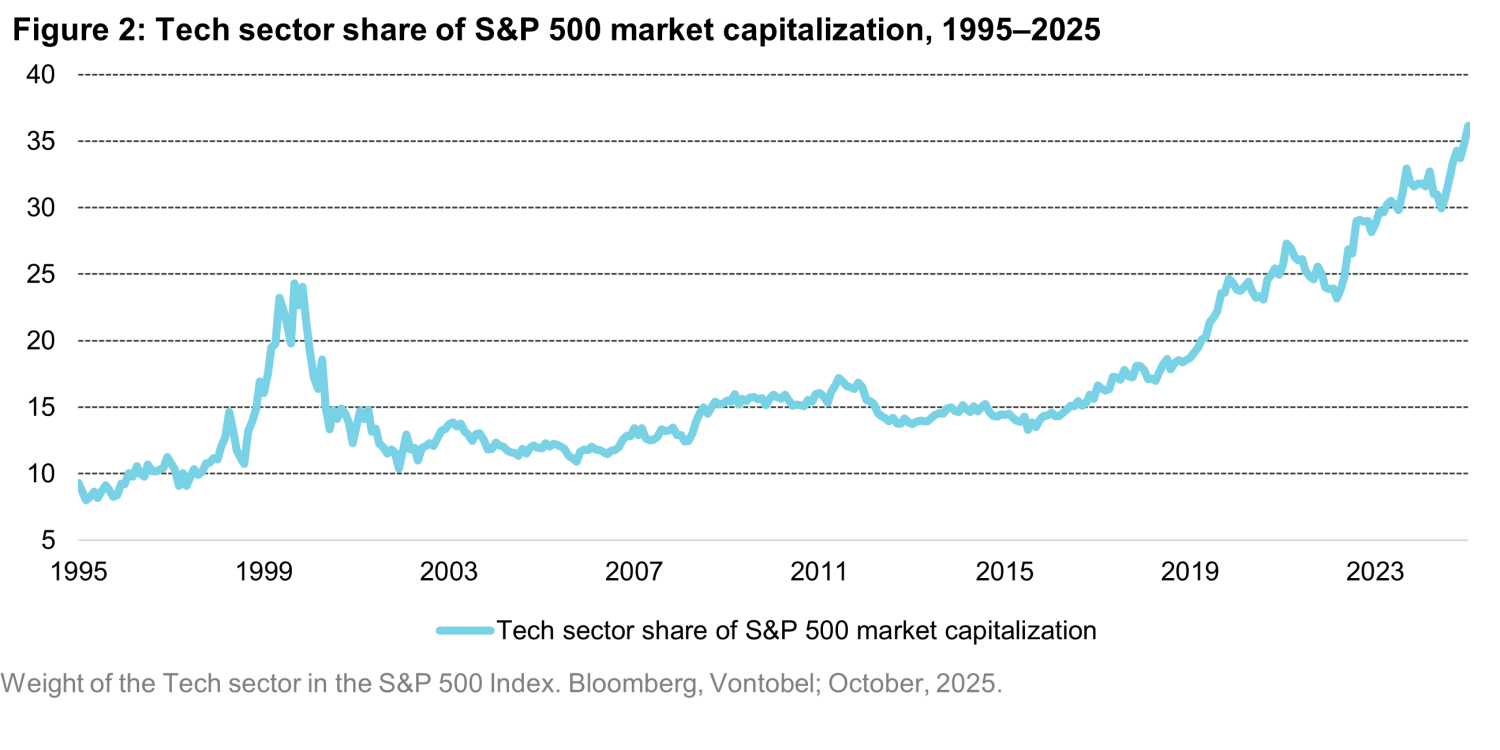
But beneath this apparent breadth, the market has quietly grown narrower than at any time in the last 30 years. As shown in Figure 1, the ten largest companies — led by familiar technology names — now represent almost 40% of the entire index’s market capitalization, double their share just ten years ago. Technology alone accounts for more than 30% of the S&P 500, a concentration level unseen even during the dot-com boom of the early 2000s1.
Why does this matter? Because when a few stocks dominate an index, the fortunes of the “many” start to depend on the “few.” The index still contains 500 companies, but its performance is effectively determined by a handful of giants. This imbalance is not necessarily a bubble — but it is a sign of fragility.
Part of the explanation lies in how money now flows. The rise of passive investing — through index funds and exchange-traded funds (ETFs) — has transformed the structure of markets. These vehicles automatically buy shares in proportion to a company’s size, regardless of valuation or fundamentals. As the biggest companies rise, they attract even more inflows, further increasing their size in a self-reinforcing loop. The result is a market that looks diversified on paper, but in practice is dominated by a small cluster of mega-cap leaders2.
History shows that extreme concentration rarely lasts forever. Similar patterns were seen in the “Nifty Fifty” era of the 1970s and again during the dot-com bubble. In both cases, the largest and most admired stocks eventually suffered large drawdowns, while previously overlooked areas of the market recovered. The challenge is not predicting when that rotation will happen — but preparing portfolios so that they can withstand it when it does.
A wide Index, a narrow market
To understand concentration, it helps to translate a few technical ideas into plain language. One common measure, the Herfindahl-Hirschman Index (HHI)3 adds up the squared market shares of all companies in an index. In a monopoly, where one firm holds everything, the HHI is 10,000. In a perfectly diversified market, it is close to zero. For the S&P 500, the figure currently stands near 200 — which sounds low but represents a historic high by market standards.
The key is not the absolute number but its change over time. Twenty years ago, the index’s HHI was roughly 120. The rise since then means that today’s market is more than 60% more concentrated than it was around the dot-com peak.
Other, simpler indicators tell the same story.
- The gap between the cap-weighted and the equal-weighted versions of the S&P 500 has widened sharply, reflecting how mostly the largest names have driven returns.
- The share of index members trading above their 200-day moving average — a measure of market “breadth” — has narrowed to multi-year lows.
- The top sector, technology, now exceeds the combined weight of the next three largest sectors, accounting for an overall weight of roughly 35%.
On this last indicator, much of the current market narrative justifies the technology sector’s outsized weight through the lens of Artificial Intelligence (AI) - a theme widely viewed as transformative for both the economy and society. We fully acknowledge that AI represents a genuine technological revolution with far-reaching implications. Yet, its promise has also fueled an unprecedented concentration within equity markets, with investors crowding into a narrow group of perceived beneficiaries. As a result, the technology sector’s dominance has reached levels unseen in the past three decades, as shown in Figure 2.
Why is this a concern? Because concentration changes the way risk moves through markets. When leadership narrows, small idiosyncratic shocks can reverberate more widely. A disappointing earnings release or regulatory headline in a single mega-cap can trigger selling across the entire index, not because fundamentals have changed elsewhere, but because index funds mechanically rebalance and algorithms respond to correlated moves.
This feedback loop can create volatility spikes that seem disconnected from macroeconomic news. It also explains why the same events now move markets faster and more uniformly than in the past. What looks like “systemic risk” is often, in fact, structural concentration risk.
What history teaches
Periods of narrow market leadership are not new — but their outcomes tend to rhyme.
During the early 1970s, investors crowded into a select group of large, steady-growth companies known as the “Nifty Fifty.” These firms were seen as “one-decision” stocks that could be bought and held forever. When inflation surged and monetary policy tightened, their valuations proved vulnerable. From 1973 to 1974, the S&P 500 fell nearly 40%, while many Nifty Fifty names lost more than half their value — a decade passed before they regained previous peaks.
A similar pattern re-emerged during the technology boom of the late 1990s. The combined weight of Microsoft, Intel, Cisco and a handful of peers pushed market concentration to then-record highs. The Herfindahl-Hirschman Index for the S&P 500 more than doubled between 1995 and 2000, peaking just months before the bubble burst. When the cycle turned, the index dropped ~50% and sector leadership flipped dramatically: energy, industrials and financials replaced technology as the main return drivers for years.
The Global Financial Crisis of 2008 followed the same rhythm from a different source. Then, the dominance came from financials rather than technology. At the 2006–07 peak, banks and real-estate firms made up over 25% of the S&P 500. When the credit cycle snapped, those exposures amplified the drawdown.
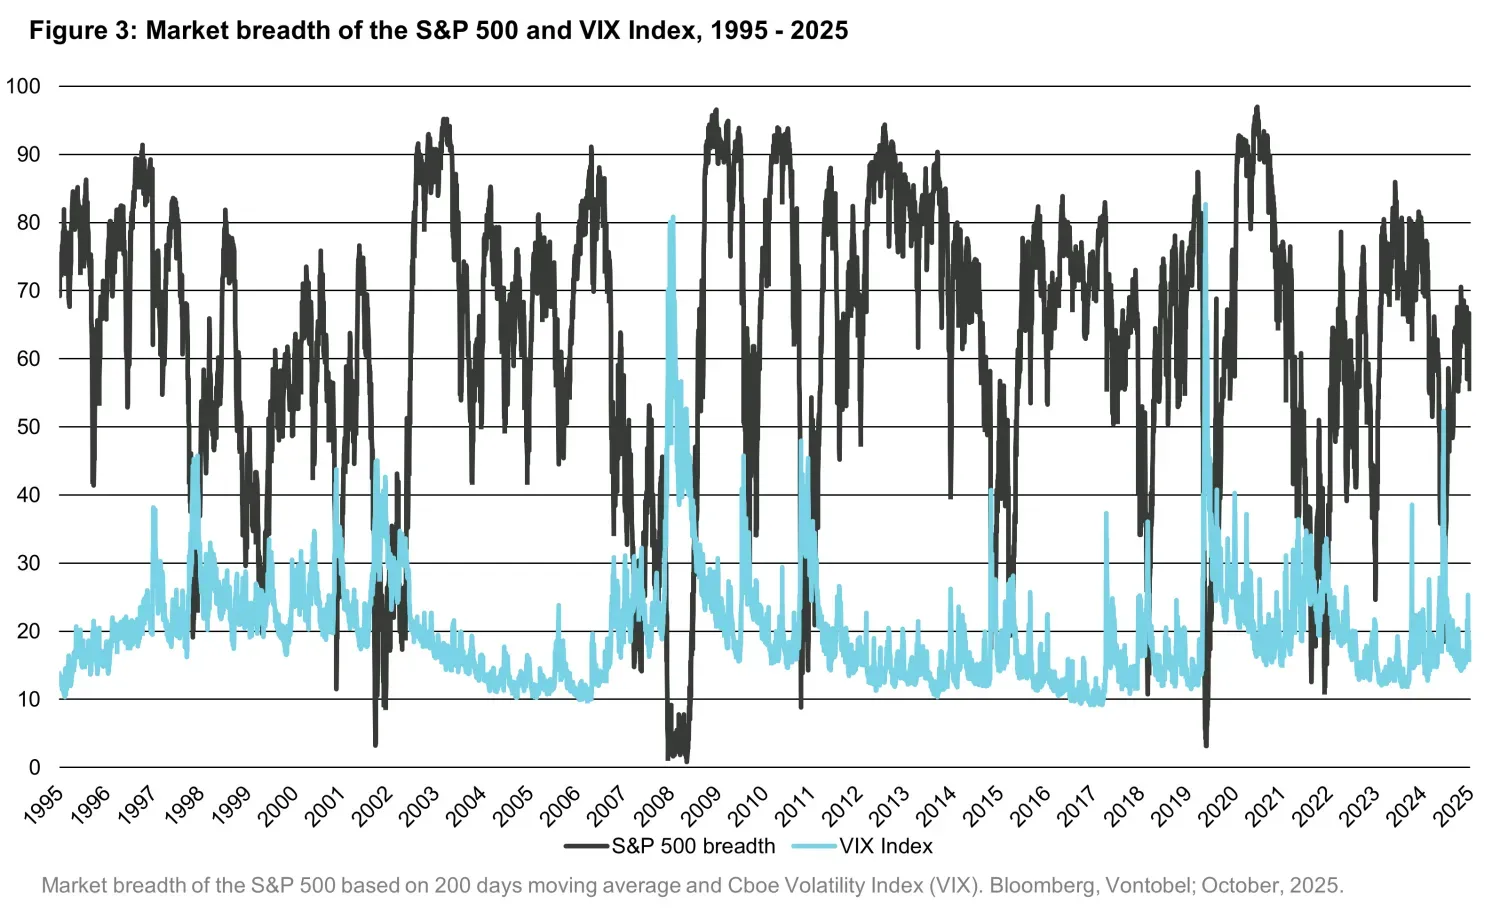
Historically speaking, a high concentration value of the index, shown in the Figure 3 as a declining breadth in the case of the S&P 500, has frequently preceded volatility spikes.
The lesson across these decades is consistent: concentration doesn’t cause corrections on its own, but it magnifies them once they arrive. When market returns depend on a narrow leadership, resilience fades — diversification no longer cushions losses because the rest of the index simply follows the leaders lower.
Today’s concentration is unique for one reason: it is reinforced by the structure of passive investing. Unlike similar situations in the past fuelled by excitement or leverage, this one is sustained by mechanical capital flows. Every dollar entering a passive fund increases the weights of the largest constituents automatically. This can extend the dominance of mega-caps far longer than sentiment would but also makes reversals sharper when liquidity rotates.
For allocators, this means concentration risk should be tracked as closely as inflation or interest-rate policy. The warning signs are subtle: fewer stocks making new highs even as the index rises, volatility creeping up beneath the surface, or the equal-weight index lagging persistently. History suggests that these are not random quirks — they are often the first cracks in narrow leadership phases.
How do we navigate?
We see concentration as a structural risk — one that deserves the same attention as inflation, growth, or policy cycles. We continuously monitor a set of indicators designed to capture the build-up of fragility in equity market such as the share of the index held by the top 10 companies, the dominance of the largest sector, the dispersion of returns between cap-weighted and equal-weighted indices, and the behavior of volatility measures such as the VIX and its term structure.
When several of these indicators align — high concentration, weak breadth, and rising implied volatility — we interpret it as a sign that the market’s resilience is thinning. Our response is not to exit risk entirely, but to re-balance and protect. One part of this approach is structural portfolio protection. We maintain option-based hedges, such as protective puts on major indices, and we use volatility derivatives when the market environment justifies it. These instruments are not designed to predict downturns; they exist to cushion portfolios when sudden drawdowns occur. Like insurance, they can feel costly during calm periods, but their value becomes evident when stress returns.
The second line of defense is diversification beyond the crowded core. Exposure to smaller companies, international markets, or factor-balanced strategies can restore genuine variety to return sources. While these allocations may lag during phases of extreme concentration — as they have in recent years — they have historically outperformed once leadership rotates and valuation gaps normalize.
Ultimately, navigating concentration is about balance. We stay invested in long-term growth themes while ensuring that a single narrative — no matter how compelling — does not dominate our risk budget. In practical terms, that means allowing portfolios to participate in market gains, but ensuring they remain prepared for the other side of the cycle. Because concentration, by its nature, carries an asymmetry: the build-up is slow and rewarding; the reversal is sudden and costly.
Related insights

2026 Large Language Models Outlook

2026: Multi Asset Reloaded - Investors (Still) Need Diversification

Global rates: a mirage of diversification

The signals beneath the surface

The top 2%
