
Decoding the Market Response to US Tariffs
Multi Asset Boutique
Markets surged on Wednesday, April 9, ending the day with an unexpectedly strong performance. The S&P 500 posted its third-best daily gain since 1950. Just hours earlier, investor sentiment had been weighed down by rising trade tensions between the US and China. So, what changed?
A change in tone from Washington, amidst a market rout, reflected investors' concerns about an apparently unending retaliation spiral. President Trump signaled a 90-day pause in new tariffs—offering a temporary reprieve from the escalating dispute. While this didn’t resolve the underlying issues, it was enough to spark a broad relief rally across equities.
We believe the turnaround had less to do with international pressure and more with signals from within. A sharp sell-off in the Treasury market, paired with falling equity prices, may have been a wake-up call. Market reactions can influence policy—especially when volatility spills over into politically sensitive sectors.
Still, key questions remain unanswered. Investors want clarity on which tariffs are likely to stay, which may be reversed, and whether this pause could open the door to real progress. So far, that clarity hasn’t arrived.
But the message is clear: there are limits. And it may not be any single institution, but the markets themselves that ultimately draw the line and push President Trump back to the negotiating table. For investors, that’s at least a place to start. A natural follow-up question is whether this relief rally is sustainable. Before we explore the key factors for a lasting rally, let’s first recap the recent tariff announcements.
U.S. Tariffs and Market Volatility: Navigating the New Trade Landscape
Markets have moved sharply in recent weeks. At the heart of it: US tariffs and the uncertainty they bring On Liberation Day, the US implemented a comprehensive new tariff plan, raising the average effective rate to 25%1 — the highest in over a century. Countries like China responded immediately, escalating the retaliation spiral between the two nations. As of April 11th, the US and China are imposing tariffs of 145% and 125% on each other's goods, respectively. As shown in Figure 1, this has increased the U.S.'s average effective tariff on goods to around 27%. The sudden reversal of falling trade barriers, after decades, is prompting investors to reassess the economic outlook. Two factors sparked the initial sell-off following the Liberation Day announcement.
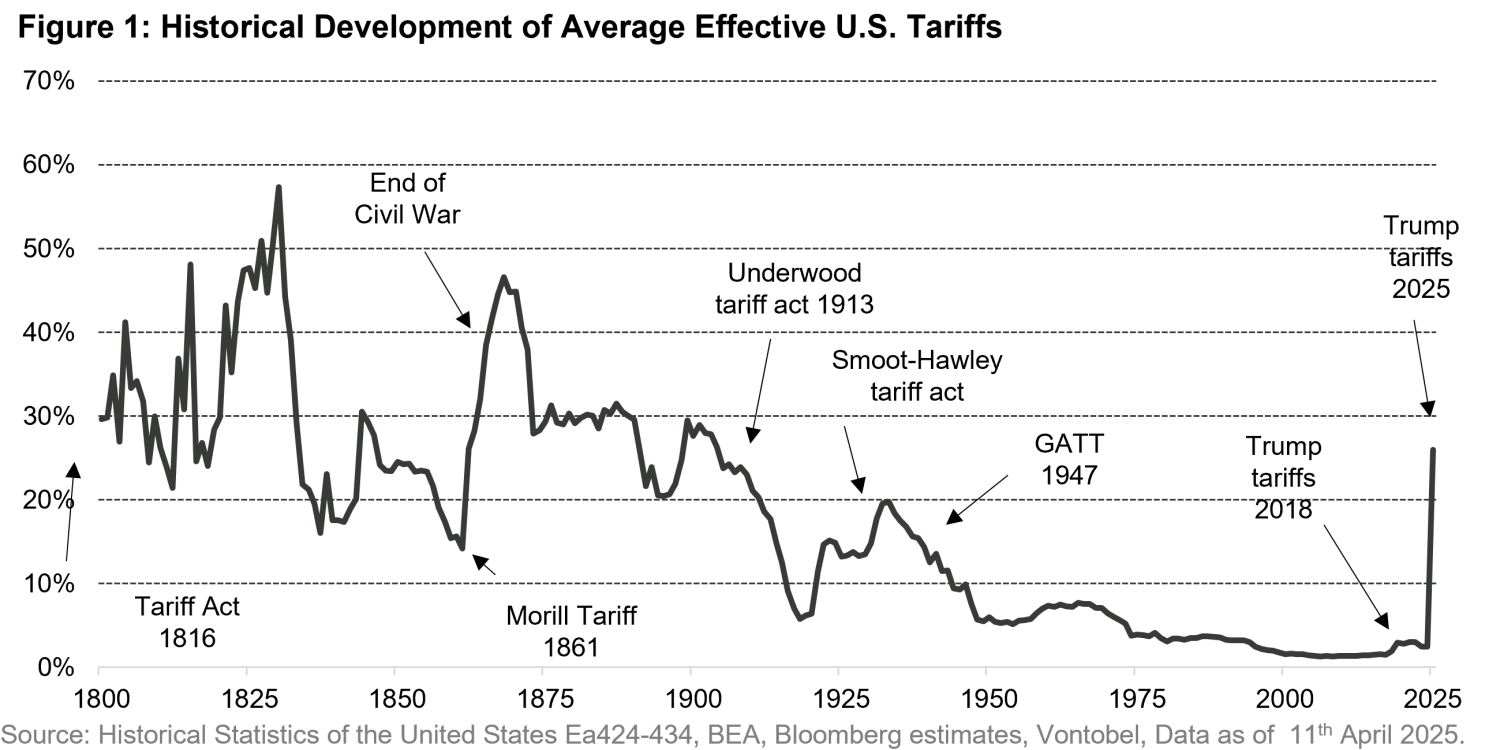
First, the scale. A 25% rate sharply increases costs for companies and consumers. Until recently, most had priced in tariffs of 10–15%.
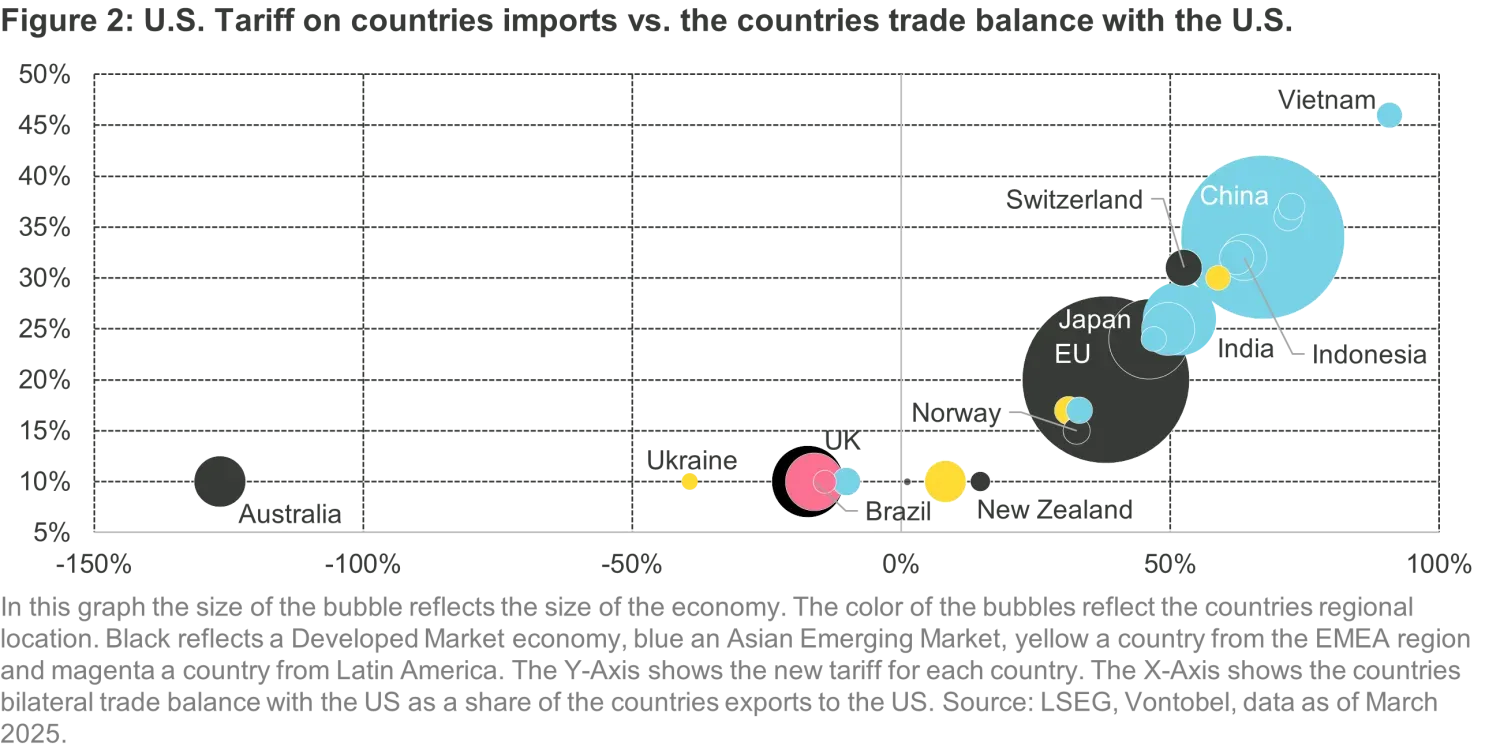
Second, the approach. Instead of basing rates on other countries’ trade barriers2 —as previously suggested—the US is now linking tariffs to bilateral trade balances. This means countries with large trade surpluses face higher rates, regardless of how open their markets are. Take Israel. Despite eliminating tariffs on US goods, it now faces a 10% minimum tariff. The European Union proposed a deal for zero tariffs on both sides. Washington declined. This suggests US tariff policy does not aim at aligning tariffs.
Figure 2 shows the new tariff schemer: countries with balanced trade or small surpluses face a flat 10% tariff. Beyond that, rates scale with the size of the surplus3. The baseline 10% tariff came into force on 5 April. Higher rates were set to follow on 9 April—until President Trump announced a 90-day pause. Over the weekend, news was confirmed that smartphones, computers, and some other electronics would be exempt from U.S. reciprocal tariffs, including the 125% tariff rate on China. However, authorities emphasized that these exemptions are temporary. That surprise move triggered a strong equity rally and opened the door to negotiations.
What happens next? Markets are hoping for more clarity. In our view, there are three main developments investors will focus on in the upcoming weeks and that decide about the sustainability of the rally. The first, transparency on effective tariff rates, may now be within reach as the 90-day pause opened the door for negotiations and ended the retaliation spiral, at least for now. The second is the response of the world economy to the shock.
Rising Tariffs: Market and Economic Impact
There’s little recent precedent for the current rise in tariffs. The last time rates increased this sharply was over a century ago—under very different economic conditions. Today, outcomes depend on how businesses, consumers and policymakers respond.
Companies with strong profit margins may absorb part of the additional cost to protect market share, limiting the pass-through to prices. But that hinges on consumer behaviour. If demand proves sensitive to price changes, higher costs could weigh on spending—raising inflation and slowing growth. If alternatives exist, the adjustment could be milder.
Exchange rates play a role, too. Currencies from tariff-affected countries tend to weaken, helping offset price pressures. But with so many moving parts, investors are still in the dark. It may take weeks—or even months—for the true economic impact to emerge. That puts economic data back in focus.
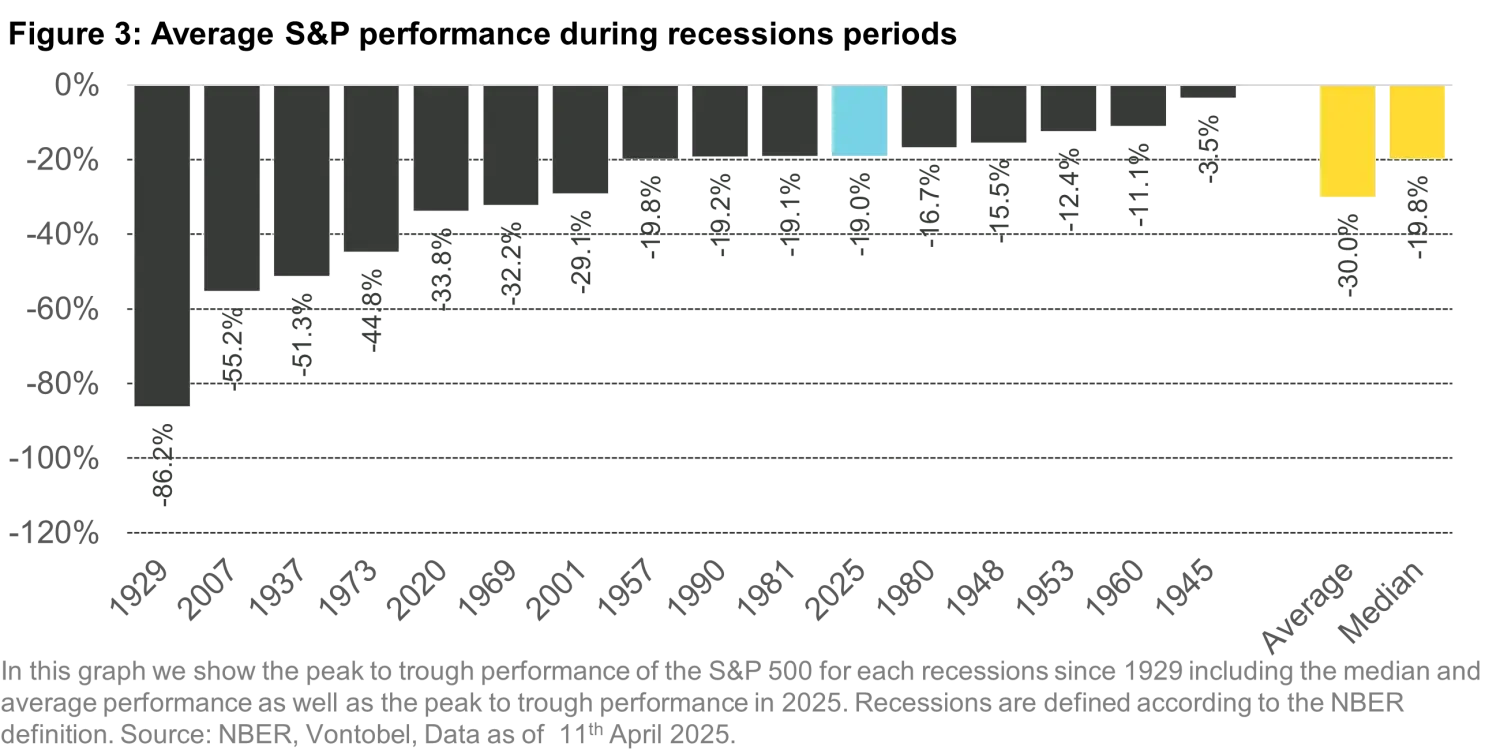
What have markets priced in? Figure 3 compares this year’s S&P 500 peak to trough performance to prior recessions. Until recently, equity markets traded near recession-like levels4. Other asset classes, like the credit market, have shown more varied signals. Tight spreads, seen before the Liberation Day announcement, have only eased to historical averages. The recent rally should be seen in that light: investors are pricing out the most severe scenarios. A 10% baseline tariff now appears manageable for the US economy—at least for the moment. The Fed is the third crucial factor influencing the future direction of risky assets.
The Federal Reserve's Role Amid Tariff-Driven Inflation
The Federal Reserve plays a central role in managing financial conditions, using both conventional tools—like policy rate cuts—and unconventional ones, such as quantitative easing. At present, the future market anticipates about three more policy rate cuts in the next 12 months. This is a decrease of 25 basis points between April 9th and 11th. However, that view could be challenged if the Fed hesitates to ease amid tariff-driven inflation.
After underestimating the persistence of supply shock inflation during the COVID crisis, the Fed may take a more cautious approach this time. This could mean delaying action, even if growth slows and would probably be most likely a setback for financial markets.
That said, we view this as a risk scenario. The Fed’s dual mandate—to support both stable prices and full employment—suggests that weakening labour market data would likely trigger a policy response.
How we navigate?
What has surprised us in recent months is not the direction5 but the magnitude of the rise in volatility. In this environment, Minimum Volatility strategies helped us navigate the trade tensions6 and the broader market correction. Even the rise in US Treasury yields created challenges, making it difficult for investors to find safe havens.
Two of our preferred hedges—the Japanese Yen7 and gold8 —performed reasonably well in recent weeks. Despite the hurdles for investors, we recognize that markets are approaching a more reasonable pricing of the tariff situation. As a result, we’ve reduced option-based tail risk hedges in our portfolios. One positive signal for bond investors — and U.S. Treasuries in particular — would be the Fed stepping in to stabilize the bond market or signaling a more accommodative monetary policy going forward. However, we're not there yet.
The path to a sustained rally is unclear, especially as the market appears to have factored in a more favorable outcome - an end to the retaliation spiral and successful tariff negotiations, following a partial recovery of risky assets. We expect political volatility to remain high, and a long path to redefine a new normal for global trade. In light of that, we’re reducing equity exposure as the recovery continues9.
1. As highlighted by our colleagues from the Multi Asset Class Boutique, the announced tariffs amount to an average tariff of around 25%. Find more details in “No spring truce in trade wars.”
2. We explored potential reciprocal tariff scenarios in “Navigating the Trade Tensions.”
3. The tariff for countries with a surplus exceeding 10% is calculated by subtracting the country's imports from the US from its exports to the US, as a share of the country's cumulative 12-month exports to the US. The result is halved, meaning the US administration is currently levying only 50% of the calculated tariff. The EU, currently running a bilateral trade surplus with the US of around 40%, is therefore subject to a 20% tariff (40%/2).
4. As of now, the S&P hit its low point on April 11th.
5. In “Humble New Year Resolutions” we emphasized the importance of portfolio hedges for the year 2025, anticipating increased market volatility.
6. We discussed the attractive portfolio construction properties of Minimum Volatility strategies in "Timing Factors with Macro Regimes."
7. Check out “The Yen Reloaded: A Hidden Hedge?” for our take on the Yen.
8. Check out “Renewed macro support for gold” for our perspective on gold.
9. We refer to our webpage for further information on our investment process.
Important information: This marketing document was produced by one or more companies of the Vontobel Group (collectively "Vontobel") for institutional clients. This document is for information purposes only and nothing contained in this document should constitute a solicitation, or offer, or recommendation, to buy or sell any investment instruments, to effect any transactions, or to conclude any legal act of any kind whatsoever. Although Vontobel believes that the information provided in this document is based on reliable sources, it cannot assume responsibility for the quality, correctness, timeliness or completeness of the information contained in this document. Except as permitted under applicable copyright laws, none of this information may be reproduced, adapted, uploaded to a third party, linked to, framed, performed in public, distributed or transmitted in any form by any process without the specific written consent of Vontobel. To the maximum extent permitted by law, Vontobel will not be liable in any way for any loss or damage suffered by you through use or access to this information, or Vontobel’s failure to provide this information. Our liability for negligence, breach of contract or contravention of any law as a result of our failure to provide this information or any part of it, or for any problems with this information, which cannot be lawfully excluded, is limited, at our option and to the maximum extent permitted by law, to resupplying this information or any part of it to you, or to paying for the resupply of this information or any part of it to you. Neither this document nor any copy of it may be distributed in any jurisdiction where its distribution may be restricted by law. Persons who receive this document should make themselves aware of and adhere to any such restrictions. In particular, this document must not be distributed or handed over to US persons and must not be distributed in the USA.
A propos de l'auteur

Fonds apparentés
A propos de l'auteur
Sujets :
Afficher le suivant :
Towers and the Starlink ThreatInsights apparentés

Towers and the Starlink Threat

Quarterly Commodity Outlook - Halftime Whistle: Fundamentals Take the Field

Investors’ Outlook : Et maintenant, quelque chose de totalement différent

Investors’ Outlook: Ajuster la focale

Investors’ Outlook: Sans détour
