
Navigating the Trade Tensions
Multi Asset Boutique
Markets are moving quickly. Just a week after the Magnificent 7 sell-off triggered by DeepSeek, Donald Trump reignited trade tensions. While the timing was somewhat unexpected, higher market volatility in 2025 has always been part of what we expected1. Despite the initial shock of tariffs on Canada, Mexico, and China—followed by a broader 25% tariff on steel and aluminum imports effective March 12—markets have absorbed the news relatively well. The direction of market movements in early February reflects the economic effects of higher U.S. tariffs. As a net importer, the U.S. is unlikely to face immediate growth concerns. However, tariffs could push inflation higher. In contrast, export-dependent economies—especially those with strong trade ties to the U.S.—are more likely to experience slower growth rather than a significant inflationary impact.
These differences help explain recent asset price movements. U.S. bond yields have risen, while European yields have declined. Meanwhile, uncertainty surrounding tariffs has driven gold and the Japanese yen higher as investors seek safe-haven assets.
While markets quickly absorbed the initial tariff announcements, a more significant shift is looming. Donald Trump has signaled plans for reciprocal tariffs—raising U.S. import duties to match those imposed by other countries on American products. This move could have broader economic and market implications, influencing trade flows, corporate earnings, and investor sentiment.
What would this mean for investors? Let’s explore the possible scenarios and their impact on markets.
The Complexity of Reciprocal Tariffs
Figure 1 highlights the countries with the largest average tariff differentials2 (blue bars), with India, Thailand, and Brazil standing out. However, these blue bars represent simple country averages, and it remains unclear whether the U.S. will implement reciprocal tariffs at the country level to address this gap.
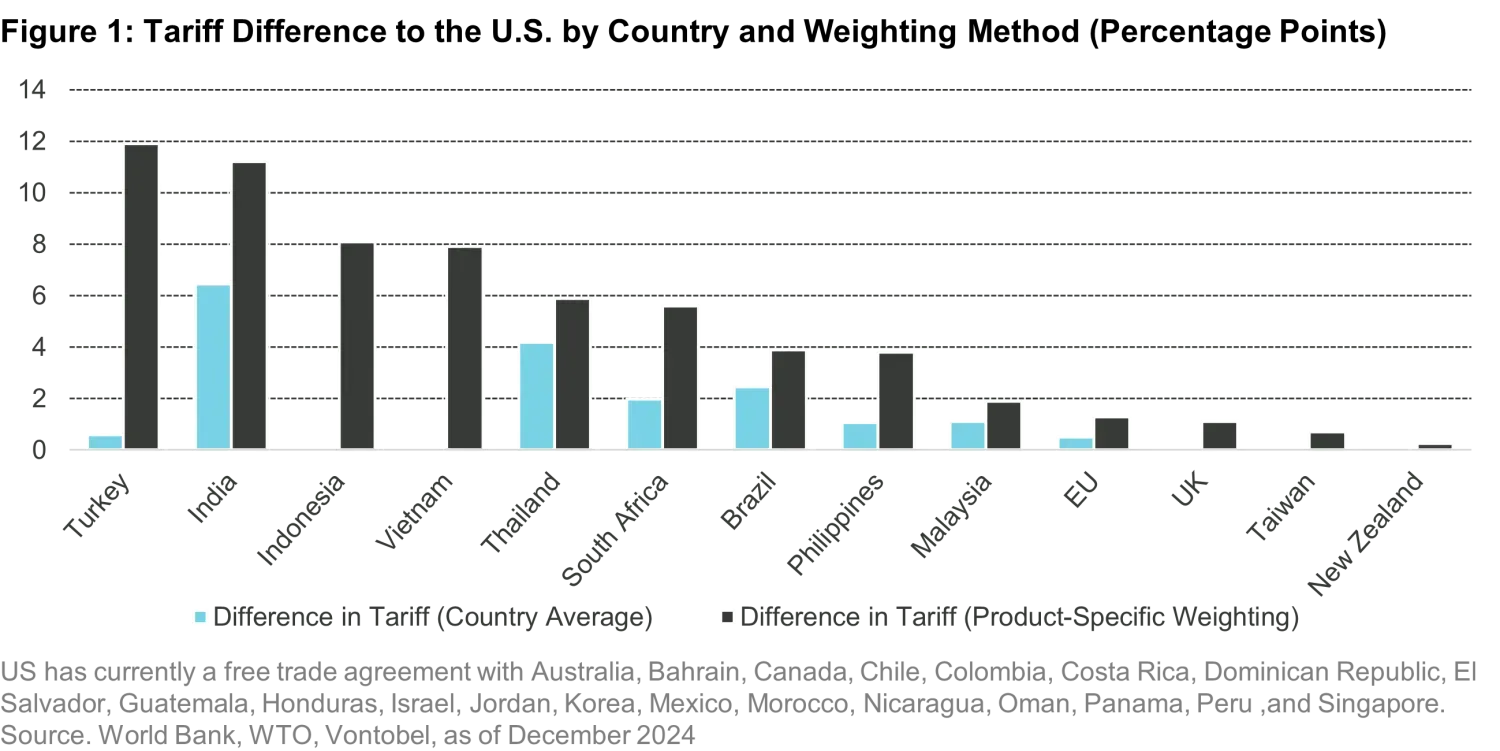
So far, Trump’s trade policy has not solely focused on average country-level tariff differences. Instead, a product-specific approach seems more likely—targeting industries with the greatest disparities (black bars). Under this product-specific weighting scheme, Turkey, India, Indonesia, and Vietnam stand out. For major European economies, the impact would be relatively moderate in U.S. dollar terms.
A country-level approach to reciprocal tariffs would be simpler to implement. However, a product-specific approach could lead to a one-percentage-point higher increase in overall U.S. import tariffs—something Trump may view as a fairer adjustment.
As shown in Figure 1, weighting tariff differences by product would result in more significant tariff changes for certain countries, while others (such as the EU) would be less affected. While many goods would see little to no impact in the EU, industries like Germany’s automotive sector could face substantial adjustments. Therefore, even though the overall impact on the EU in U.S. dollar terms may be moderate, the effect on specific industries could still be significant.
The Role of VAT
Reciprocity in trade is more complex than it may first appear. While tariffs are often the focus, non-tariff barriers—such as licensing requirements or sanitary inspections—could also play a role. Though incorporating these elements would complicate tariff calculations, another emerging factor could influence trade policy: VAT differences.
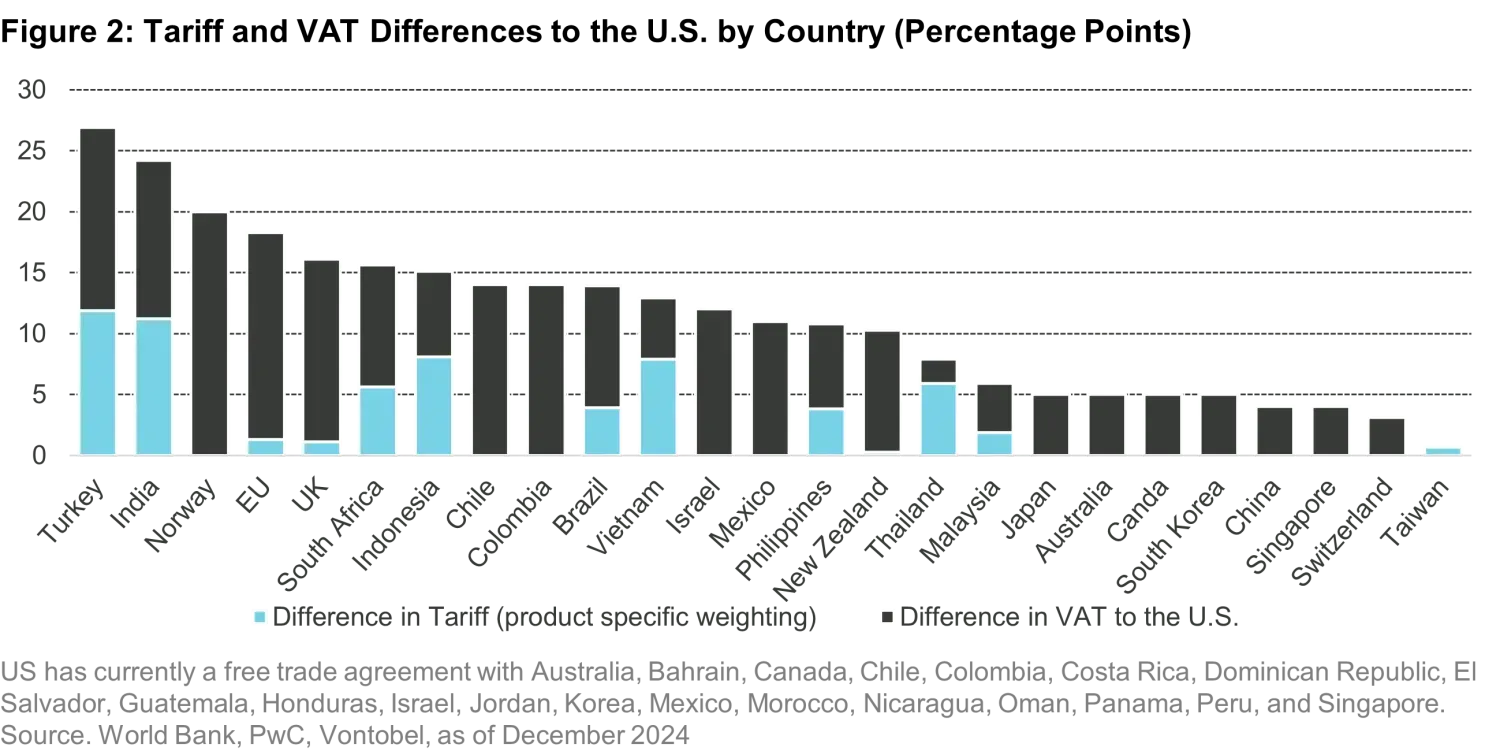
Historically, the U.S. has not viewed VAT taxes as trade barriers3, even in its annual Trade Estimate Report. However, in a recent interview4, National Economic Council head Kevin Hassett suggested that VAT differences could be considered in reciprocal tariffs. This would place greater pressure on countries with higher VAT rates, particularly in Europe.
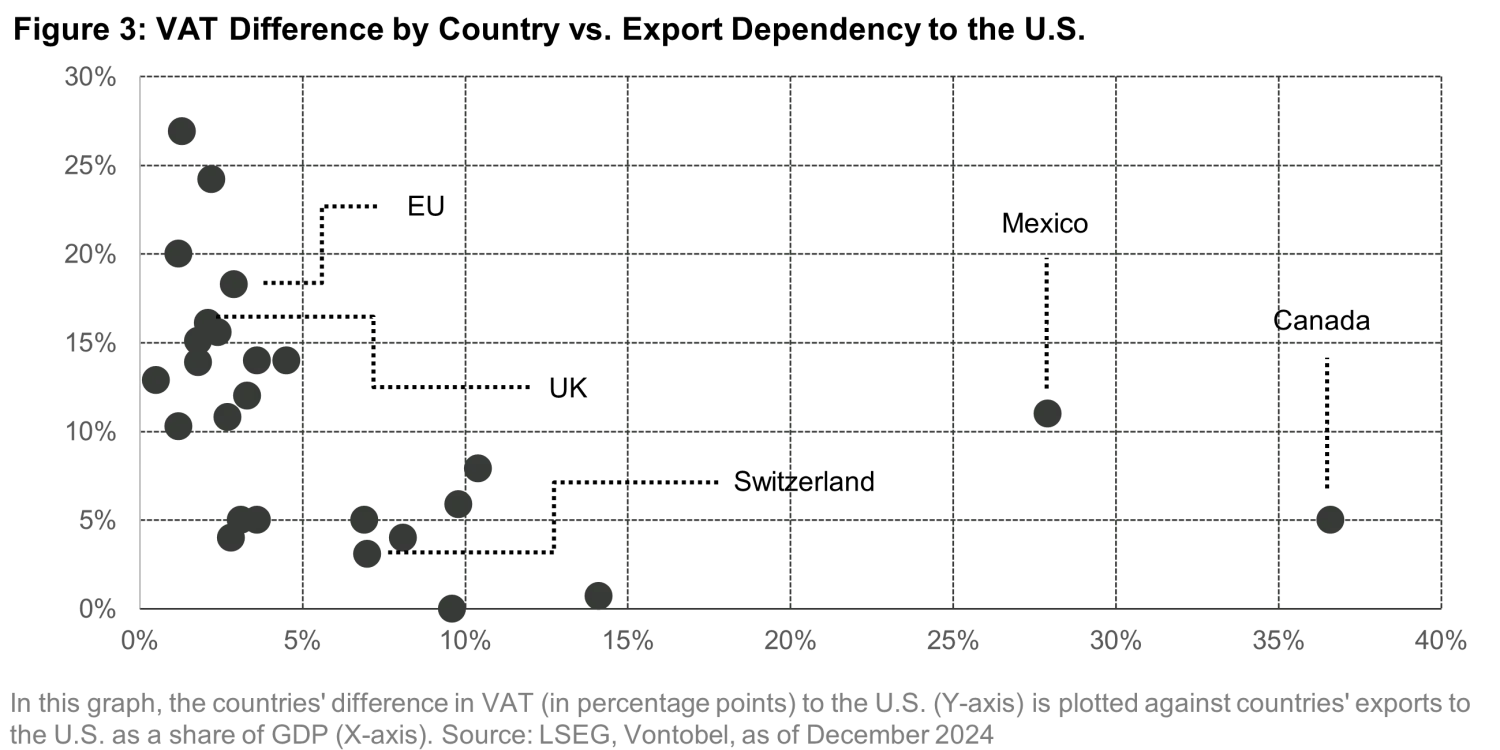
As shown in Figure 2, VAT differentials are most pronounced between the U.S. and the European Union, followed by India, Mexico, and Canada. If VAT differences were incorporated into U.S. tariff policy, trade costs could shift, particularly for high-VAT economies. Figure 3 provides a template for a rule-of-thumb calculation, showing each country's export dependency versus a scenario where the U.S. increases tariffs based on VAT and tariff differentials—a relatively low-probability worst-case scenario.
With trade policy evolving, we are closely monitoring how these changes could impact global supply chains and corporate earnings.
How we navigate
The market’s muted reaction in early February came as a surprise to most. Two key factors explain this. First, the risk of a trade war is no longer an unpredictable shock—it was a defining theme of Donald Trump’s first administration. Second, most affected countries—except China—have responded with concessions and only mild retaliation, avoiding immediate escalation.
Clearly, uncertainty remains. The scope of reciprocal tariffs is unclear, and market stability depends on how they are defined. A country-average approach could limit disruption, but broader measures—including product-level adjustments and VAT differences—would likely fuel market volatility. Some industries, such as automotive manufacturing, could face outsized pressure.
With trade policy uncertainty likely to persist, investors should remain alert. While we maintain a constructive market outlook5 and a long equity position, hedging strategies could be crucial for performance this year.
So far, our tail hedges—such as the Japanese yen and gold6—have delivered strong results, with gold reaching new highs. Meanwhile, European equities have outperformed in recent weeks, driven by expectations of fiscal stimulus following German elections and Trump’s decision to delay tariffs on Canada and Mexico.
Looking ahead, the focus on reciprocal tariffs, particularly their potential impact on Europe, strengthens our view that European duration has further room to outperform U.S. duration. Investors should consider hedging strategies to navigate volatility, using equity put options, select currencies (JPY and USD), and commodities (primarily gold).
1. See “Humble New Year Resolutions”
2. Average country tariffs are sourced from the WTO’s “World Tariff Profiles 2024” and WITS 2022 Statistics. The tariff difference is calculated by subtracting the U.S. tariff on a country from that country's tariff on the U.S. Consider the UK: According to WITS Statistics, the effective applied tariff by the US on the UK is currently 1.3%, while the UK applies only 0.7%. Since the US imposes a higher tariff on the UK than the UK does on the US, the blue bar in Figure 1 is not visible.
3. The U.S. has not considered VAT a trade barrier so far, likely because it does not discriminate against foreign companies—all businesses and consumers face the same tax within a country. When goods are imported, VAT is typically due at the point of entry. Importers must pay it upfront but can usually reclaim it as input tax if the goods are used for VAT-taxable business activities. However, this creates a cash flow burden, as businesses must first pay VAT and recover it later through their tax return.
4. Listen to the recent “Bloomberg Talks” interview with Kevin Hassett for further details.
5. In our last Quanta Byte, “Humble New Year Resolutions”, we highlighted the favourable economic environment for financial markets.
6. See “Renewed macro support for Gold” for our outlook on gold.
This marketing document was produced by one or more companies of the Vontobel Group (collectively "Vontobel") for institutional clients.
This document is for information purposes only and nothing contained in this document should constitute a solicitation, or offer, or recommendation, to buy or sell any investment instruments, to effect any transactions, or to conclude any legal act of any kind whatsoever.
Although Vontobel believes that the information provided in this document is based on reliable sources, it cannot assume responsibility for the quality, correctness, timeliness or completeness of the information contained in this document. Except as permitted under applicable copyright laws, none of this information may be reproduced, adapted, uploaded to a third party, linked to, framed, performed in public, distributed or transmitted in any form by any process without the specific written consent of Vontobel. To the maximum extent permitted by law, Vontobel will not be liable in any way for any loss or damage suffered by you through use or access to this information, or Vontobel’s failure to provide this information. Our liability for negligence, breach of contract or contravention of any law as a result of our failure to provide this information or any part of it, or for any problems with this information, which cannot be lawfully excluded, is limited, at our option and to the maximum extent permitted by law, to resupplying this information or any part of it to you, or to paying for the resupply of this information or any part of it to you. Neither this document nor any copy of it may be distributed in any jurisdiction where its distribution may be restricted by law. Persons who receive this document should make themselves aware of and adhere to any such restrictions. In particular, this document must not be distributed or handed over to US persons and must not be distributed in the USA.
About the author

Related funds
About the author
Explore related topics:
Up next:
Towers and the Starlink ThreatRelated insights

Towers and the Starlink Threat

Quarterly Commodity Outlook - Halftime Whistle: Fundamentals Take the Field

Investors’ Outlook: And now for something completely different

Investors’ Outlook: Adjusting the focus

Investors’ Outlook: Strait forward
