Quantitative Investments
Your partner for leading quantitative investment solutions.
You could not have asked for a more eventful US presidential election than the one we’re witnessing now. As quantitative investors, we continuously seek to incorporate the most recent information into our forecasts and seek to take advantage of the insights thus gathered.
In this piece, we take a look at how recent events have shaped the odds of victory for either candidate, and draw implications on how to tweak exposure to US equities.
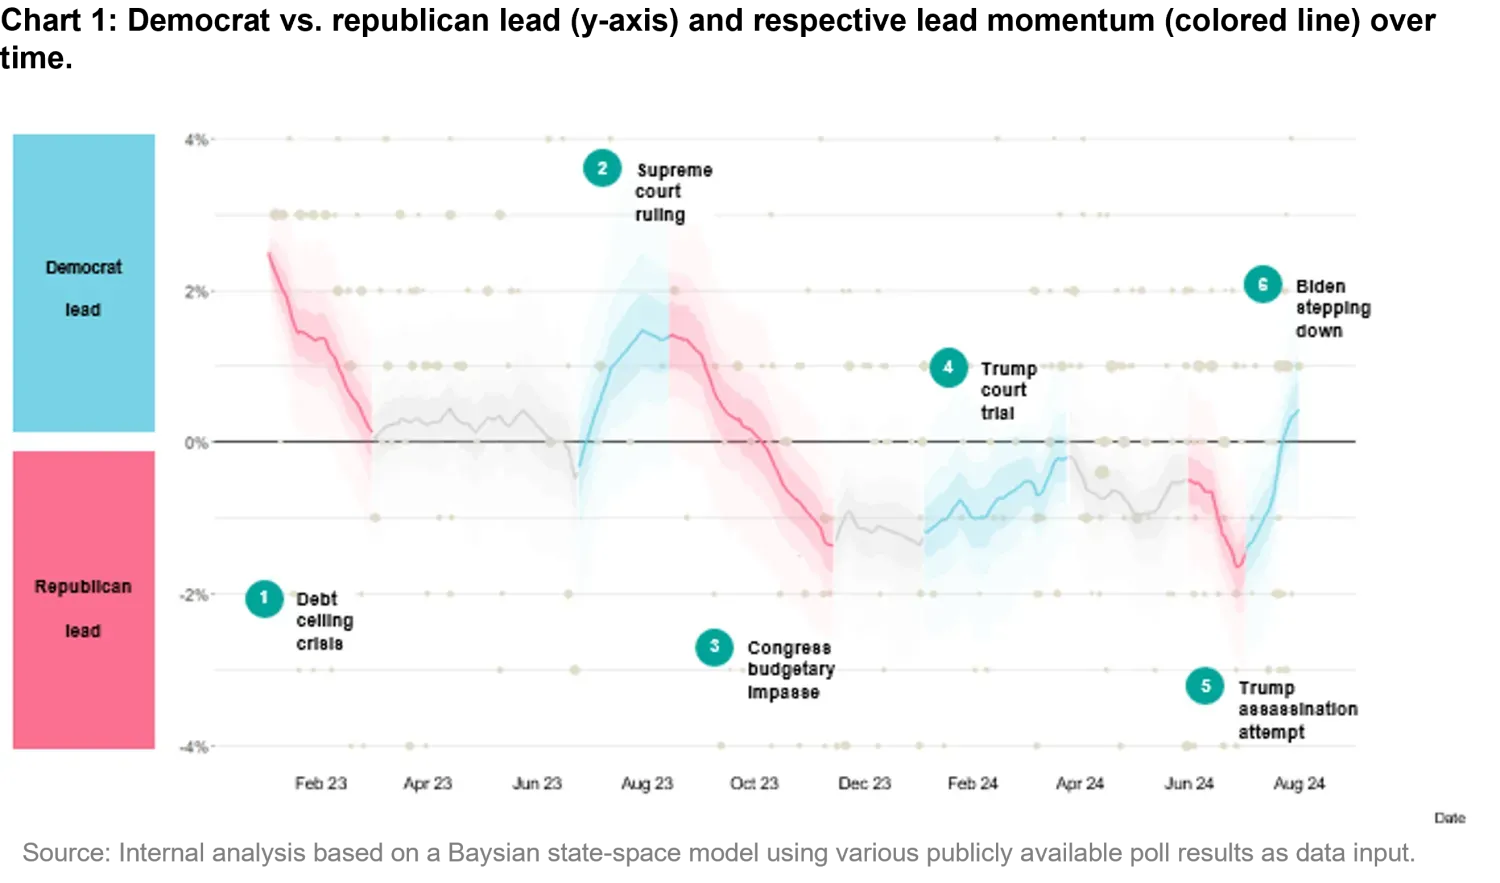
Figure 1 depicts the margin of victory for either candidate (as garnered from the polls) over time. A positive reading signifies a lead for the democratic candidate, while a negative reading a lead for the republican one1. The margin-of victory line represents a sophisticated average of poll results2, which are depicted as the grey bubbles in the chart. The larger the bubble, the more participants in the poll. The line is colored in blue during periods when Democrats are increasing their lead, and in red when Republicans are increasing theirs. The lines are left grey during periods when there is no significant shift.
As you can see in Figure 1, all major shifts have followed key events. It all starts with the debt ceiling crisis, which begins to unfold at the beginning of 2023. Frustrated with how the Democratic administration is handling the situation, the public starts to veer in favor of the Republican candidate. The Democratic lead is eroded. The Supreme Court rulings during the summer of 20233, which have been perceived as reverting social liberties, triggers a swing back to the Democratic party. During the summer of 2023, the Democratic administration disappoints the public in how they’re handling budget discussions, which leads to the largest shift in odds away from Democrats. Prior to the onset of the budget crisis, Democrats were in the lead with about 1.5 points. By the end of it, they stood behind by about 1.3 points.
The Trump trial, while it eroded the Republican lead during the period from February until April 2024, did not cause the shift in preference that most expected (or one the Democrats certainly had hoped for). In some way, Trump may have been successful in portraying himself as victim of an unjust system, as opposed to accepting the conviction laid upon him.
The TV debate (which raised questions about whether Biden would be fit for a second term) and the assassination attempt in July on Trump (which gathered sympathy globally) restored the Republican lead in a very short period of time. By the third week of July, Republicans had the strongest lead in our chart.
Biden’s retreat from the race, and Kamala Harris’ candidacy, have triggered significant media attention, and have swung the pendulum back in favor of Democrats towards the latter part of July. As of the time of this writing, Democrats are back in the lead, something they had not experienced since October of last year.
The shaded area around the margin-of-victory line indicates the significance of the poll average. If the darkest-shaded area around the line (the first shading around the line) does not encompass the zero-line, it means that the advantage is statistically significant with 90 percent confidence. This is the case for Kamala Harris today.
While the status quo depicts public opinion in favor of the democrat candidate, what does all this mean for election outcomes? To answer that, we need to look at the forecasts, which we discuss next.
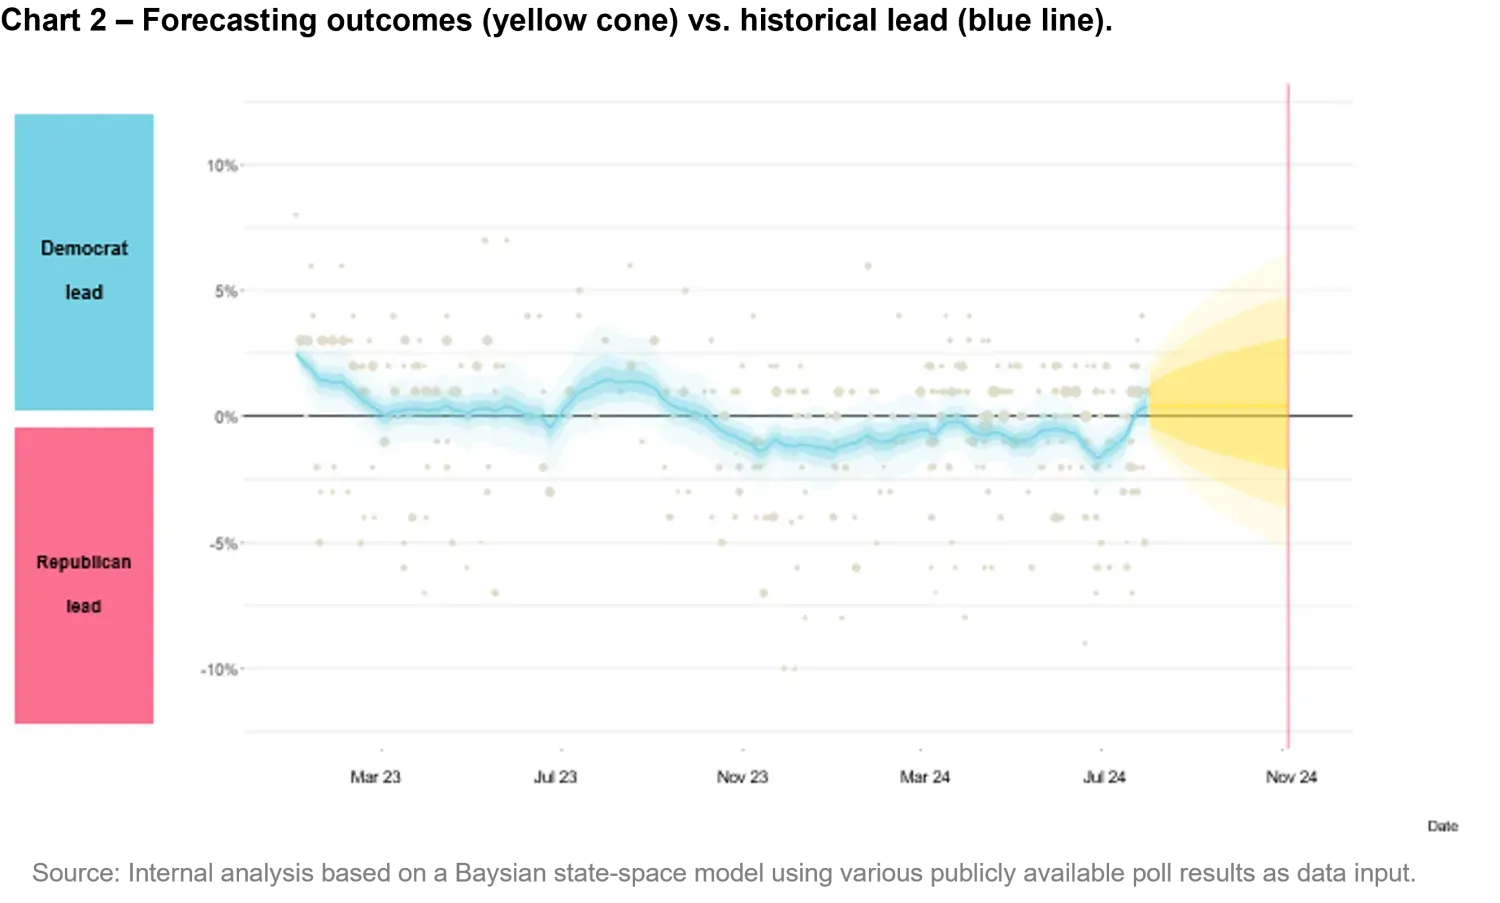
Figure 2 depicts the same margin-of-victory line of Figure 1, this time with the forecast ‘cone’ (depicted in yellow). Since the forecast cone is much wider than the current range, we re-scaled the y-axis by extending its range. That is why the margin-of-victory line seems flatter than what is depicted in Figure 1. The numbers are clearly the same though.
As discussed in our previous article on the subject, the forecasting cone is associated with a much wider uncertainty than the outcome of current polls. The further away the forecast, the broader the cone. As the election nears, the cone will shrink in width. As of now, while Democrats are leading the current polls in a statistically significant way, their margin is not enough to translate into a significant margin on election day. In fact, the darkest-shaded yellow area contains the zero line.
1. There is clearly no judgment in having assigned positive numbers to the democratic candidate. We do not imply that a democratic lead nor a republican lead is a positive thing.
2. For details on how the margin-of-victory line is derived from the poll results and a discussion on why a simple average won’t provide a reliable results, please consult our previous article on the subject: https://am.vontobel.com/en/insights/us-elections-2024.
3. We refer to the Supreme Court ruling of the 30th of June, 2023 by which the Supreme Court rules that presidents have some degree of immunity for their official acts while serving as Presidents (Trump vs. United States).