
Sources of income in European equity markets
Multi Asset Boutique
In this paper we review how a systematic strategy that sells covered calls monthly at 5 percent over the price of the Euro Stoxx 50 Index would perform. The data covers 25 years across multiple market cycles, including bear markets, sharp downturns and rebounds. The return sources of the strategy (stock returns, dividend returns and the option returns) are decomposed to highlight diversification benefits of independent income sources through different regimes, and to show how the strategy behaved during periods of abnormal market conditions.
Over the full period, the strategy delivered an average annual distribution of 5.5 percent while slightly increasing the initial capital.
In this piece, our objectives are:
- To describe how the three return sources behave across market cycles and how their interaction shapes long-term results
- To show how the combined return profile can support more regular distributions over extended periods
- To review how the strategy performs during abnormal market conditions, including 2000–2003, 2008, 2011, 2020, and 2022
Source of returns
The Euro Stoxx 50 Buy Write Index is a covered call strategy and can be broken down into three return sources: stock returns, dividend returns, and option returns. Figure 1 shows the total return of the strategy alongside these three sources. Each responds to different market conditions and follows its own path across market cycles.
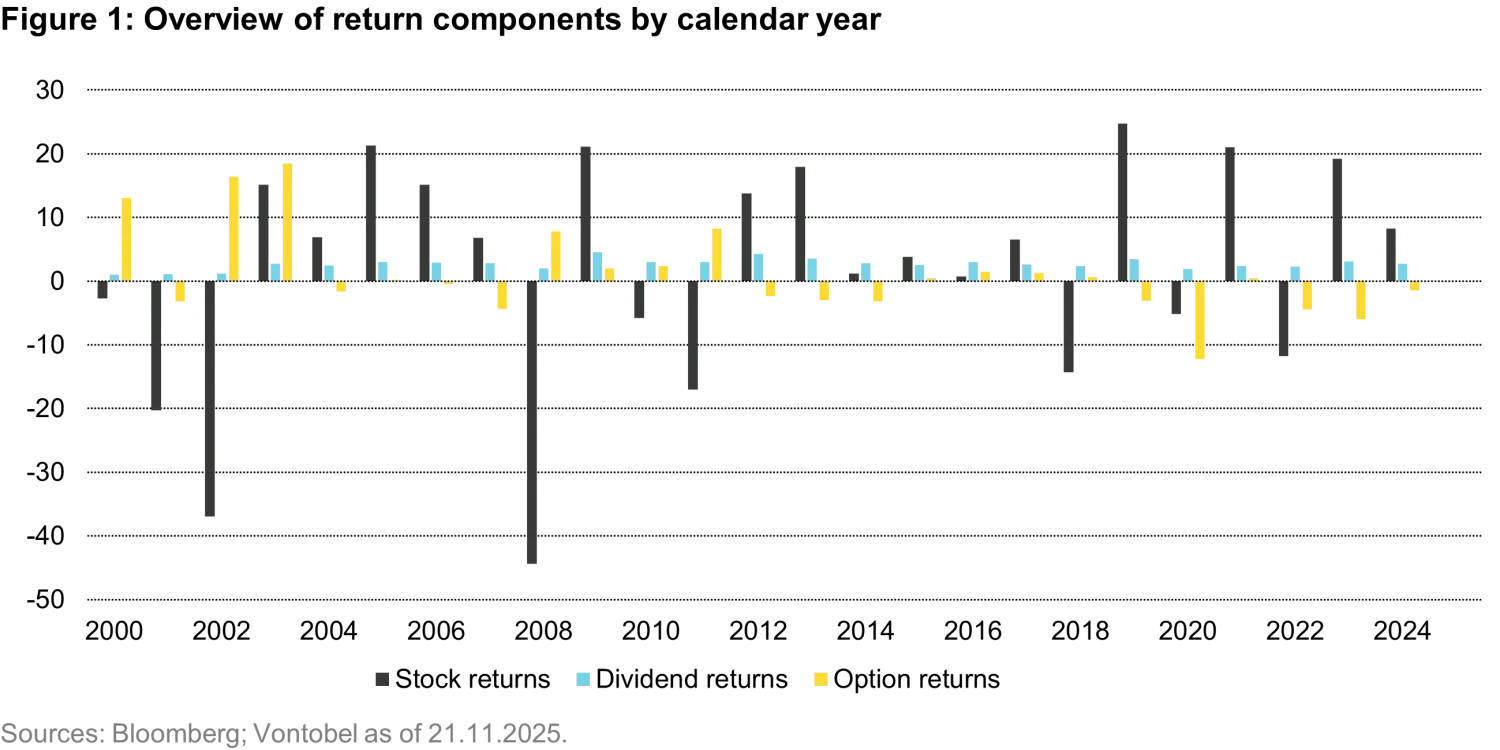
Stock returns show the widest variation from year to year, reflecting changes in economic conditions, earning cycles and regional developments. Dividend returns have been the most consistently positive contributor over the 25-year period. It tends to be stable with notable reductions only during major economic contractions such as 2001, 2008, and 2020. Option returns (from the covered call strategy) usually show modest losses in rising markets and equally moderate gains during market corrections. The main exception in the period reviewed is 2020, when a sharp drawdown during the lockdown phase and a rapid rebound created a challenging environment for passive covered call strategies. In 2020, the passive covered call strategy essentially locked in the losses in the sharp drawdown, which limited participation in the recovery.
Diversification of returns
The interaction between the three return sources creates a diversification effect that becomes clear when option returns are compared with price returns on a year-by-year basis. Figure 2 plots annual stock returns vs option returns to show how the components complement one another across different market conditions. In 2002, 2008, 2011 (bear markets and European crisis, highlighted in green) the option returns are positive when the stock returns are negative. Covered call strategies tend to generate more option premium in periods when equity markets drift lower and volatility remains elevated.
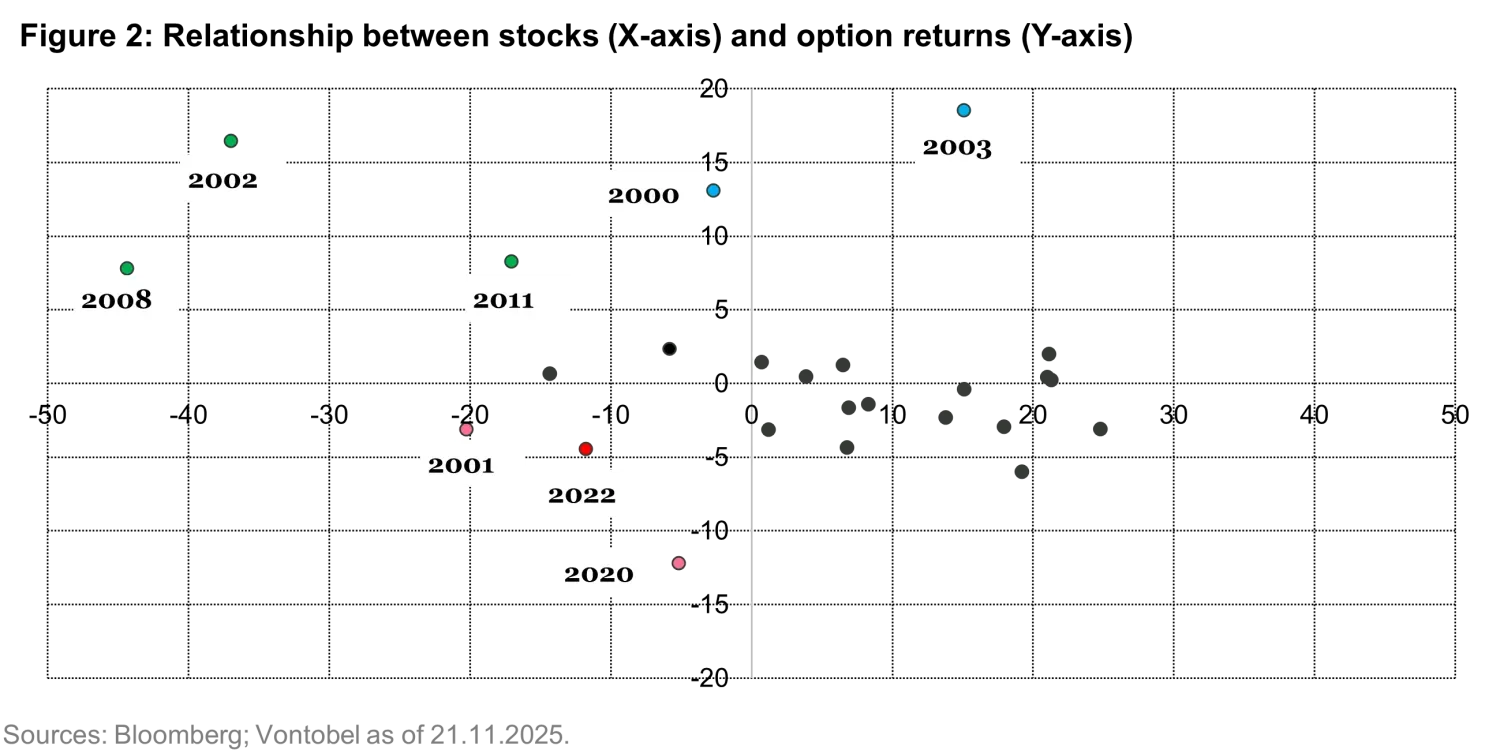
The second cluster of returns, occurring in 2001, 2020, and 2022 and highlighted in red, is characterized by negative stock returns as well as negative option returns. In these periods, diversification failed to provide protection. This outcome reflects the path-dependent nature of purely passive option strategies and underscores the need for active management. Extraordinary market conditions—such as the depth and timing of market declines and the speed of subsequent recoveries—can materially influence outcomes, making reactive and adaptive strategies essential.
Finally, it’s worth mentioning 2000 and 2003 as a third cluster highlighted in blue. There are also years when stock returns are flat or positive and option returns are very positive. These periods featured unusually elevated volatility premia, which supported the covered call income.
Across the full sample, the diversification effect appears more often than it does not. The interaction of the three income sources — each shaped by different forces — helps create a more balanced overall profile over time.
Yearly distribution
To show how the interaction of the three return sources may support sustainable distributions for investors, we ran a simple simulation. It assumes a fund starting with a net asset value (NAV) of 100 at the end of 1999. Distributions are based on realized gains from price returns, dividend returns, and option returns (premium received from selling call options, net of exercise costs) in each calendar year. Figure 3 shows the simulated annual distributions alongside the yield on the 20-year German Bund.
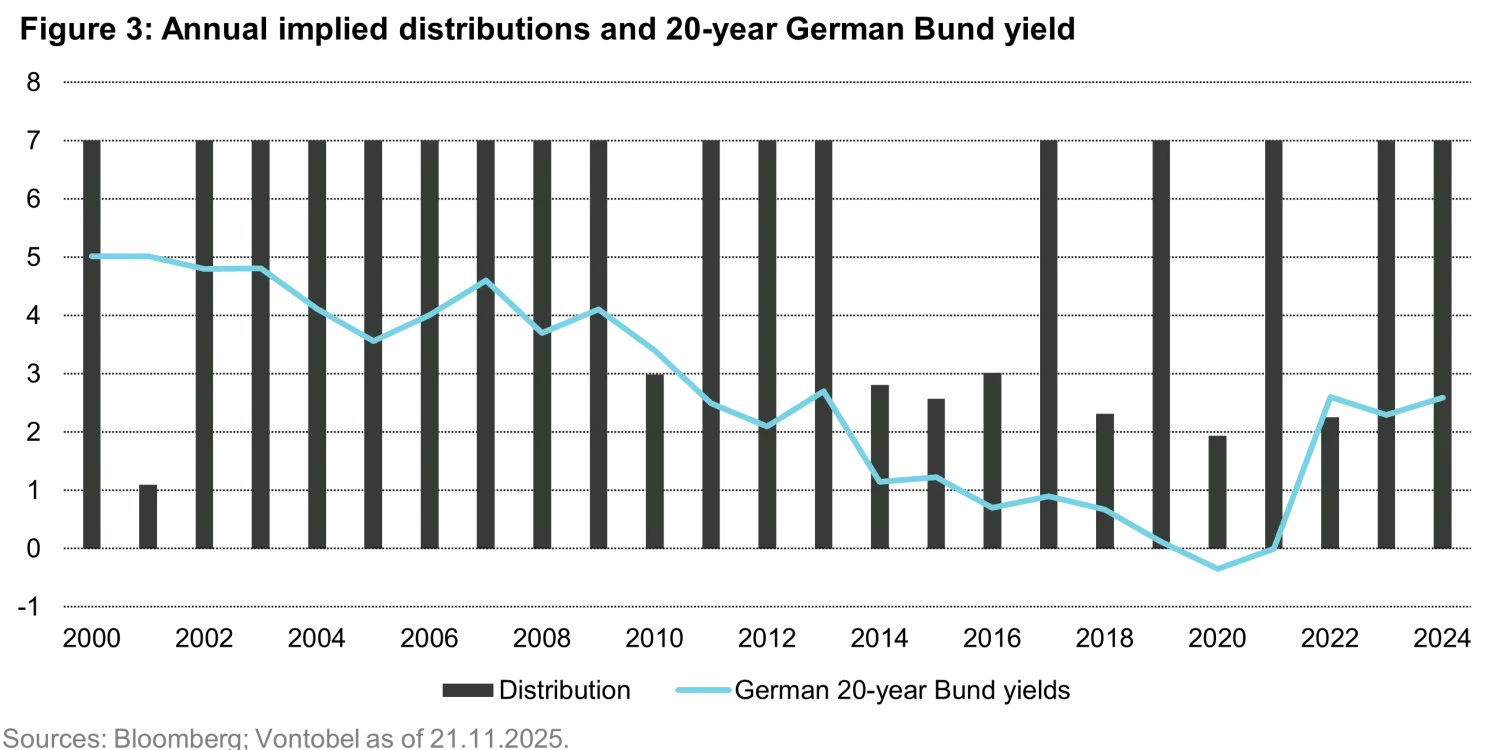
A hypothetical net distribution of 7 euros from an initial NAV of 100 euros would have been met in 68 percent of the years in the sample. The average annual distribution over the full period was 5.52 euros. The starting capital is slightly growing over the entire 25- year period from 100 to 102,6 at the end of 2024. The payment of the distribution can be supported while preserving the initial capital.
Although purely illustrative, the pattern shows that the distribution arises from several independent sources and can therefore vary with economic and volatility conditions rather than interest-rate levels alone. Notably, the simulation produced full distributions even in years when the Euro Stoxx 50 delivered negative price returns, such as 2002, 2008, and 2011.
Conclusion
The 25-year review of a simple passive covered call strategy on the Euro Stoxx 50 shows how stock return, dividend return, and option returns can diversify across different market cycles. This diversification can contribute to a stable income. The period includes four distinct economic contractions for Europe (2000-2002, 2008,2011) and one inflation shock (2022), offering a wide range of conditions for assessing long-term behavior. Each source responded to different market forces, and their interaction shaped the long-term distribution pattern.
Dividend returns were the most stable contributor. Stock returns reflected shifts in the economic cycle, while option returns varied with volatility and the path of market moves. Together, they supported distributions in most years, including several periods when the equity market delivered negative returns. The average distribution exceeded the level of many long-term bond yields, particularly from 2011 onward, during both low-inflation and higher-inflation periods.
The analysis uses a static, rules-based index strategy, but the return structure helps explain how an active strategy such as the European Equity Income Plus strategy can aim to generate a stable 7% yearly income over time. Such active strategies can provide the flexibility to respond to extraordinary market conditions and help mitigate risks in environments that might be unfavorable for purely passive covered call strategies.
Methodology
Stoxx publishes price and total-return indices for the Euro Stoxx 50, as well as a buy-write index that reflects a covered call strategy using monthly index options struck 5 percent out of the money. These indices allow us to separate the three return components underlying a simple passive covered call approach: stock return, dividend return, and covered calls strategy return.
We analyzed these data to reconstruct the return profile of a static, rules-based strategy. The analysis assumes a fund starting with a net asset value (NAV) of 100 at the end of 1999. For illustrative purposes, distributions are based on realized gains from the three return components in each calendar year.
About the authors



Related funds
About the authors
Explore related topics:
Up next:
Towers and the Starlink ThreatRelated insights

Towers and the Starlink Threat

Quarterly Commodity Outlook - Halftime Whistle: Fundamentals Take the Field

Investors’ Outlook: And now for something completely different

Investors’ Outlook: Adjusting the focus

Investors’ Outlook: Strait forward
