King Dollar’s crown is tilting and why emerging markets may benefit
Asset management
Key takeaways
- We believe the early stages of a dollar bear market are underway due to the dollar’s expensive valuation, significant US trade imbalances, fading US exceptionalism, and declining confidence in US institutions.
- Trump’s aggressive stance on trade policy has soured investor sentiment toward the US; global tariffs could lead to a significant US economic slowdown.
- A weaker dollar can boost EM equities and local-currency debt, lower the cost of servicing debt for EMs, allow EM central banks to maintain relatively looser monetary policies, and increase revenues of commodity exporting EM nations.
- The sensitivity of various emerging equities markets to USD fluctuations is far from homogeneous.
Since the end of World War II, the US dollar has reigned as the world’s reserve currency. Foreign governments and central banks hold dollar-denominated assets, such as US Treasuries, to manage their currencies’ FX values, borrow in dollars to shield creditors from FX risk, or simply use the dollar for international payments and trade transactions.
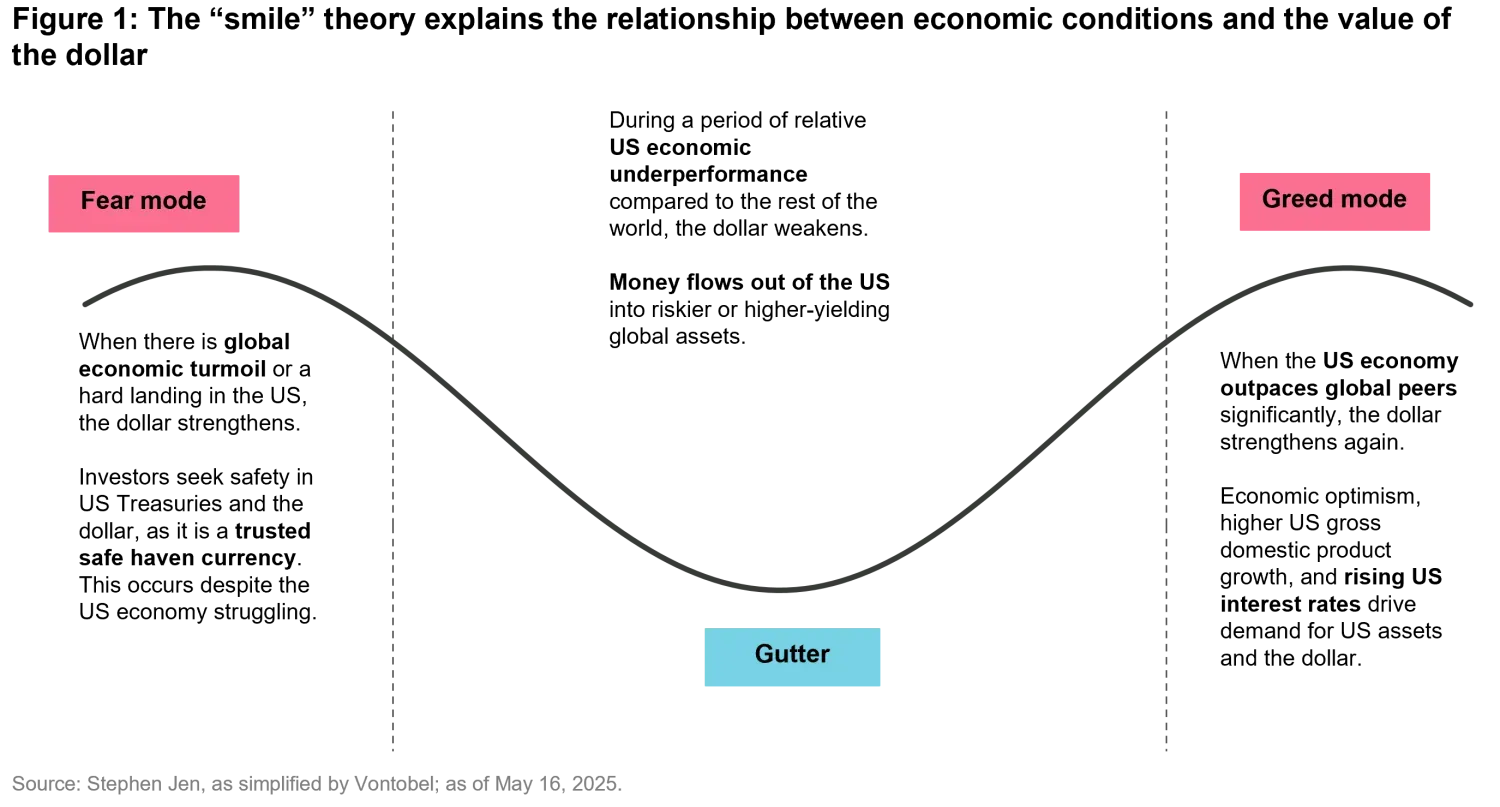
However, the floating exchange rate system1 used by many economies means that even the “king of currencies” is not immune to fluctuations in supply and demand. This is where the dollar “smile” theory comes in. Coined about 20 years ago by economist Stephen Jen, the theory describes how the dollar tends to behave in relation to the health of the US economy. Visually depicted as a smile, the theory suggests that the dollar strengthens during periods of global economic crisis and US economic boom.
The left side of the smile represents a “fear mode” environment, when global economic distress prompts investors to flock to the dollar as a safe haven. The right side reflects “greed mode,” when a strong US economy attracts investment and boosts the dollar. However, the middle of the smile, when the global economy is stable, but the US economy is not necessarily outperforming, often indicates a weaker dollar, figuratively “in the gutter.”
History rhymes: Patterns seen in the 3 major USD downturns since 1970 are in place today
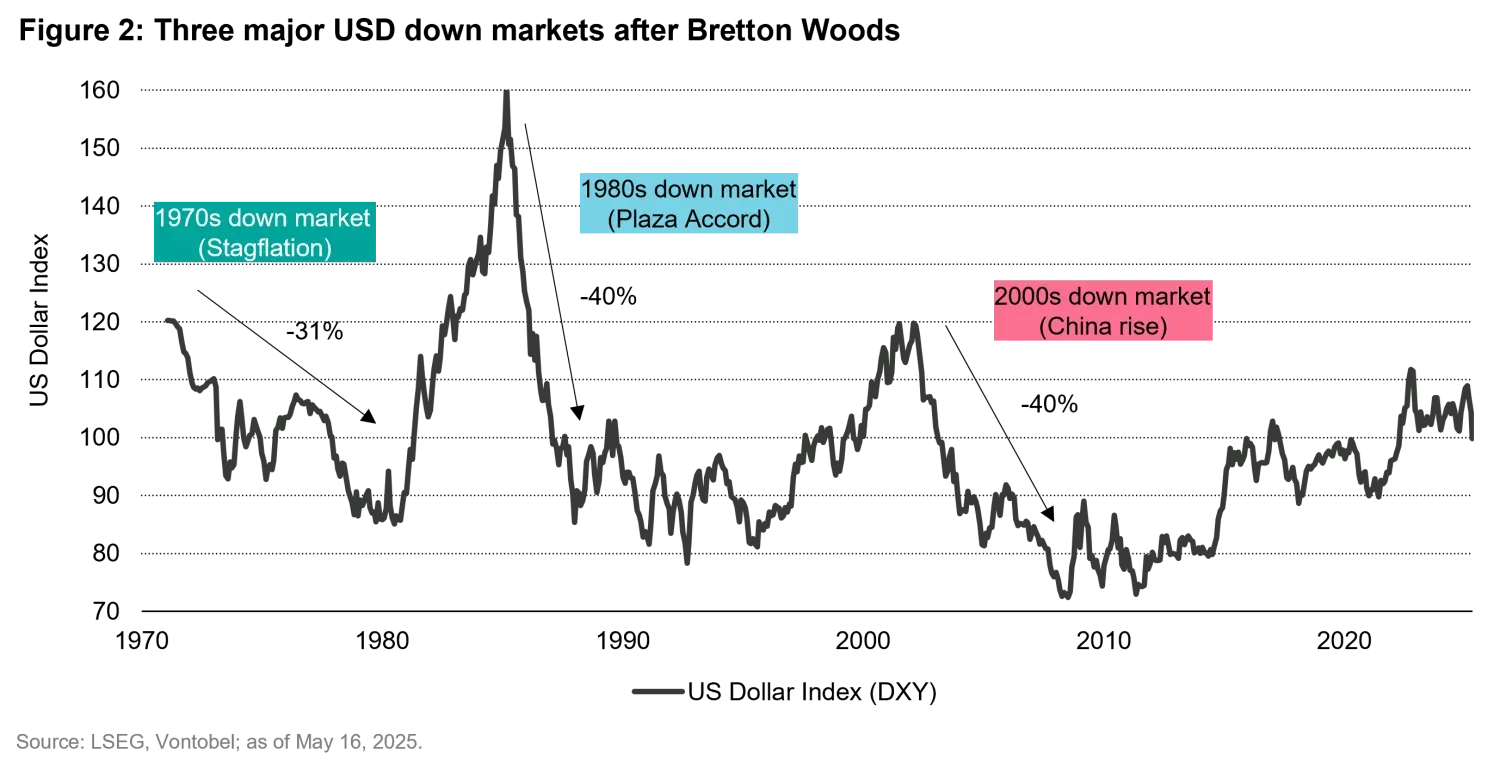
When the dollar stays “in the gutter” for too long, it can slip into a bear market. There have been three bear markets in modern history (Figure 2). The first was triggered by the collapse of the Bretton Woods system. Established in 1944 at the Bretton Woods conference, representatives from 44 Allied nations agreed to peg all non-USD currencies to the USD and tie the USD to the value of gold. Initially, the system worked well. But over time, the US faced mounting economic pressures, including the costs of the Vietnam War, President Johnson’s Great Society programs2, and rising inflation. Meanwhile, Germany and Japan were experiencing rapid economic growth.
By the 1960s, the dollar had become significantly overvalued. Concerned about the dollar’s high valuation and the growing US deficit, other countries began demanding more gold as “cover”3 for their dollar assets. But at this point, the volume of dollars in circulation far exceeded the US gold supply. In 1971, President Nixon ended the dollar’s convertibility to gold – an event known as the Nixon shock. The ensuing dollar bear market lasted until the early 1980s, when US Federal Reserve (Fed) Chair Paul Volcker aggressively raised interest rates.
The second major bear market occurred from 1985 to 1995. Volcker’s restrictive monetary policy, coupled with President Reagan’s expansionary fiscal policy, led to another dollar appreciation. The US was also grappling with a large trade deficit, while key trading partners, such as Japan and Germany, were recording significant trade surpluses.4 The overvalued dollar made US exports expensive and imports cheaper, exacerbating the trade imbalance. To address this issue, the 1985 Plaza Accord was signed between the US, UK, France, West Germany, and Japan, with the goal of depreciating the dollar relative to the Japanese yen and the German Deutsche mark.
The third major bear market lasted from 2002 to 2008. During this period, the US not only ran a significant trade deficit but also increased borrowing to finance tax cuts and military spending. Meanwhile, other economies, particularly China, were growing at a faster pace than the US, prompting investors to seek higher returns in non-US markets. In response to a series of shocks – the bursting of the dot-com bubble, the 9/11 attacks, and the early stages of the global financial crisis – the Fed cut interest rates in an attempt to bolster the US economy and restore investor confidence in US assets5.
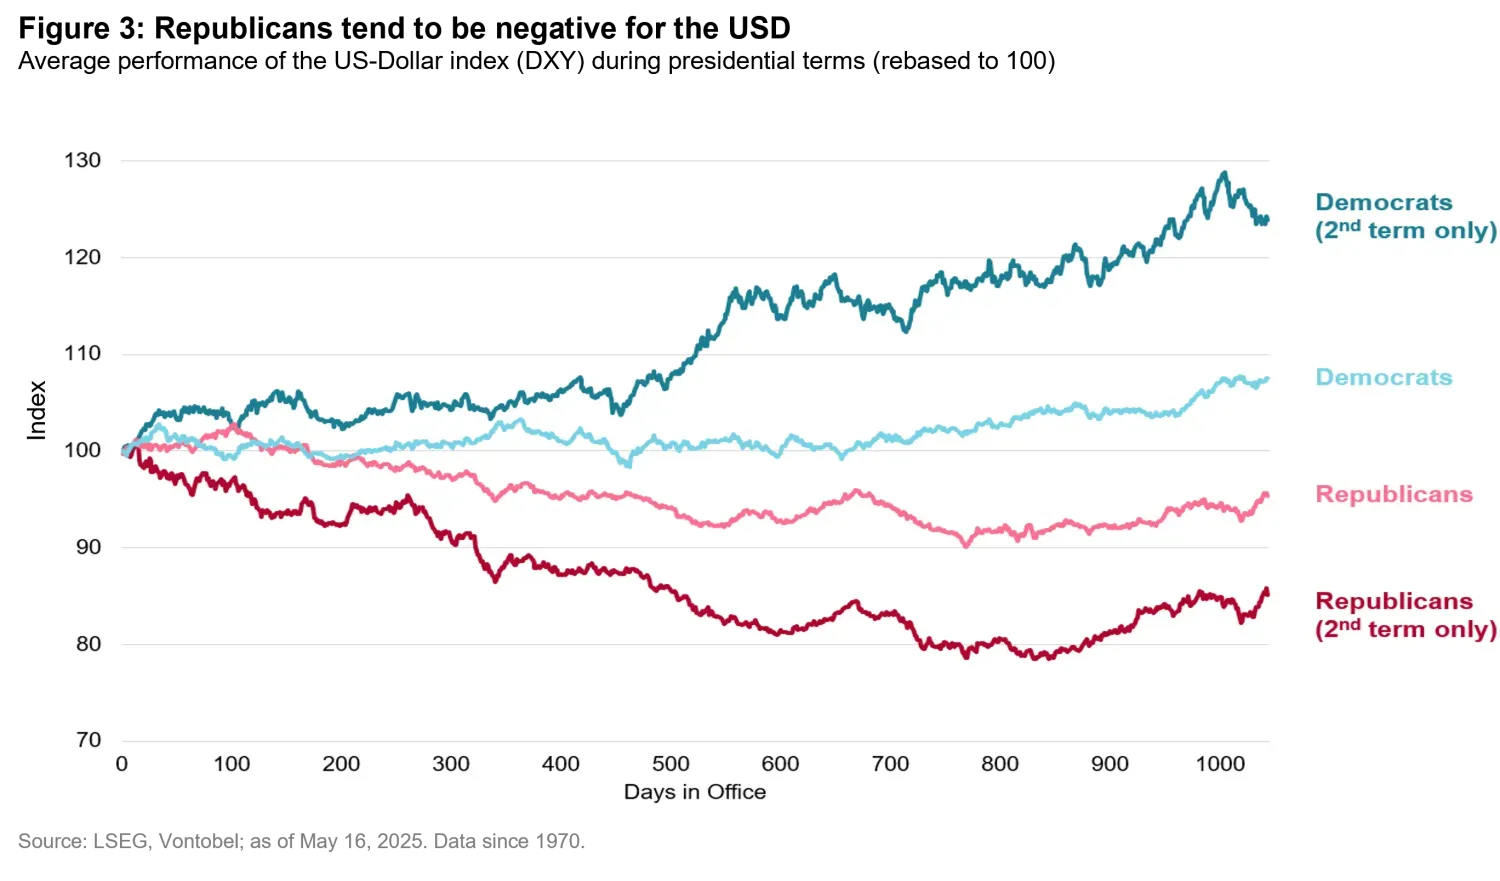
There is a clear pattern from those three historical periods of USD bear markets. They typically occur when one or more of the following conditions exist: the dollar’s valuation is expensive, US trade and fiscal deficits are high, US economic growth outperformance has peaked, investors are seeking non-US assets, the Fed has more room to cut interest rates than other central banks, and/or geopolitical risks are at a high point. Interestingly, all three major dollar bear markets occurred while a Republican President was in office.
In today’s world, investors are questioning whether the dollar is on the verge of another bear market. We believe the answer is yes, for the following reasons:
1. Once again, a Republican president is in the White House and he has openly expressed a preference for a weaker greenback6.
2. The dollar appears richly valued from a purchasing power parity7 perspective, which has historically been a common precursor to devaluation.
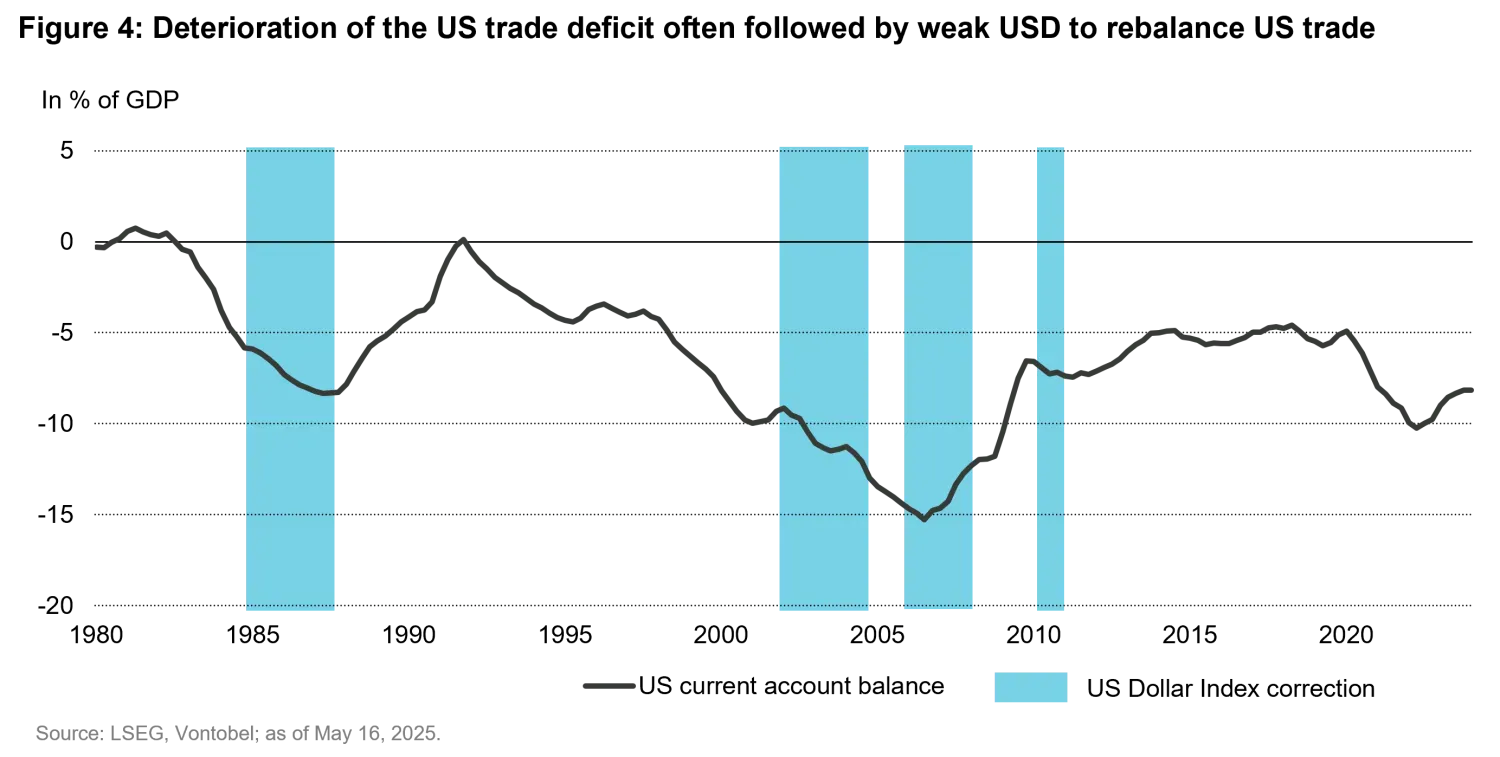
3. The US economy is facing significant trade imbalances, with the country’s goods and services deficit at USD 140.5 billion8. Although this goods and services trade deficit is not as large as the previous dollar bear market in 2006, when it stood at 5.4% of gross domestic product (GDP), it was still a substantial 3.1% of GDP in 2024 and widened to 3.4% in Q1 of 2025. A weaker greenback could help rebalance US trade by making US exports cheaper for foreign buyers and imports pricier for US consumers.
4. The federal budget deficit is estimated to have totaled USD 1.1 trillion in the first seven months of the fiscal year 20259, which is USD 196 billion more than the same period in the previous year. The fiscal deficit stood at 6.9% of GDP in 2024, and it is projected to widen further with Trump’s proposed tax cuts, putting public debt on a clearly unsustainable path. This, combined with high nominal interest rates, has resulted in the US government spending more on its debt servicing costs than on defense – a situation that’s hardly sustainable.
5. There are mounting signs that the era of US growth exceptionalism we have become so accustomed to – especially in the aftermath of the Covid-19 pandemic – may be fading. This is partly due to President Trump’s policy approach, which has wreaked havoc on US consumer and business sentiment, and partly due to other, country-specific reasons (e.g., Germany’s unexpected reform of the debt brake). According to a Bloomberg survey, economists have significantly cut their US GDP forecasts (Figure 5). Lower US growth outperformance could prompt the Fed to cut interest rates more than other central banks and reduce the dollar’s yield advantage.

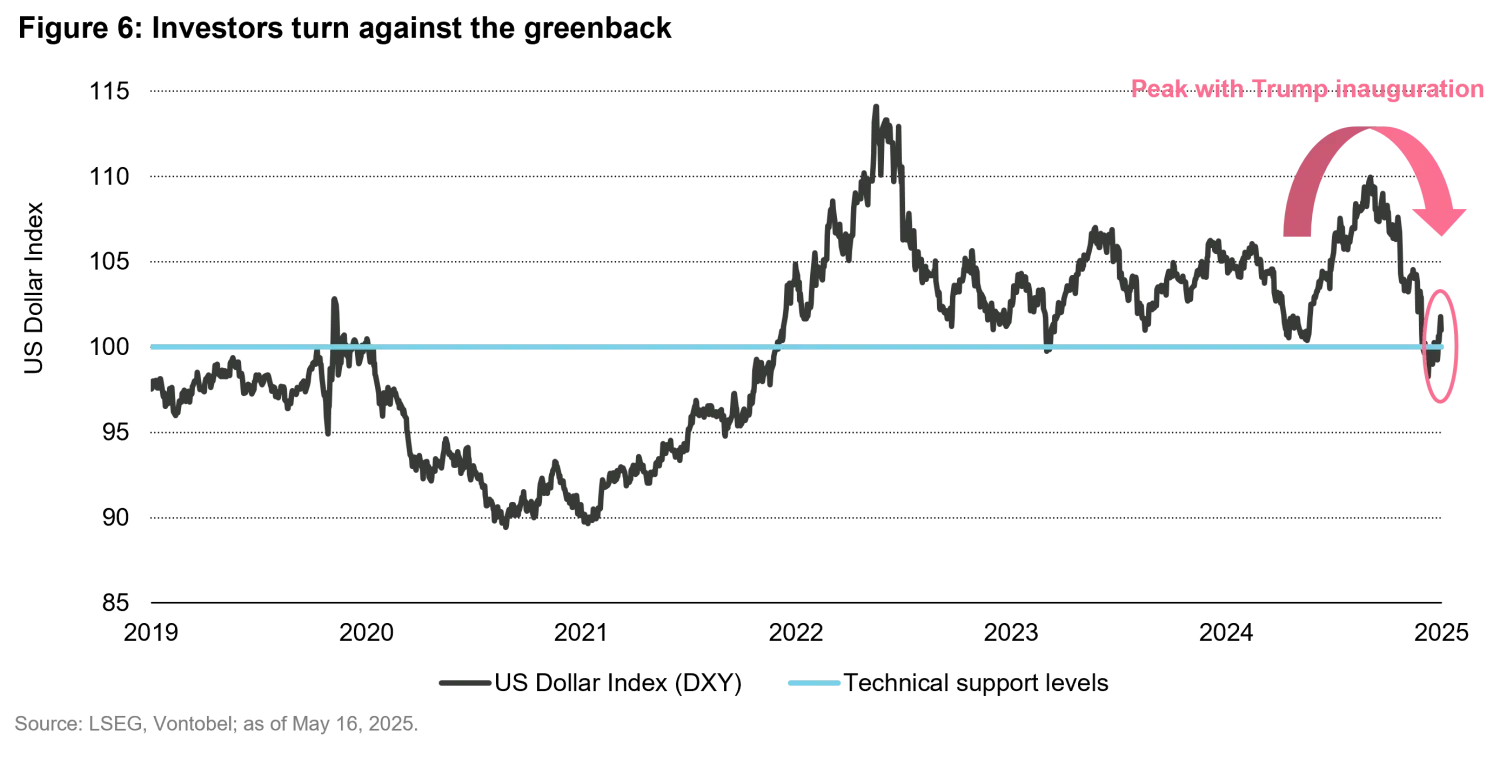
6. Trump’s “maximum pressure” stance on trade and foreign policy has soured investor sentiment toward the US, triggering outflows from dollar-denominated assets and contributing to a weaker dollar (Figure 6).
Trump’s first trade war in 2018 resulted in a strong dollar, why is it different this time?
Trump’s first term was characterized by stronger US growth relative to the rest of the world, which was further boosted by tax cuts. The fact that the US imposed tariffs solely on China led to a weakening of the Chinese currency to partially compensate for the loss in competitiveness. Other emerging market (EM) currencies weakened in tandem, as the shock further exacerbated the US economy’s relative strength. Trade diversion ensued, which softened the impact on the US consumer. However, in Trump’s second term, the US is imposing tariffs globally. This means that US consumers cannot simply import cheap products from a different source when all countries are subject to tariffs. In this context, it is likely that the US economy will suffer a more significant slowdown than the rest of the world, thereby losing some of its exceptionalism. Thus, placing the dollar in the middle of the smile.
A final, yet crucial, factor is a decline in confidence. The strength of US institutions has underpinned the dollar’s global reserve currency status for decades. However, recent unpredictability in trade policy and President Trump’s challenges to the Fed’s monetary policy independence have eroded part of the long dated, unquestioned confidence in the dollar. Moreover, the timing could not have been worse: the US public debt appears to be on an unsustainable trajectory, yet a bipartisan consensus seems to be ignoring this risk. The last thing the markets needed was to begin questioning the Fed’s independence and its willingness and ability to maintain price stability instead of succumbing to the Treasury (fiscal dominance) by inflating away government debt.
In other words, while the Fed may still maintain higher nominal interest rates than most developed markets, its real monetary policy rate (after accounting for expected inflation) appears much less attractive. That’s because the tariff shock is inflationary for the US but disinflationary for the rest of the world. And not just via the currency valuation channel that we will explain below, but also because lower US imports will likely result in a relative oversupply of durable goods for the rest of the world and lower prices for certain tradable products.
Risks to our bearish dollar view
While we believe a dollar bear market is likely, there are some risks that could temporarily challenge this view. Although the dollar’s safe haven appeal may have lost some of its luster, it could start to shine again – for example if the Fed acts too hawkishly or if there is a deep recession.
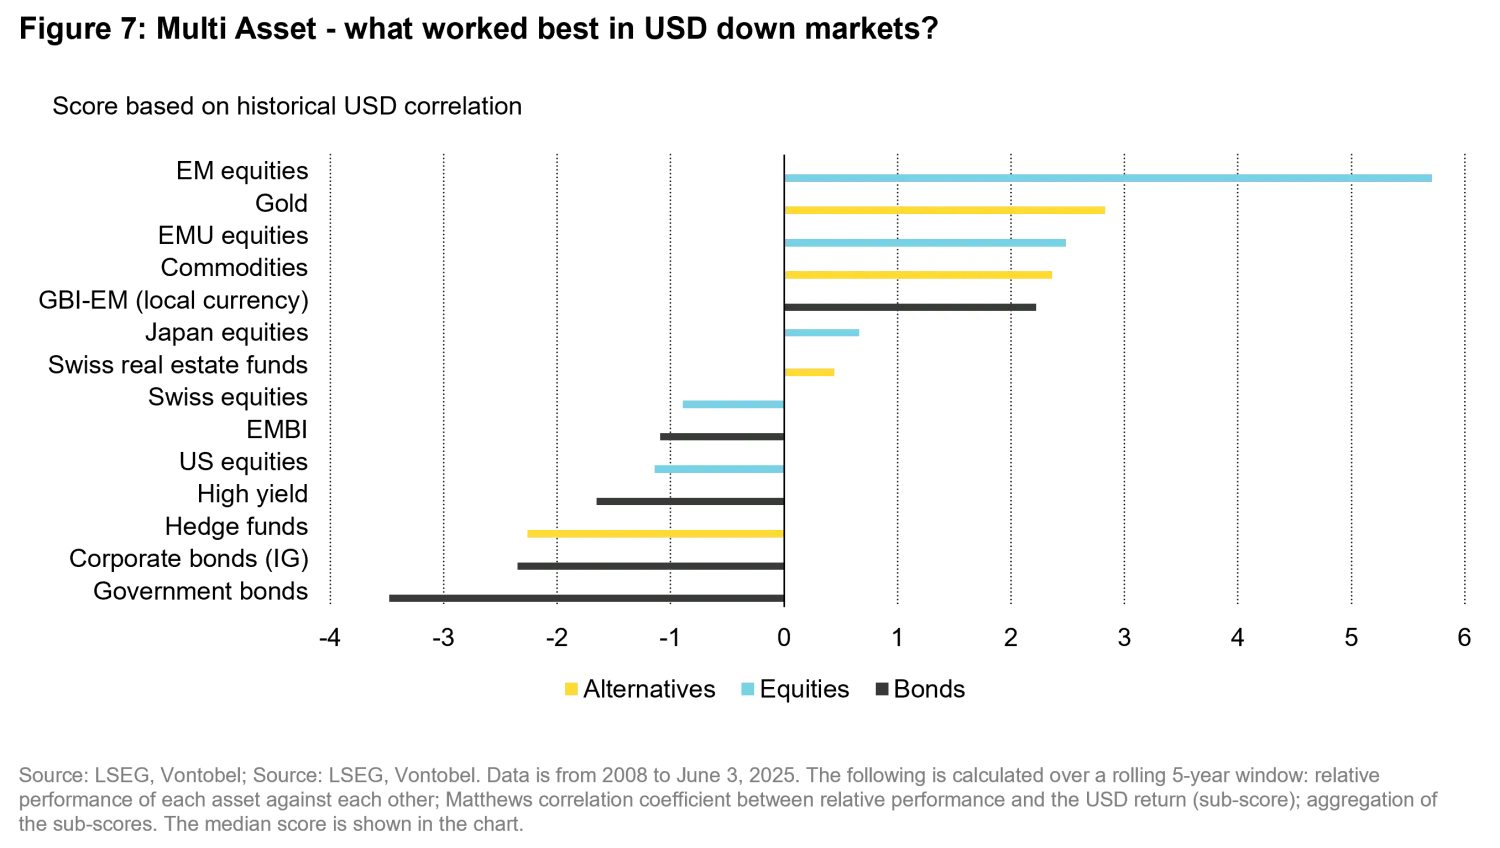
From a historical perspective, past dollar bear markets created a few (unsurprising) winners and losers. EM and European equities, gold, and commodities fared best while government and corporate bonds fared worst (Figure 7). Why do we call this “unsurprising”?
Many EM sovereigns and corporates borrow in dollar terms. When the USD depreciates, dollar-denominated debt in EM countries becomes cheaper to service, easing financial pressure on governments and corporations, and freeing up more capital for growth and investment. This first channel is particularly beneficial for hard-currency sovereign and corporate debt. However, it also leads to improved investor sentiment and capital inflows into all EM assets, including equities and local-currency debt, as investors seek higher yields and growth potential.
A weaker dollar also makes goods and services cheaper to import for EM countries. A weaker dollar is thus disinflationary for EM countries, which allows EM central banks to maintain relatively looser monetary policies. Cheaper imports and looser monetary policy conditions boost consumption and strengthen these economies. Moreover, while the immediate channel works through consumption, medium-term it also boosts investments because imported capital goods have become cheaper for EM producers and relatively lower domestic interest rates also reduce the cost of capital. These channels are particularly positive for EM equities, where returns are more dependent on growth prospects (via expected earnings) than in the case of debt. That said, higher growth also improves debt sustainability and stronger EM currencies result in lower debt stocks for EM external borrowers.
A weaker dollar usually incentivizes investors to look for higher returns elsewhere, such as in EM, in expectation of further dollar weakness. This momentum can create further currency strength for EMs and Europe, boosting non-US dollar-denominated asset valuations like European and EM equities, and local-currency debt.
Many EM countries are heavily dependent on commodity exports. Since commodities are generally priced in dollar terms, a weaker dollar can lead to higher commodity prices. This in turn, can boost the fiscal revenues of commodity exporting EM nations (via taxes and royalties) and the profitability of EM commodity firms. Moreover, current account balances of commodity exporting countries tend to improve during these periods, which generally results in stronger EM currencies and therefore a positive feedback loop. As shown below, this channel tends to be particularly beneficial for EM debt (both in local and hard currency) given that the share of commodity exporting countries tends to be higher in these indices than for the more predominantly industrialized countries that are more prominently represented in EM equities.
In this current dollar weakness event, gold prices have soared. Other industrial metal prices have remained relatively high, but they have not benefited significantly from the dollar’s weakness. This is due to uncertainty about the demand for these products amid a likely global economic slowdown. Oil has not benefited from this environment. In fact, expected economic weakness and recent increases in oil supply by OPEC+ have resulted in lower oil prices, despite the weaker dollar. Gold-exporting countries such as Ghana, and particularly those that hold a large share of their FX reserves in gold, such as Uzbekistan, Tajikistan, and Kyrgyzstan, have benefited disproportionately in this environment. The latter will soon issue its first Eurobonds, while the others are part of the hard-currency sovereign debt benchmark. Other commodity exporters that are also oil importers, such as Chile, Peru, Brazil, South Africa, and Indonesia, enjoy favorable trade terms. However, trade terms for oil-exporting nations like Angola and Nigeria have deteriorated significantly.
A weaker dollar directly boosts EM local-currency asset valuations for both equities and bonds. This is because investors need more dollars to purchase the same amount of assets denominated in any EM currency when the dollar is weaker. And, when EM central banks do not need to defend their currencies against an appreciating dollar, lower domestic interest rates result in higher asset valuations by boosting the net present value of future dividends (for equities) and coupons (for bonds) payments. This direct effect may be somewhat underappreciated, but it is, in our view, the most important one and the main reason why EM equities and local-currency EM bonds have outperformed hard-currency EM debt during dollar bear markets, as shown above in Figure 7.
The sensitivity of various emerging equities markets to USD fluctuations is far from homogeneous
While emerging stocks often outperform during periods of USD weakness, the impact is not uniform across various emerging economies. If, overall, a sustained weak dollar typically provides tailwinds for EM growth, asset valuations, and investor risk appetite, both macro factors (high current account deficits, political instability, share of currency-denominated debt) and industry specialization can explain that some emerging currencies and stock markets are reacting, on average, much more than others to changes in USD value.
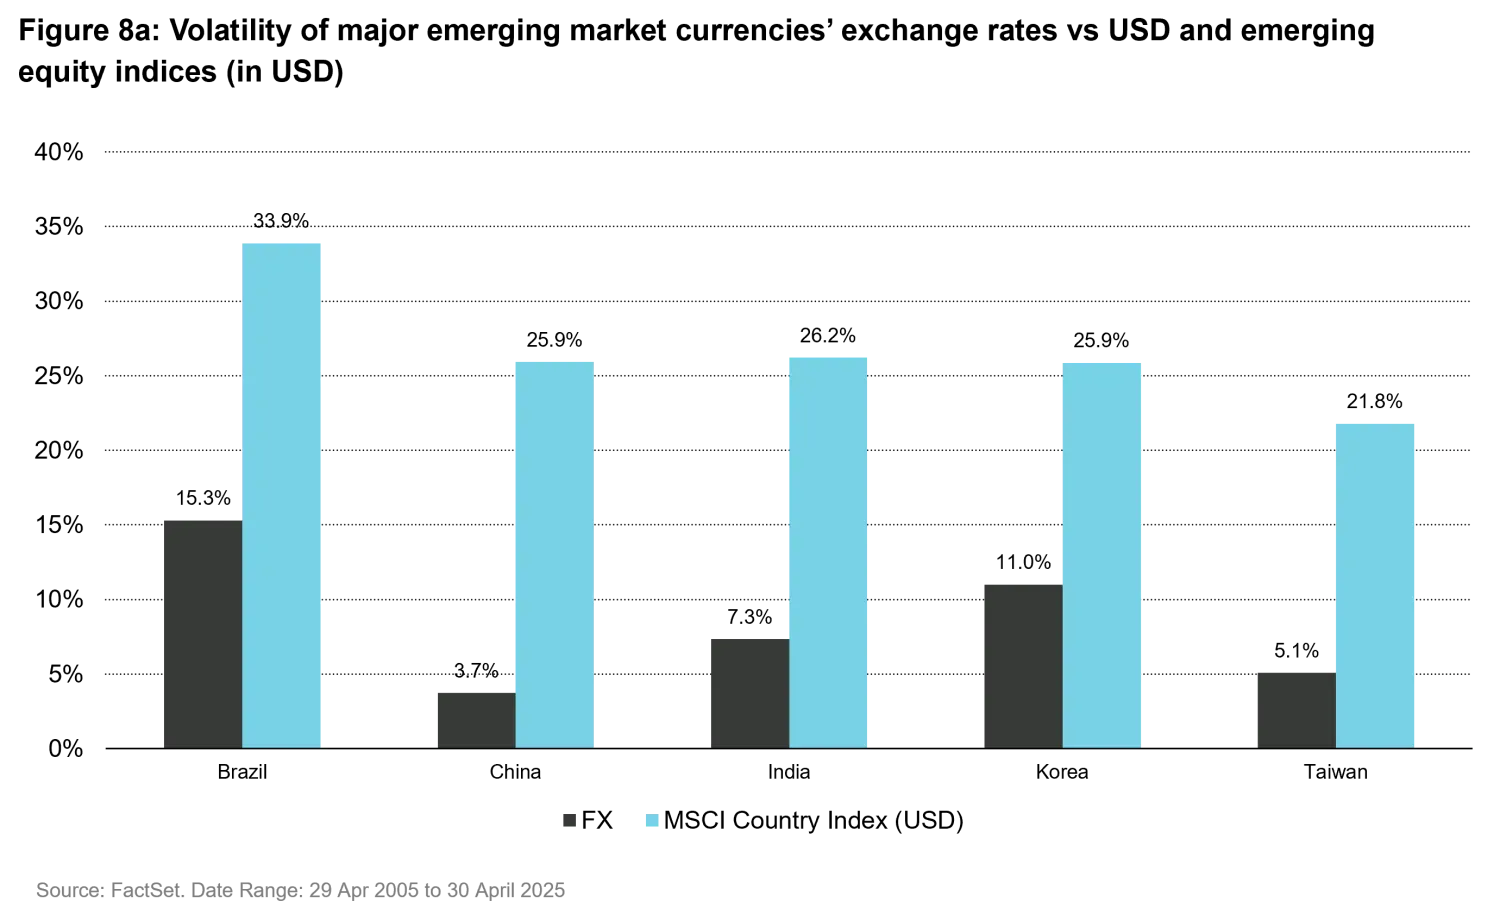
Figure 8a shows the historical volatility of main emerging currencies vs the USD over the period 2005-2025 as well as the volatility, for an investment realized in USD, of the corresponding equities markets. To a large extent, the lower volatility in USD of the Taiwanese stock market is the result of much lower volatility of the TWD vs the USD. Brazil is exactly in the symmetric situation.
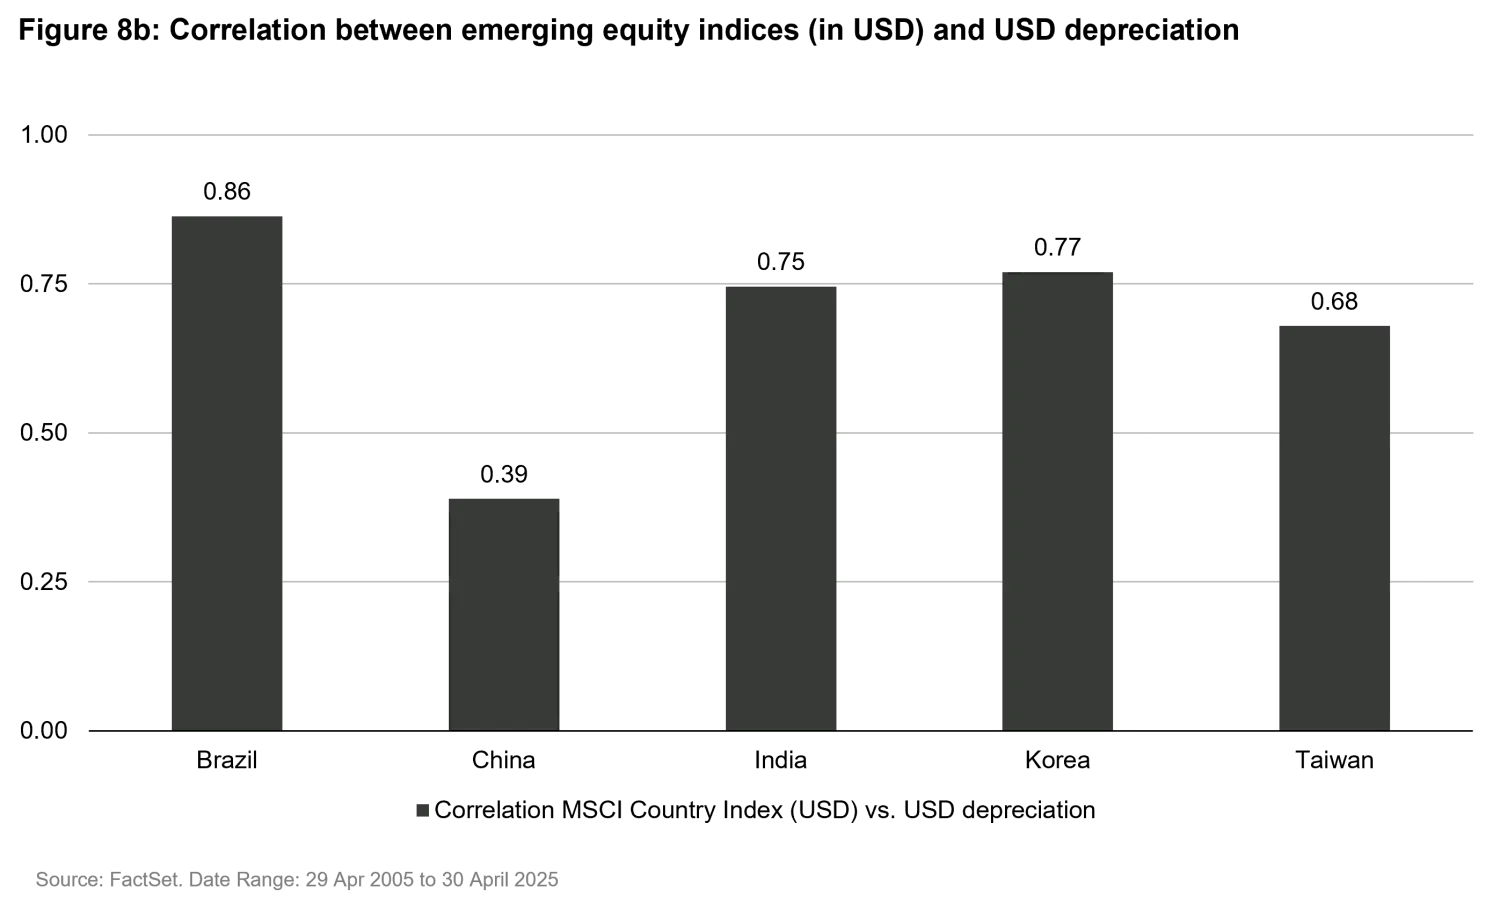
Figure 8b highlights the correlation between the same emerging equities markets and dollar depreciation. Their positive sign reflects the view that all those markets would react positively to USD depreciation, some more than others, as both the result of their higher sensitivity to the changes in their currency exchange rates but also their own structure (opening of the domestic economy, industry specialization…). Brazil and Korea are the two emerging markets likely to react the most positively to USD depreciation, while China, which is much less dependent on exports and has a less volatile currency, would be the least sensitive.
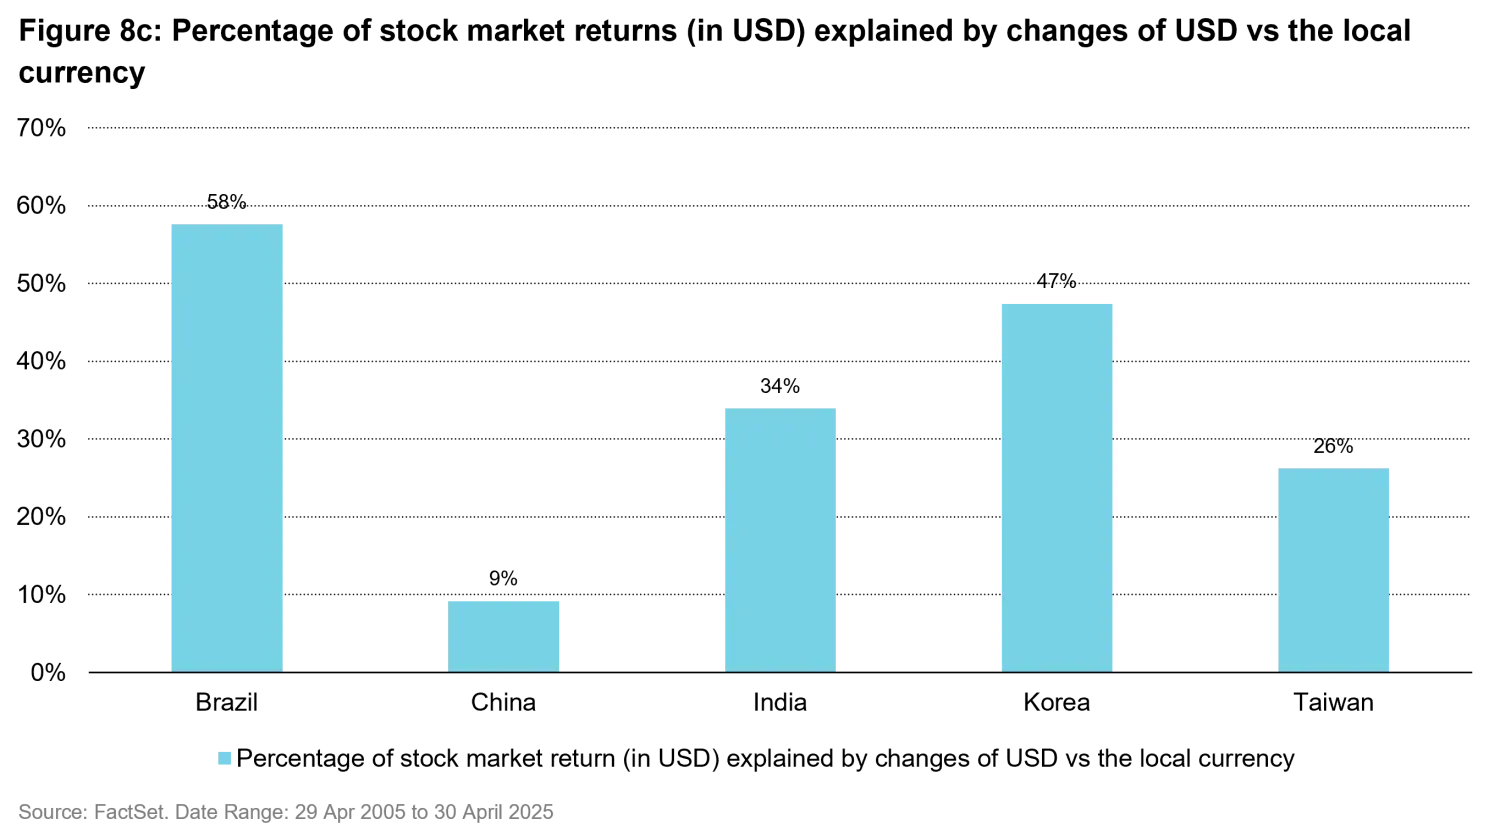
Figure 8c provides an estimate of the share of emerging equities indices moves likely to be explained by a change in the exchange rate between their local currency and the USD. Logically, moves in Brazil and Korean indices are likely to be explained by 50% or more by USD moves, while this percentage is lower for India and Taiwan, and very small for China.
From a USD investor’s perspective, only 42% of Brazil’s market returns over the last 20 years were attributed to local equity performance, with 58% driven by FX movements—highlighting the impact of BRL volatility. In contrast, China’s market returns have been largely unaffected by FX changes over the past two decades, although the influence of currency has increased more recently.
Overall, Brazil emerges as the most volatile and USD-sensitive market, while Taiwan stands out for its relative stability. These findings offer valuable insights for risk management, currency hedging, and allocation strategies in global equity portfolios—especially in a shifting USD environment.
Predictions about the dollar losing its status as the world's reserve currency are not new. For years, BRICS10 nations have discussed creating a dollar alternative backed by their own currencies. China's 2013 Belt and Road Initiative11 was also widely regarded as an attempt to reduce China’s dependence on the dollar and promote trade and investment in the yuan. More recently, the Russia-Ukraine war and the subsequent freezing of the Russian central bank’s FX reserves by Western nations reignited the de-dollarization efforts. At the 2024 BRICS summit in Kazan, Russia, participants revisited the idea of a reserve currency (dubbed “the Unit”) potentially backed by gold. Russian President Vladimir Putin even presented what appeared to be a prototype of a BRICS banknote.
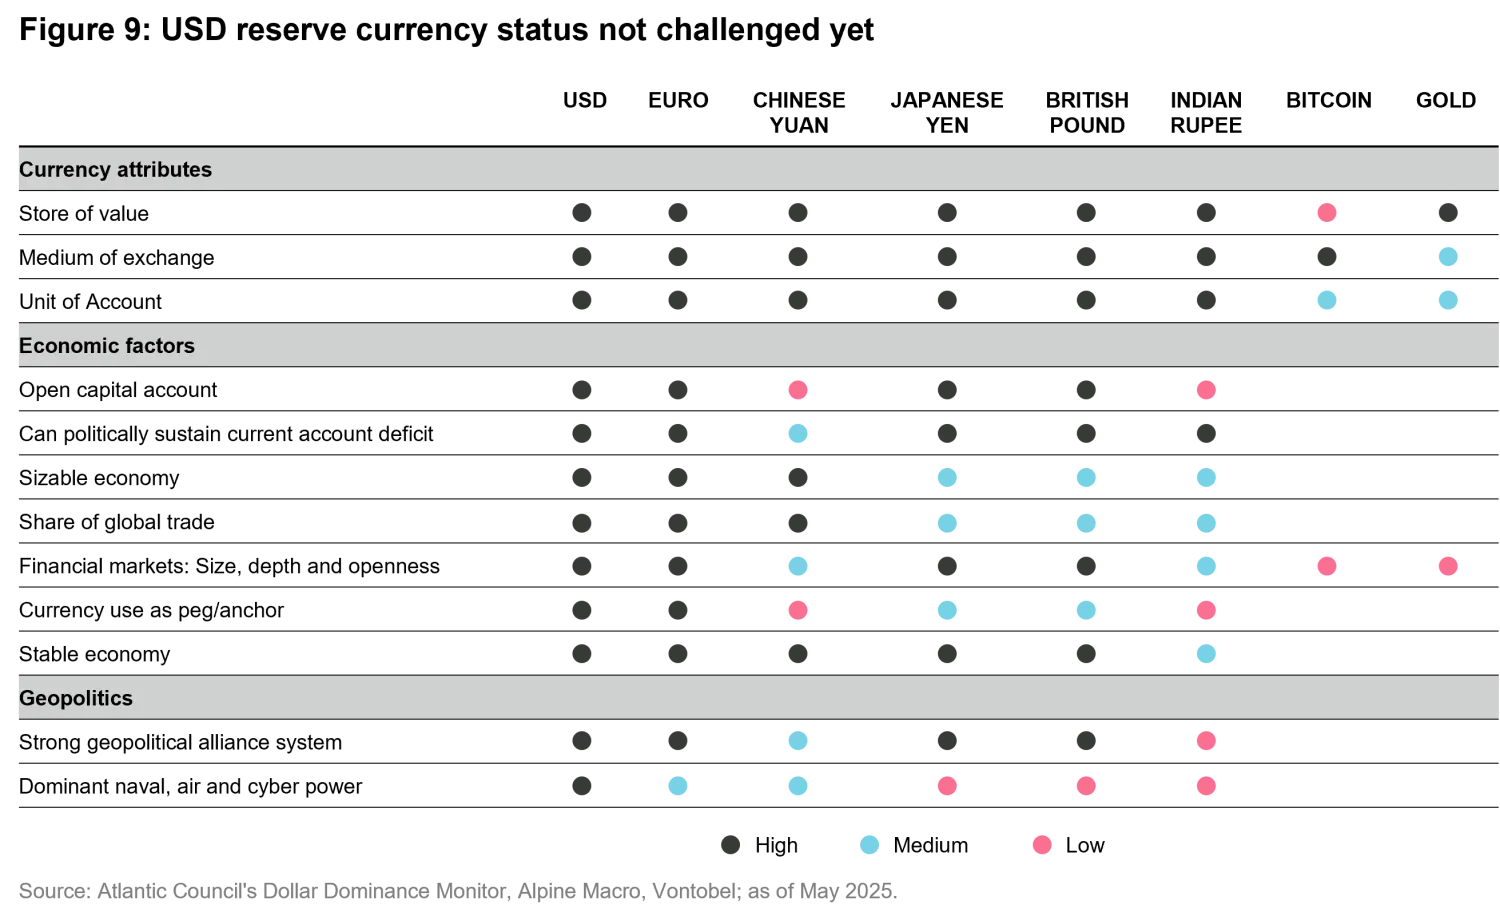
While we expect a structurally weaker greenback, we don’t believe its reserve currency status is under serious threat. Any currency aiming to take on that role must meet several important criteria. First and foremost, it must serve as a reliable store of value, a widely accepted medium of exchange, and a unit of account. Second, the country issuing the currency should also tick several boxes.
Although there is no definitive checklist, an analysis by the US Treasury Department provides a good starting point: 1) the size of the domestic economy, 2) the importance of the economy in international trade, 3) the size, depth, and openness of financial markets, 4) the convertibility of the currency, 5) the use of the currency as a peg, and 6) domestic macroeconomic policies.12 Ideally, the world’s reserve currency should also fulfil several “geopolitical criteria.” This means that the country issuing the currency should be able to draw on the strengths of a strong geopolitical alliance system and possess dominant naval, air, and cyber power. Figure 9 suggests that while there are potential contenders, the dollar still clearly outpaces its rivals in meeting these key criteria for reserve currency status. 13
1. A floating exchange rate system is when a country’s money value goes up and down freely depending on how much people want to buy or sell it, rather than being fixed by the government.
2. Set of government initiatives launched in the 1960s to reduce poverty, improve education, provide healthcare, and promote civil rights in the US.
3. Gold reserves used to guarantee or support the value of dollar-denominated assets held by foreign governments.
4. This means that the US imported more goods, services, and capital than it exported, while other countries exported more than they imported.
5. Lower US interest rates can reduce the returns of dollar-denominated assets.
6. Source: Bloomberg article, published July 18, 2024. https://www.bloomberg.com/opinion/articles/2024-07-18/trump-s-weak-dollar-clashes-with-inflation-other-economic-priorities
7. Compares the value of different currencies through the cost of a common basket of goods and services and is often used to assess whether a currency is undervalued or overvalued relative to another.
8. Source: US Bureau of Economic Analysis, March 2025
9. Source: Congressional Budget Office
10. BRICS nations were originally composed of Brazil, Russia, India, China and South Africa. As of 2025, there are 10 member nations: Brazil, Russia, India, China, South Africa, Egypt, Ethiopia, Indonesia, Iran and the United Arab Emirates.
11. China’s plan to invest in roads, railways, ports, and other projects around the world to make trade easier and strengthen its global influence.
12. Source: US Treasury Department’s “Report to Congress on International Economic and Exchange Rate Policies” (2009), https://home.treasury.gov/system/files/206/FXReportFINALOctober152009.pdf
13. Source: The Atlantic Council’s Dollar Dominance Monitor (2025), https://www.atlanticcouncil.org/programs/geoeconomics-center/dollar-dominance-monitor/
Views expressed in this material are the views of Vontobel and are subject to change without notice, as of the date of this material. In preparing this material we have relied upon and assumed, without independent verification, the accuracy and completeness of all information available from public sources. Opinions and estimates involve assumptions that may not prove valid.
Further, this material contains projections and other forward-looking statements regarding future events, targets, or expectations. Such statements are based in part on current market conditions, which will fluctuate and may be superseded by subsequent market events or other factors. Historical market trends are not reliable indicators of future market behavior or the future performance of any particular investment and should not be relied upon as such.
The analysis provided does not constitute and should not be interpreted as an endorsement of any political party.
About the authors


Related strategies
About the authors
Topics:
Related insights

Fundamentals, technicals, and complacency are outweighing uncertainty

Somewhat reopened is good enough for EM fixed income

Replay: Rates, credit & market reality — what matters now?

Cracking the code of emerging-market debt: What every investor should know

Power moves: The new energy order
