Emerging Markets Bonds
A high-conviction and contrarian approach, combining bottom-up and relative-value strategies.
Uncertainty remains elevated in the second half of 2025, with key risks including shifting tariff policies, muted earnings growth, geopolitical tensions, concerns over US debt sustainability and US Federal Reserve leadership, as well as stretched valuations across equities and other risk assets. In Europe, investor concerns have deepened following the increase in tariff rates to 15%.
Against this backdrop, emerging-market investment grade (EM IG) bonds appear to us as a compelling alternative for investors seeking long-term income and portfolio resilience, while also offering diversification away from US policy-driven risks.
However, dedicated EM IG strategies remain scarce. This underrepresentation reflects both the asset class’s rapid evolution over the past decades and the persistent perception risks associated with EM, which have slowed its broader inclusion in core fixed-income allocations.
Crucially, dispersion across EM IG issuers can create fertile ground for active managers to generate excess (higher) returns through spread optimization and issuer diversification. We believe that EM IG is an increasingly relevant opportunity for active investors aiming to enhance yield without materially increasing portfolio risk.
Over the past decade, the EM debt universe has expanded significantly, growing from USD 1 trillion to more than USD 3 trillion (based on BofA Merrill Lynch EM indexes).
In major sovereign EM indices, the share of IG bonds has risen from less than 10% in the mid-1990s to around 60% today. This shift partly reflects the adoption of more prudent macroeconomic policies across many EM countries, enabling them to better absorb external shocks, reduce vulnerability to volatile capital flows, and strengthen overall credit quality. Countries such as Oman, Azerbaijan, Serbia, and Paraguay have been upgraded to IG in the last few months, just to name a few examples. Simultaneously, The AA/A+ bucket weight has also increased, supported by large issuance volumes from highly rated Gulf countries such as Saudi Arabia, the United Arab Emirates, and Qatar. In corporate EM indices, IG issuers now account for roughly two-thirds of market capitalization.
When comparing annualized returns with annualized volatility over the past decade, EM IG corporates stand out to us as one of the most attractive asset classes for investors with a low-risk budget, often offering higher returns and lower volatility than US IG products (see chart 1).
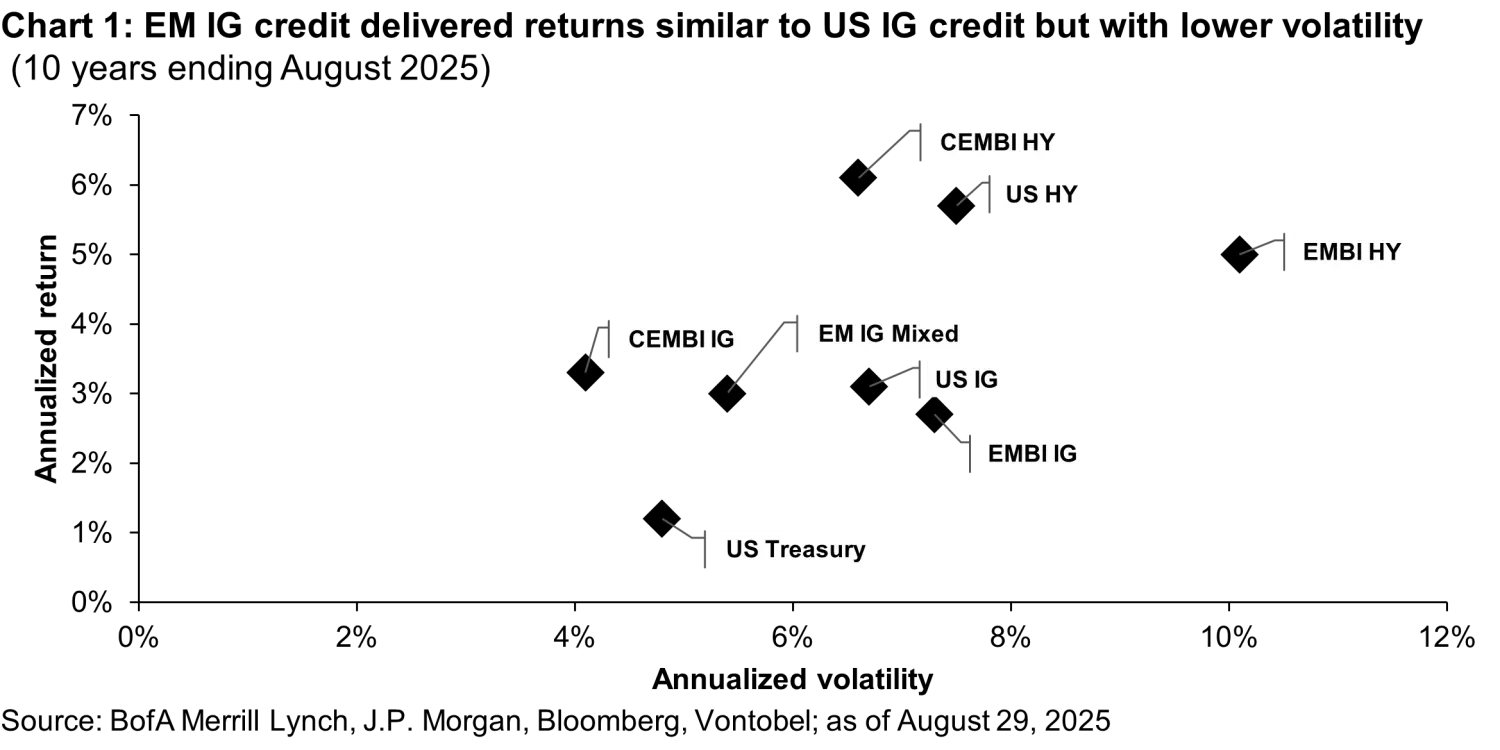
Over the past decade, EM IG corporate has delivered an annualized return of approximately 3.3%, slightly above the 3.1% offered by US IG. More importantly, this return was achieved with significantly lower annualized volatility (4.1% versus 6.7%). In comparison, EM IG sovereign returned 2.7%, held back by its longer duration, which was a drag during the sharp rise in global interest rates in 2022. However, EM sovereign bonds typically offer greater liquidity, with larger average bond sizes and a broader issuer base than EM corporates. Interestingly, the relatively lower trading activity in EM IG corporates can act as a defensive feature in periods of heightened market volatility.
From a risk-adjusted perspective, EM IG corporates delivered a higher Sharpe ratio (0.21) compared to US IG over the period. A mixed EM IG 50% sovereign / 50% corporate allocation produces a Sharpe ratio of 0.13, comparable to that of US IG at 0.14, offering diversification without sacrificing return per unit of risk.
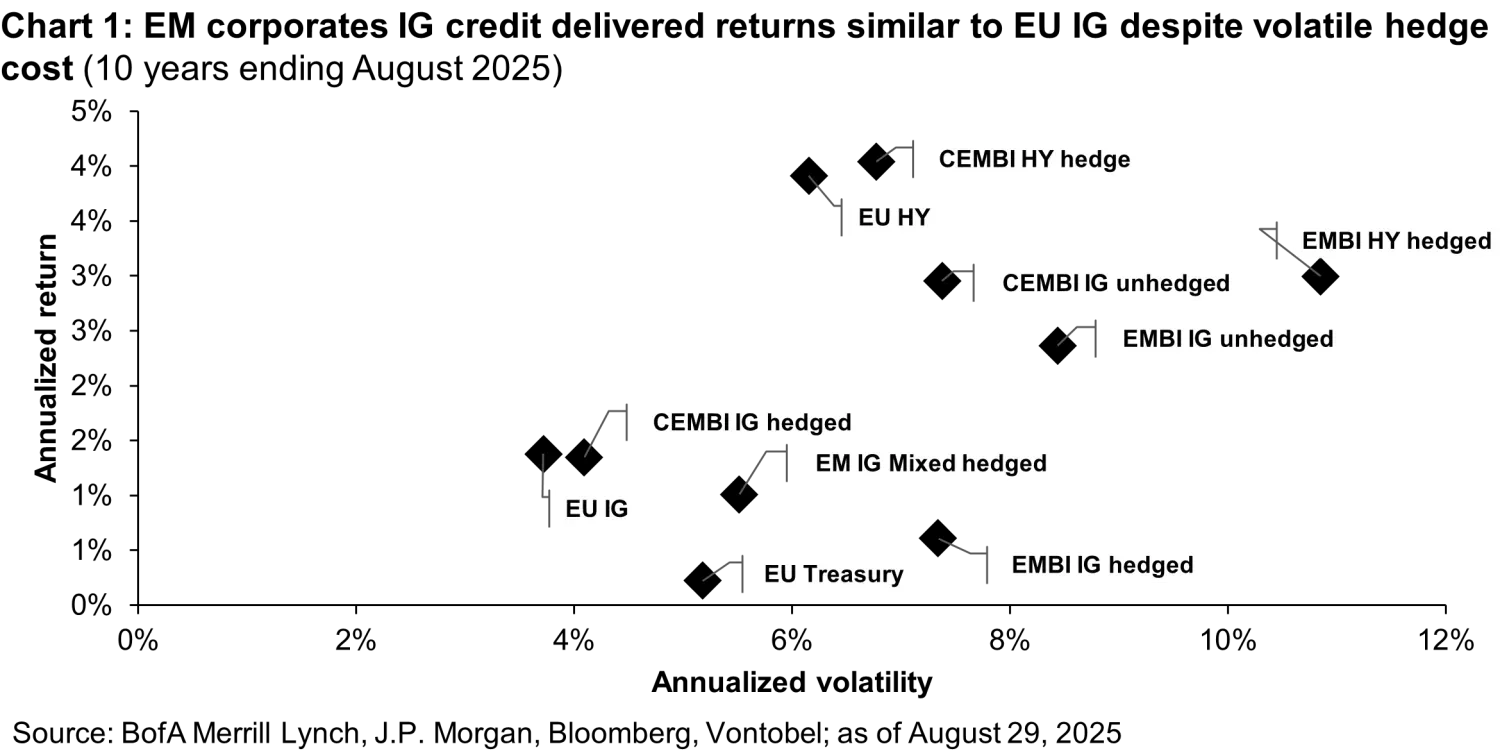
When comparing the same EM IG USD indices hedged into EUR with the Euro IG corporate index, the results are a bit less compelling. Hedged EM IG corporates delivered an annualized return of 1.3%, slightly below the 1.4% achieved by Euro IG corporates, despite an average hedge cost of -1.8% on the period (1M forward). EM IG corporates annualized volatility was also higher at 4.1% versus 3.7% for Euro IG, driven by FX hedge cost fluctuations. Interestingly, unhedged EM IG corporates and sovereigns not only delivered higher annualized returns but also superior Sharpe ratios: 0.34 for EM IG corporates unhedged and 2.23 for EMBI IG unhedged, compared with 0.17 for Euro IG corporates and 0.14 for hedged EM IG corporates.
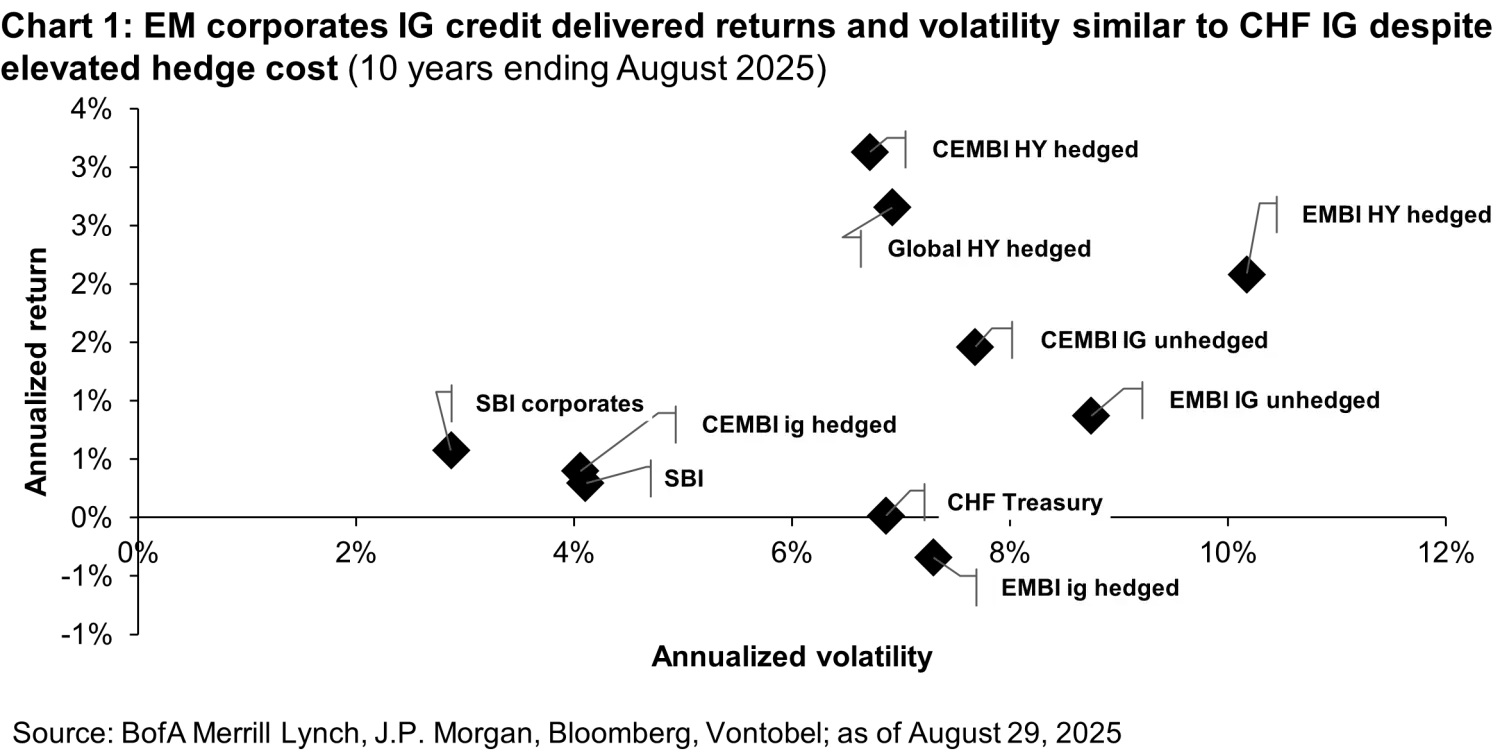
When comparing EM IG USD indices hedged into CHF with the CHF IG index (SBI), hedged EM IG corporates delivered a slightly higher realized return of 0.4% versus 0.3% for SBI, with comparable annualized volatility despite an average hedge cost of -2.7% on the period (1M forward). Within SBI, the corporate sub-index performed better, posting a 0.6% return with lower annualized volatility of 2.9%. However, CHF corporates represent a much smaller market, with outstanding debt roughly ten times lower than EM IG, resulting in significantly reduced liquidity. Interestingly, unhedged EM IG corporates and sovereigns achieved not only higher annualized returns but also superior Sharpe ratios: 0.23 for EM IG corporates unhedged and 0.14 for EMBI IG unhedged, compared with 0.13 for CHF IG.
Emerging markets are often perceived as more vulnerable due to political instability, geopolitical tensions, weaker regulatory frameworks, or higher default risk. However, history suggests that EM IG has delivered risk-resilient returns on par with developed market (DM) IG during major shocks. During tail events such as the European debt crisis (2010–2012) or the Covid-19 pandemic (March 2020), the maximum spread widening for EM IG and DM IG indexes was of a similar scale (see chart 2).
We cannot overlook that EM IG issuers face greater exposure to sudden political shifts and sanctions. Consider the worst year on record for the asset class: 2022. That year, fixed income suffered from a sudden rise in interest rates, and Russia’s invasion of Ukraine added further stress. That year, the J. P. Morgan Global Aggregate IG index (GABI IG), which at the time was composed of more than 90% DM bonds (corporate and sovereign), lost 16.1%. Russian sovereign and corporate bonds were sanctioned, effectively freezing trading and settlement activity, leading to forced markdowns and write-offs for many global investors. That year the EM IG 50-50 (corporate-sovereign) reference index underperformed the GABI IG by just 79 basis points (bps) in what was arguably the worst possible year for the asset class. Yet, on a longer three-year horizon (2022-2024), i.e., once two years of recovery are included, the J. P. Morgan EM IG 50-50 outperformed the GABI IG by 4.4%.

The strong risk-adjusted returns of EM IG seem to be driven by a diversified composition across regions and issuers, solid underlying fundamentals, and favorable technical factors.
While the US accounts for 73% of the US IG index, EM IG spans 35 countries, with a maximum individual country weight of just 9% (Saudi Arabia) based on the J.P. Morgan Hard Currency Credit 50-50 (EMBIGD and CEMBIBD) IG Index. The three largest country exposures are all rated AA or A, highlighting the segment’s high-quality nature.
From an issuer perspective, quasi-sovereigns and state-owned enterprises often operate in strategic sectors and benefit from explicit or implicit government support. EM corporates are spread across diverse sectors such as utilities, infrastructure, energy, banking, and telecommunications. These companies are typically large, regionally systemic players, many operating in regulated markets, adding further stability. Meanwhile, supranational issuers, including development banks, enjoy high credit ratings amid strong shareholder backing, preferred creditor status, and conservative financial policies. Credit quality remains robust. On the sovereign side, many EM countries hold strong external buffers, including substantial foreign exchange reserves and current-account surpluses. On the corporate side, credit metrics are generally healthier than those of DM peers, with net leverage ratios trending lower over time.
Finally, local investors form a stable demand base in several EM regions. In markets such as Asia and the Middle East, domestic institutions often buy USD-denominated debt issued by their own governments or leading national champions, providing steady demand that may help limit spread volatility, even when global investors turn risk-averse.
Despite its strong risk-return profile, EM IG remains significantly underrepresented in actively managed, dedicated strategies. EM corporate bonds are held across a broad mix of investors, including local institutions, crossover investors, and broad-based dedicated EM strategies (e.g., Emerging Markets Bond Index (EMBI) / Corporate Emerging Markets Bond Index (CEMBI)).
Crossover investors, such as US IG managers, typically maintain only limited exposure, as EM IG represents just about 9% of global IG indices (ICE BofA Global Corporate Index (GOBC)). Their holdings are often concentrated in large, liquid issuers with ties to the US – such as Mexican corporates with US-linked operations – that are more familiar to non-dedicated investors.
In contrast, broad EM strategies like EMBI and CEMBI invest across the entire credit spectrum, including high yield (HY). For investors with strict investment-grade mandates or tight risk budgets, these strategies are less suitable, in our view.
This is why we believe EM IG warrants recognition as a standalone asset class, one that can offer attractive income and diversification without the elevated risks inherent in HY.
What about passive strategies, such as exchange-traded funds? While they offer efficiency, we believe that the investable EM IG universe is far broader than most indices capture. Active management has the potential to deliver superior returns by taking advantage of inefficiencies within the asset class.
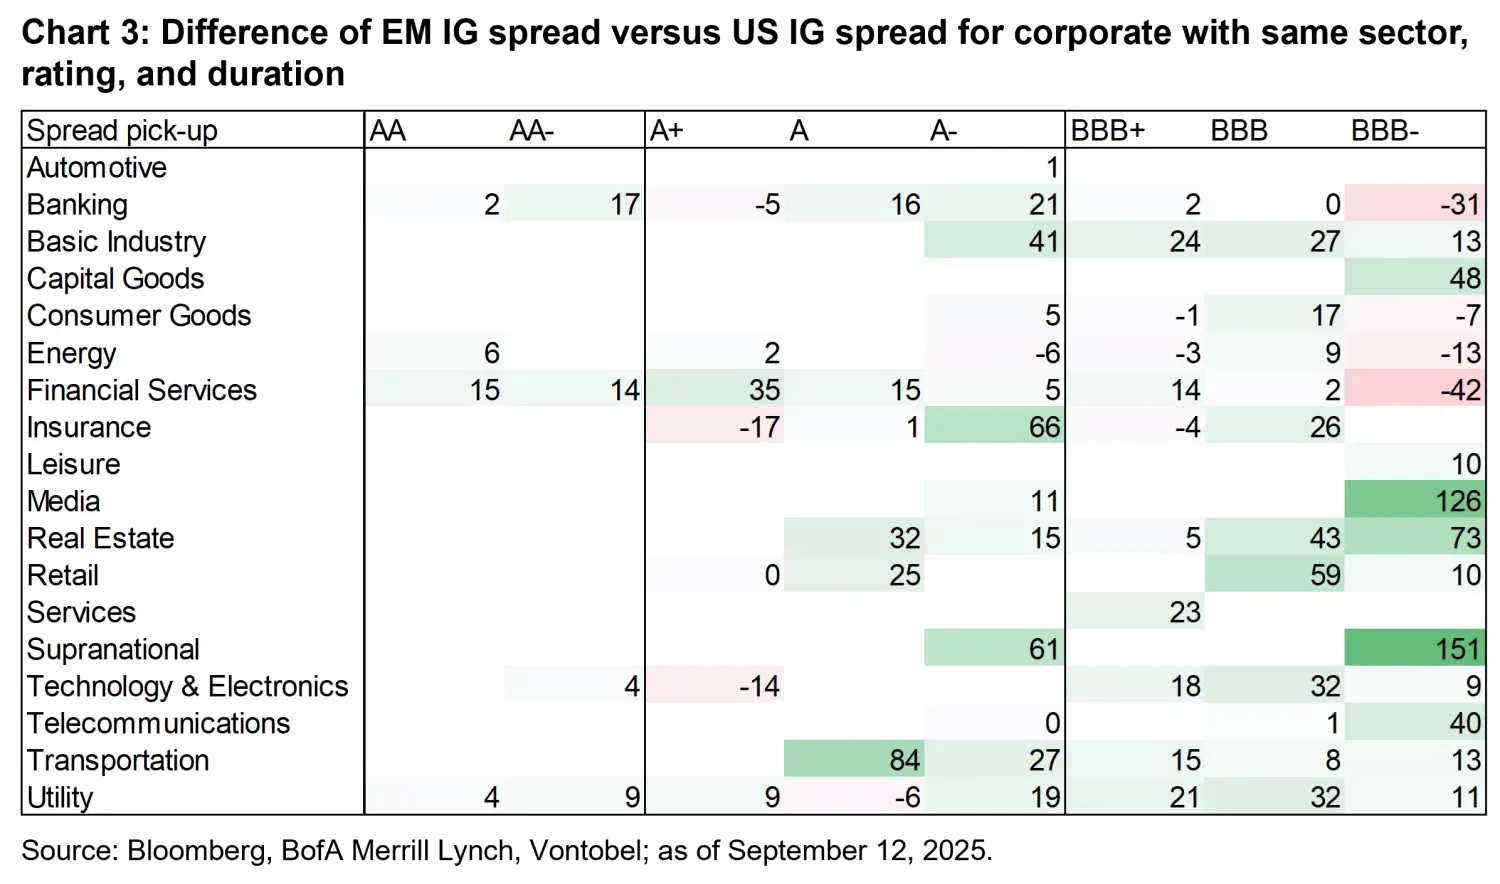
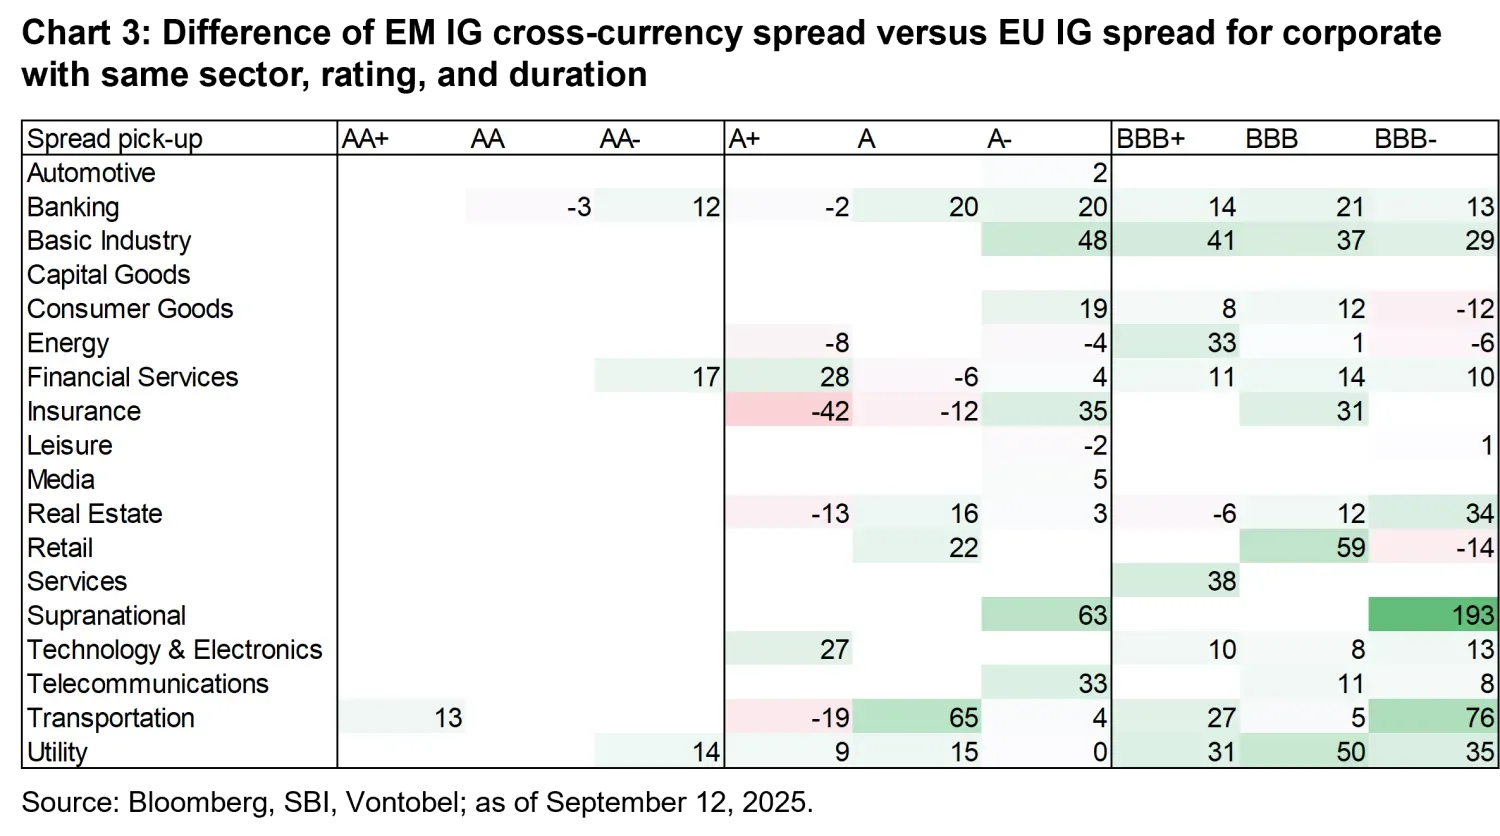
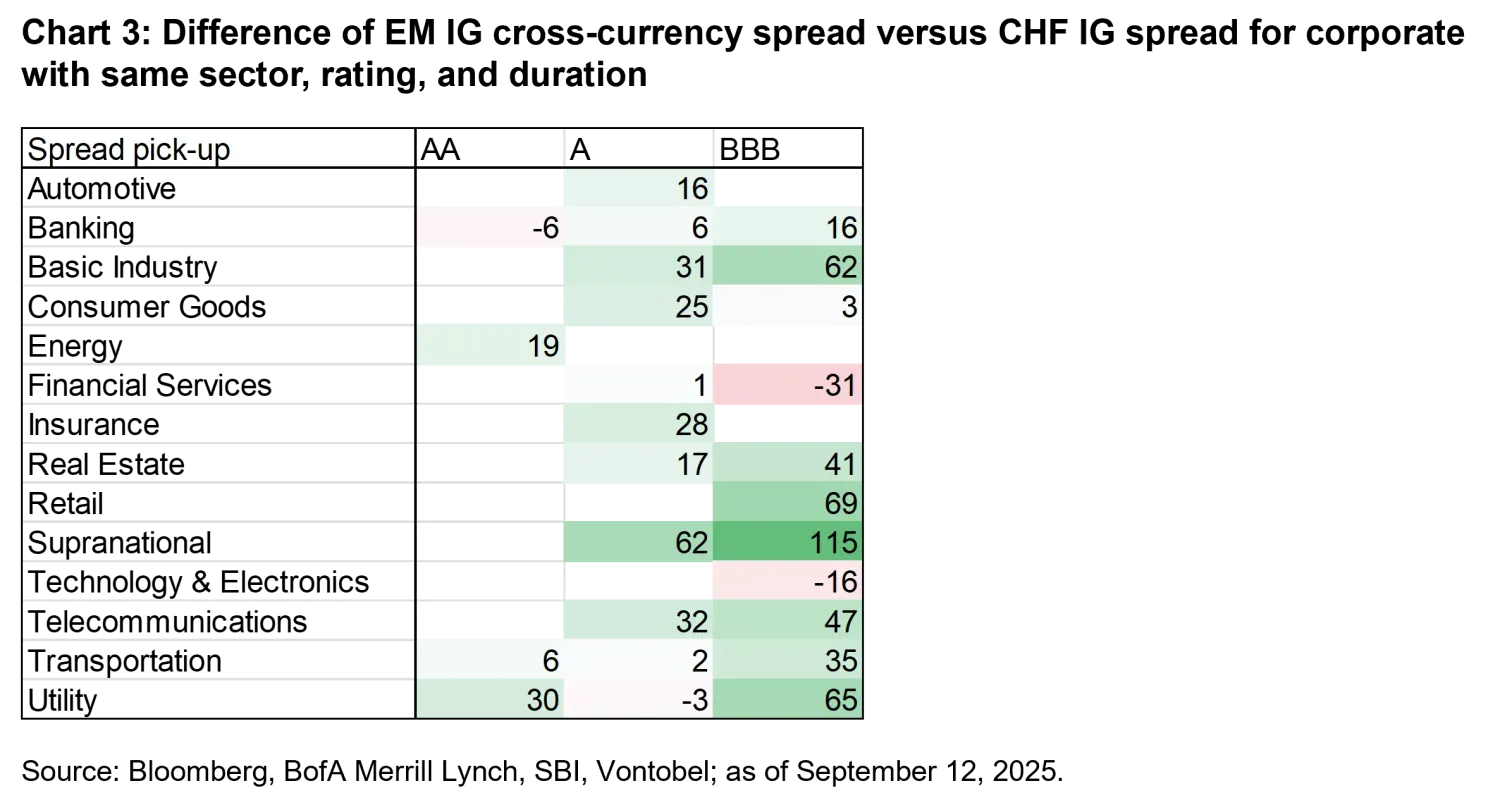
Today, the average spread differential between EM IG and US IG indices has narrowed to around 30bps. But spread dispersion within EM IG remains significant. Even when matching EM IG corporates with US IG peers of similar sector, rating, and duration bucket, spread premiums often far exceed 30bps. A similar dispersion is observed versus EU IG and CHF IG (see chart 3). This can create a compelling opportunity for active managers to optimize spread exposure and enhance returns through careful selection and diversification.
We follow a dedicated strategy that invests exclusively in IG issuers, applying a “best rating” rule. The reference benchmark is a 50% EM sovereign / 50% EM corporate IG mix (J. P. Morgan), designed to combine the attractive valuations of corporates with the liquidity and stability of sovereign and quasi-sovereign bonds. The strategy seeks to optimize spread while maintaining a low tracking error.