Quality Growth
Global equities specialists since 1984. We provide a boutique investment experience for institutional and intermediary clients around the world.
We are now witnessing a market panic as the continued spread of the coronavirus is threatening a global recession. The impact on global equity markets has been severe in recent weeks and, combined with the oil price war, volatility has escalated. The equity markets are clearly reacting negatively to the number of cases reported, uncertainty over whether containment measures that we have seen in China will be effective elsewhere, and whether some countries, such as Italy, have the health care systems to cope with the outbreak.
While it is difficult to predict how long this pandemic will last, we do know that most cases have been mild. However, testing has generally been poor and only recently rolled out in countries such as Japan, Iran and even in the US. As testing increases, more cases will be reported, which should result in a lower fatality rate (currently between 3% and 4%). In Korea, where testing has been implemented extensively, the fatality rate is 0.5%. And even in China (ex Hubei) the fatality rate is below 1%. Markets are however reacting to an increase in the number of cases reported and concerns on policy response, which is why they have not bottomed. Hence, we are being incremental in our portfolio moves.
Recession risks have certainly increased – in the first half of this year we may see a technical recession in Europe and Japan, and a significant slowdown in the US. If the number of reported coronavirus cases continues to increase through the warm weather, particularly in the Northern hemisphere, we could see a prolonged recession. But if the number of cases materially decelerates in the summer, we would expect to see a relatively strong recovery in the second half of the year, particularly given the supportive stance by central banks.
Policy response should cushion the extent of a recession. While it is still relatively early days, central banks have aggressively increased stimulus as the US, Australia, Canada, and China have all cut rates. The ECB has just expanded quantitative easing and Italy, Thailand and China have introduced fiscal packages. There is speculation that the US is also looking to put through a fiscal package.
We believe our portfolios are well positioned to weather a recessionary environment. We seek to invest in high quality businesses that are leading dominant franchises, have high returns on invested capital, and low leverage – companies that tend to be more resilient during economic downturns. This is reflected in the downside capture of our strategies. Over the past ten years, the downside capture of our Global and US strategies has been 67% and 69%, respectively. During drawdown periods, our strategies tend to outperform the market. In our view, our strong downside protection is a result of our overweight to leading quality consumer staples and health care companies, exposure to select defensive industrials businesses, low exposure to financials and lack of exposure to energy. Our portfolios have benefited from the recent correction in oil prices, due to both lower demand and increasing supply as a part of Saudi's response to the dispute with Russia. We have long maintained a zero exposure to oil given low predictability and low returns on invested capital in energy companies.
We are incrementally making changes to our portfolios given the continued market volatility – adding positions on a very selective basis, while taking advantage of lower valuations. In each situation, we assess whether or not there has been any material change to the 5-year valuation of the businesses we own, or are looking to buy – even accounting for what could be significantly lower earnings for 2020. We now need to look to 2021 valuations and the 5-year forecasts to assess the underlying growth in the business. In the majority of cases, we believe that valuations have not been materially impaired and that the strength of the competitive advantages of our companies will endure, supported by strong returns and healthy balance sheets. In our Global Equity strategy, for example, we are seeing opportunities in areas such as luxury, athletic footwear, and online travel segments. We are also seeing opportunities in defensive companies in med tech where valuations have come down and investors were concerned about single payer risk. To fund incremental opportunities, we have trimmed some relatively expensive names in the industrials sector. In emerging markets, we are looking past the short-term price declines and adding to areas where we see long-term secular growth, such as on-line entertainment and games and athleisure.
We have been gradually reducing our exposure to financials as we expect that, in the aftermath of this pandemic, rates will remain low globally. That said, we remain invested in banks in India, which we feel is a much better market. Interest rates in India are still meaningfully higher than developed markets. And, the low penetration rate indicates that the growth trajectory is intact. Our Indian financials holdings are conservatively-managed businesses that have been gaining market share from weakening competitors, institutions like Yes Bank, an Indian private sector bank that was recently bailed out by a consortium led by a state bank of India.
We remain conservatively positioned in emerging markets. While we did not foresee the coronavirus outbreak, volatility is inherent to emerging market equities. From a country allocation perspective, we aim to be conservatively positioned and avoid countries with weak fundamentals. We do not have any investments in Russia, Saudi Arabia, Argentina or Turkey.
China, the largest weight in the MSCI EM benchmark, is now seeing a decline in reported coronavirus cases and its supply chain is on the road to recovery. For example, at the deepest point of the decline about a month ago coal consumption was down approximately 40% year-over-year. It is currently down roughly 20% year-over-year. Another indicator to watch is subway utilization, which is still only a quarter of its pre-virus level. People are returning to work, whether they are driving or gradually using subways again, which does present the risk of local outbreaks.
In our international equity strategy, we have increased our weight to industrials, which has been one of the greatest drivers of strong relative performance year to date, even in light of the volatility. Industrials is not typically an area where we find quality opportunities due to the cyclical nature of many companies in the sector. But our bottom-up approach leads us to companies that tend to have a high degree of predictability During downturns, they tend to do better than the economy. With the recent sell off, we are also adding on the margin to some quality defensive franchises that are global leaders in their markets.
Software companies like Microsoft, SAP and Adobe have improved their business models, shifting away from one-off license sales to cloud-based subscription models. The result is more predictable cash flows and a high degree of visibility into future upgrade cycles. We believe this will make them more resilient during a recession, even though growth will undoubtedly slow. For example, during the 2008-09 financial crisis SAP’s retention rates remained high, indicating how critical SAP is to a business’s ability to operate.
In terms of longer-term consumer behavior, we believe there will be a shift in demand in e-commerce, particularly in everyday items like fresh food. Names like Alibaba and Amazon should be well-placed to benefit from this. Even businesses like Nike and Adidas that have been rolling out an omnichannel e-commerce model, and have e-commerce revenues close to one third of their sales, are expected to be well-placed to benefit from growth in e-commerce. Online gaming should benefit, where Tencent is well positioned, and for home entertainment there could be an increase in demand for streaming services like Disney Plus.
Our investment approach remains unchanged, focused on identifying high quality growth companies trading at sensible prices. We believe this time-tested process has enabled our clients to perform well over the long term with less risk than the benchmark. A key element of executing this approach is stress testing companies' resilience to economic shocks. This exercise cannot be carried out on the fly in the midst of a panic. It takes years of research efforts by analysts who are experts in their areas of coverage. And at Vontobel, our experienced research team has made that investment, which can pay off in times like these.
Global Markets Equity Composite

1 Total returns are expressed in USD.
2 The measure of internal dispersion presented is an asset-weighted standard deviation based on gross of fee returns, and is cal-culated if the composite contains greater than five portfolios for the full year.
3 3-year annualized standard deviation based on monthly returns.
4 Since January 2011, results of the composite are compared to the MSCI All Country Word Index (Total Return Net Dividends). Prior to January 2011, results of the composite were compared to the MSCI World Index (Total Return Net Dividends).
Source: Vontobel
Notes:
1. Vontobel Asset Management, Inc. (“Vontobel“) is an investment advisory firm registered with the Securities and Exchange Commission, under the Investment Advisers Act of 1940, as amended, and a subsidiary of Vontobel Holding AG, Zurich, Switzerland. For GIPS purposes, the firm is defined as all institutional accounts at Vontobel, excluding wrap accounts and pri-vate client assets managed in previous years.
2. Vontobel claims compliance with the Global Investment Performance Standards (GIPS®) and has prepared and presented this report in compliance with the GIPS standards. Vontobel has been independently verified for the periods from January 1, 2001 through December 31, 2018.
3. Verification assesses whether (1) the firm has complied with all the composite construction requirements of the GIPS stand-ards on a firm-wide basis and (2) the firm’s policies and procedures are designed to calculate and present performance in compliance with the GIPS standards. The Global Markets Equity composite has been examined for the periods from January 1, 2001 through December 31, 2018. The verification and performance examination reports are available upon request.
4. The Global Markets Equity Composite includes all discretionary accounts that invest mainly in equity or equity-linked securi-ties of issuers located in the developed and emerging markets in the United States, Europe, Asia and Latin America. This composite consists of accounts that are not required to be at least 75% hedged at all times, and these accounts can hold as many as 70 stocks at any given time. The minimum account size for this composite is $1 million.
5. The composite was created on May 3, 2004. The firm maintains a complete list and description of composites, which is availab-le upon request.
6. The U.S. Dollar is the currency used to express performance. Policies for valuing portfolios, calculating performance and pre-paring compliant presentations are available upon request.
7. Since January 2011, results of the composite are shown compared to the MSCI All Country World Index (the “MSCI ACWI“), an unmanaged index of stocks traded in major world markets. The benchmark was changed to provide a closer representative comparison versus the composite. The benchmark is used for comparative purposes only and generally reflects the risk or in-vestment style of the investments in the composite. The index is a free float-adjusted market capitalization index that is de-signed to measure global developed and emerging markets equity performance. It is a market-weighted aggregate of 49 indi-vidual country indexes that collectively represent major markets of the world. The index is calculated on a total return basis with net dividends reinvested. It reflects withholding taxes, but not fees and other investment expenses, and is expressed in U.S. Dollars. Investments made by Vontobel for the portfolios it manages according to respective strategies may differ signifi-cantly in terms of security holdings, industry weightings, and asset allocation from those of the MSCI ACWI. The index has not been examined by an independent verifier. Prior to January 2011, results of the composite were shown compared to the MSCI World Index, an unmanaged index of stocks traded in major developed markets.
8. Net composite performance is presented after the deduction of foreign withholding taxes. Capital gains, dividends and interest income received may be subject to withholding taxes imposed by the country of origin and such taxes may not be recoverable.
9. Returns include the effect of foreign currency exchange rates. Returns are presented gross and net of management fees and include the reinvestment of all income. The gross rates of return are presented before the deduction of investment management fees and other investment-related fees, and after the deduction of foreign withholding taxes, brokerage commissions and transaction costs. The net rates of return are presented after the deduction of investment management fees, brokerage com-missions, transaction costs, other investment-related fees, foreign withholding taxes and bundled fees. Such investment man-agement fees are actual fees. Withholding tax rates for the indices are applicable to Luxembourg withholding companies. Our withholding taxes, as captured in the composites, may vary from those captured in the index. Effective January 2016, the net returns reflect daily accruing of fees based on each account’s fee schedule. Prior to 2016, the net returns were calculated using actual fees recorded on a cash basis. Starting in 2014, the net rates of return are also reflective of performance fees. Prior to 2014, the net rates of return did not contain any performance-based fee components. Derivatives in the form of forward foreign currency contracts were used in managing client portfolios for opportunistic currency hedging until October 2011.
10. The standard annual management fees charged by Vontobel for the Composite are: 0.75% on the first $100 million, 0.65% over $100 million. Certain accounts may have higher management fees than the standard fee schedule. Investment advisory fees are further described in Part 2 of its Form ADV.
11. As of March 7, 2016, Mr. Matthew Benkendorf took over the management of the Vontobel Global Equity Strategy. There are no changes to the composite strategy as a result of the management change.
12. Past performance is not indicative of future results.
US Equity Composite
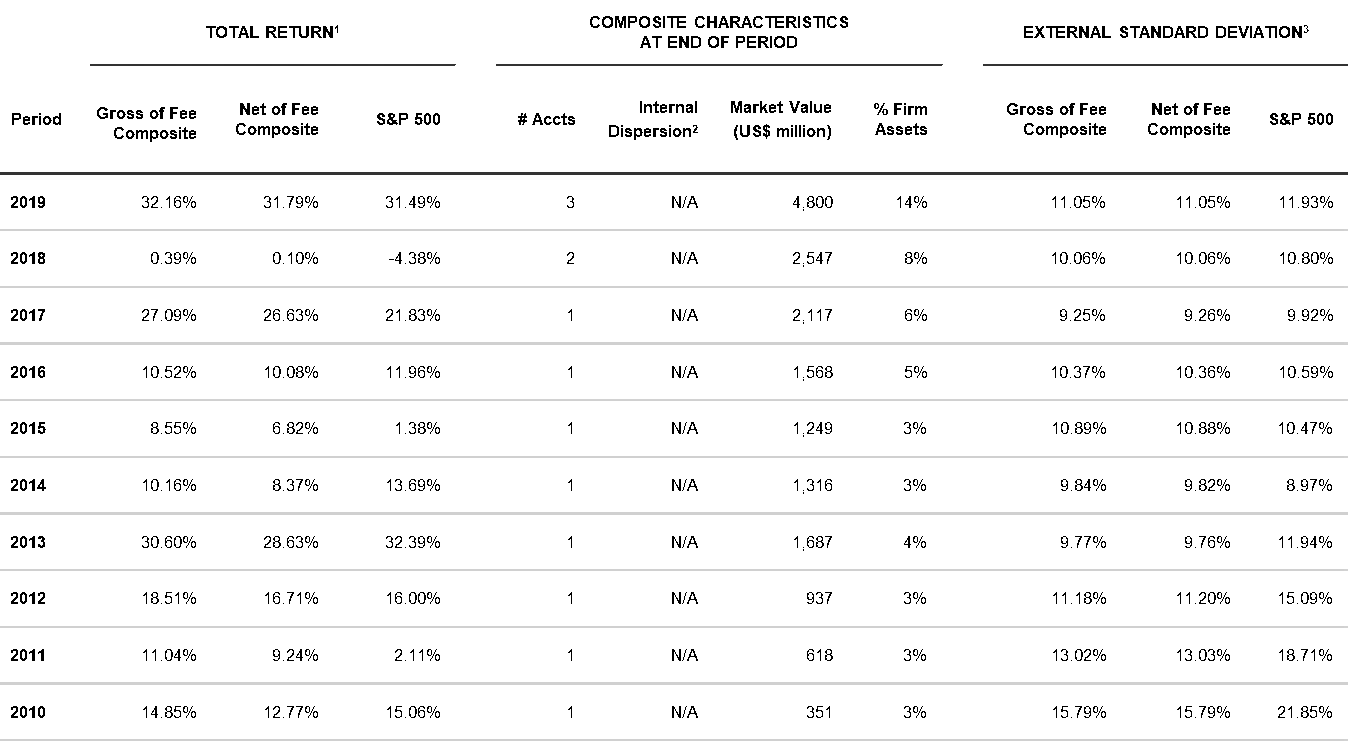
1 Total returns are expressed in USD.
2 The measure of internal dispersion presented is an asset-weighted standard deviation based on gross of fee returns, and is cal-culated if the composite contains greater than five portfolios for the full year.
3 3-year annualized standard deviation based on monthly returns.
Source: Vontobel
Notes:
1. Vontobel Asset Management, Inc. (“Vontobel“) is an investment advisory firm registered with the Securities and Exchange Commission, under the Investment Advisers Act of 1940, as amended, and a subsidiary of Vontobel Hol-ding AG, Zurich, Switzerland. For GIPS purposes, the firm is defined as all institutional accounts at Vontobel, exclu-ding wrap accounts and private client assets managed in previous years.
2. Vontobel claims compliance with the Global Investment Performance Standards (GIPS®) and has prepared and pre-sented this report in compliance with the GIPS standards. Vontobel has been independently verified for the periods from January 1, 2001 through December 31, 2018.
3. Verification assesses whether (1) the firm has complied with all the composite construction requirements of the GIPS standards on a firm-wide basis and (2) the firm’s policies and procedures are designed to calculate and present per-formance in compliance with the GIPS standards. The U.S. Equity composite has been examined for the periods from January 1, 1994 through December 31, 2018. The verification and performance examination reports are available upon request.
4. The U.S. Equity Composite includes all discretionary accounts that invest at least 65% of its assets in the securities of U.S. companies. For the purpose of this policy, U.S. companies are companies of any size (without regard to stock market capitalization) organized in the United States and whose securities are principally traded on a U.S. exchange or that are quoted on an established U.S. over-the-counter market. The minimum account size for this composite is $1 million.
5. The composite was created on April 5, 1990. The name of the composite was changed from U.S. Value Equity Com-posite to U.S. Equity Composite in November 2011. The firm maintains a complete list and description of composites, which is available upon request.
6. The U.S. Dollar is the currency used to express performance. Policies for valuing portfolios, calculating performance and preparing compliant presentations are available upon request.
7. Results of the composite are shown compared to the Standard and Poor’s 500 Index (the “S&P 500 Index”), an un-managed index consisting of securities listed on exchanges in the United States of America. The benchmark is used for comparative purposes only and generally reflects the risk or investment style of the investments in the composite. The index is calculated on a total return basis with dividends reinvested, but does not reflect fees, brokerage commis-sions or other investment expenses, and is expressed in U.S. Dollars. Investments made by Vontobel for the portfo-lios it manages according to respective strategies may differ significantly in terms of security holdings, industry weightings and asset allocation from those of the S&P 500 Index. The index has not been examined by an independ-ent verifier. 8. Returns include the effect of foreign currency exchange rates. Returns are presented gross and net of management fees and include the reinvestment of all income. The gross rates of return are presented before the deduction of in-vestment management fees and other investment-related fees, and after the deduction of foreign withholding taxes, brokerage commissions and transaction costs. The net rates of return are presented after the deduction of investment management fees, brokerage commissions, transaction costs, other investment-related fees, foreign withholding tax-es and bundled fees. Such investment management fees are actual fees, and do not contain any performance-based fee components. Derivatives in the form of forward currency contracts were used in the composition of client portfoli-os for opportunistic currency hedging until October 2011. Effective January 2016, the net returns reflect daily accruing of fees based on each account’s fee schedule. Prior to 2016, the net returns were calculated using actual fees record-ed on a cash basis.
9. The standard annual management fees charged by Vontobel for the Composite are: 0.75% on the first $100 million, 0.65% over $100 million. Certain accounts may have higher management fees than the standard fee schedule. In-vestment advisory fees are further described in Part 2 of its Form ADV.
10. Past performance is not indicative of future results.
Disclaimer
The index comparisons in this commentary are provided for informational purposes only and should not be used as the basis for making an investment decision. Further, the performance of the composite and the Index may not be comparable. There are signifi-cant differences between the composite and the indices referenced, including, but not limited to, risk profile, liquidity, volatility and asset composition. Please note that an investor cannot invest directly in an index.
Investments discussed in the commentary are based on a representative portfolio and there is no assurance that Vontobel will make any investments with the same or similar characteristics as the representative portfolio presented. The representative portfolio is presented for discussion purposes only and is not a reliable indicator of the performance or investment profile of the composite. Further, the reader should not assume that any investments identified were or will be profitable or that any investment recommenda-tions or that investment decisions we make in the future will be profitable.
Any projections contained in this commentary are based on a variety of estimates and assumptions. There can be no assurance that the assumptions made in connection with the projections will prove accurate, and actual results may differ materially. The in-clusion of projections should not be regarded as an indication that Vontobel considers the projections to be a reliable prediction of future events and projections should not be relied upon as such.
This disclaimer applies to this commentary and the oral or written comments of any person presenting it.
There can be no assurance that investment objectives will be achieved. Clients must be prepared to bear risk of a total loss of their investment.
Due to a varying frequency of the fees being paid and associated compounding effects, the actual difference between gross and net returns may differ from the stated annual fee. For example, on an account with a 0.50% fee, continuous monthly gross performance of 1.50% and the fees being deducted monthly, the compounding effect will result in an annual gross return of 19.56% and a net return of 18.97%. Thus, a $10,000 initial investment would grow to approximately $14,295 gross of fees, versus $14,155 net of fees, over a two-year period. Effective January 2016, the net-of-fees rates of return are calculated based on the fee schedule. All net re-turns that were previously calculated on a cash basis are linked to the returns being calculated under the new methodology, reflect-ing daily accrual of fees. Vontobel’s investment advisory fees are further described in Form ADV Part 2A.
Vontobel Asset Management, Inc. (Vontobel) is registered with the U.S. Securities and Exchange Commission as an investment adviser under the Investment Advisers Act of 1940, as amended, in the USA. Registration as an Investment Advisor with the U.S. Securities and Exchange Commission does not imply a certain level of skill or expertise. Vontobel is exempt from the requirements to hold an Australian Financial Services License under the Corporations Act in respect of the financial services it provides to Aus-tralian wholesale clients under ASIC Class Order CO 03/1100. Vontobel is regulated by the US Securities and Exchange Commis-sion under US laws, which differ from Australian laws.
© 2020 Vontobel Asset Management, Inc. All Rights Reserved.
Vontobel Asset Management, Inc.
1540 Broadway, 38th Floor,
New York, NY 10036
T +1 212 804 9300
vontobel.com/am