How likely is the dreaded second wave of inflation?
Multi Asset Boutique
Inflation comes and goes in waves
Inflation is a bit like the whims of the sea: it comes and goes in waves. This was particularly evident during the “Great Inflation” that hit the US between 1965 and 1982.
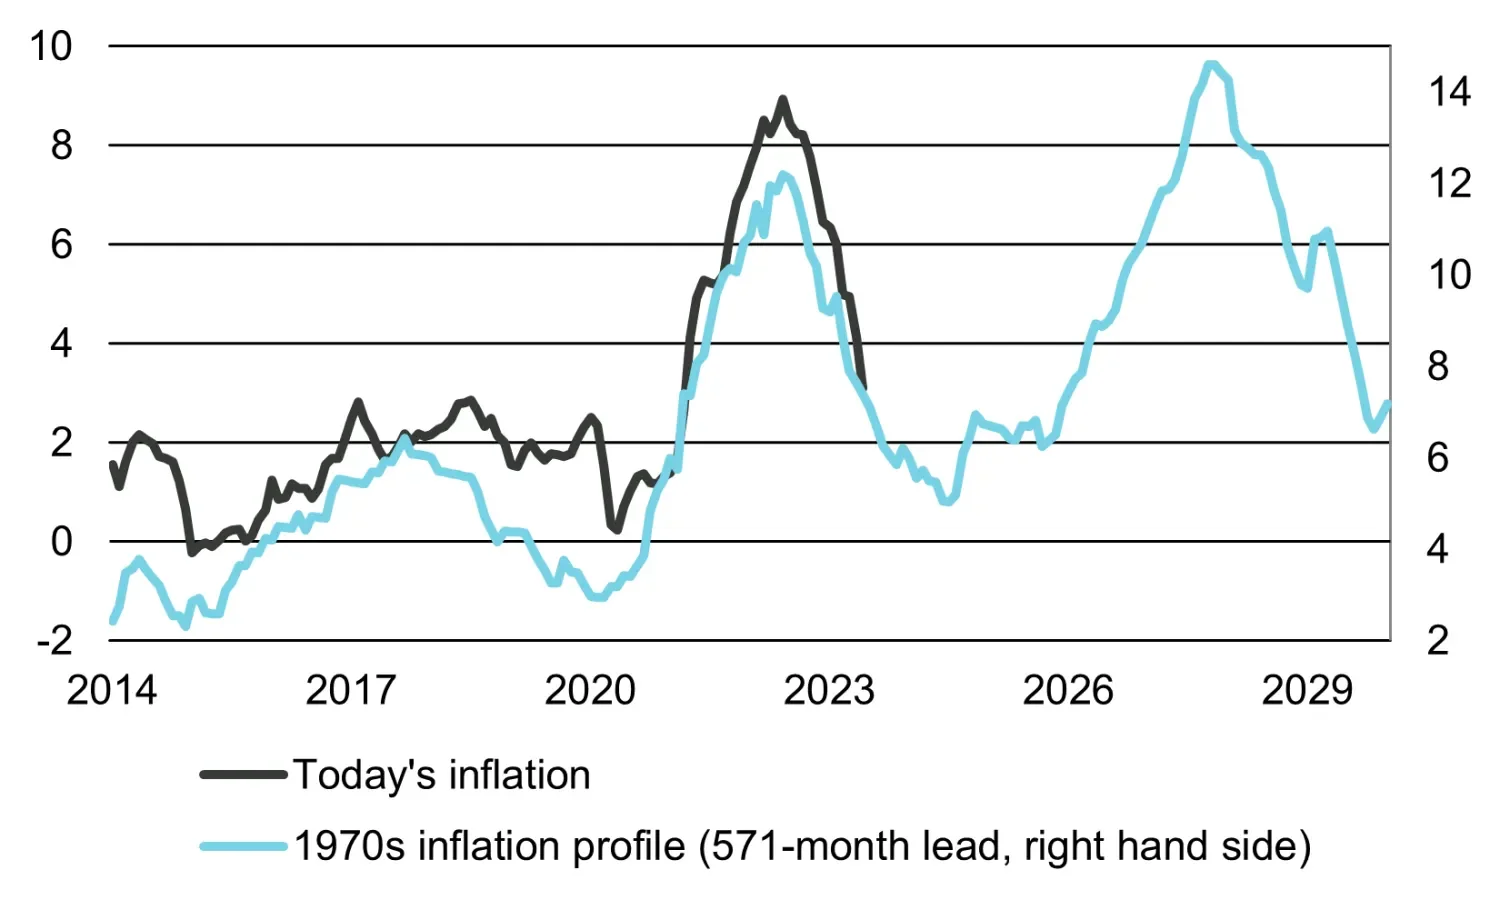
A particularly painful period stretched from 1972 to the early 1980s, when inflation rose to more than 14 percent year-on-year. It was Paul Volcker, US Federal Reserve chair at the time, who ultimately brought it to its knees by triggering two short but painful recessions and raising the key interest rate to around 20 percent. The bitter pill was followed by a rapid recovery of the US economy.
If one compares the inflation trend back then with today’s, things look somewhat similar (chart 1). This raises a very legitimate question: after consumer prices recently cooled, are we possibly in for a painful “second wave” with all its negative consequences?
Chart 1: In the 1970s, inflation came in waves – it looks very similar today

Source: Refinitiv, Vontobel. Inflation data as of June 2023.
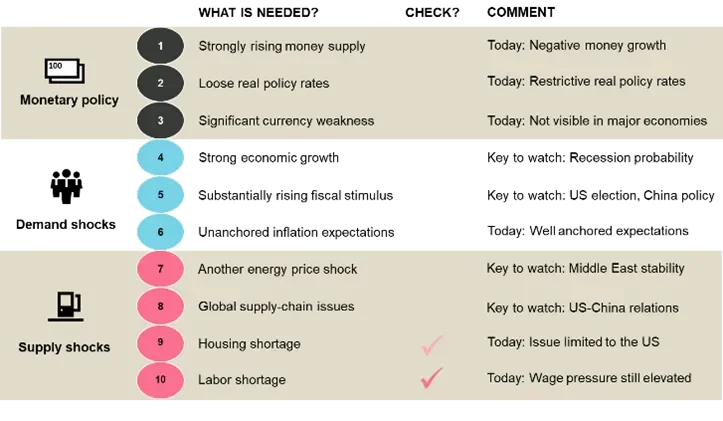
To answer this question, we have developed a “second-wave checklist” (chart 2), in which we distinguish between three broad categories: monetary policy considerations and demand and supply shocks.
Chart 2: Factors that would argue for a second wave

Source: Vontobel.
It is important to emphasize that not all criteria need to be met in order to trigger a second wave. In extreme cases, two or three criteria are sufficient. However, an expansionary monetary policy (at least one of the first three arguments) is a necessary precondition, in our view.
Comparison: Inflation in the 1970s vs. today
Today, those looking for the culprits of the 1970s inflation are spoiled for choice. Some blame the Arab oil embargo, others blame speculators, and still others point to greedy union representatives.
All these arguments are justified, but they disregard one of the most important reasons: strong monetary growth. Thanks to Nobel laureate Milton Friedman, we know that inflation “is always and everywhere a monetary phenomenon”. Friedman argued that nowhere in the world could inflation be found that had not been caused by a previous increase in money supply or in money supply’s growth rate. Considering today’s negative (!) money supply growth, a strong inflationary impulse seems rather unlikely.
Regarding point two, loose real interest rates, a second wave also seems unlikely. If one compares, for example, the so-called neutral key rate (which the Fed estimates to be 2.5 percent) with the current key rate, it becomes clear that the Fed is already very restrictive by its own measures.1
What about the last monetary policy factor – significant currency weakness? In the 1970s, the US dollar's decline in value following the “Nixon shock” was an important driver of inflation at the time.2
In 2023, things look somewhat different. The US dollar has come down from last year's highs but remains relatively strong. There are several reasons for this: apart from “safe haven” demand (due to ongoing concerns about the economic outlook, the debate about the US debt ceiling, and concerns around the health of US banks), the prospect of possible further interest rate moves by the Fed also played a role this year. While we expect the US dollar to weaken in the coming months, a devaluation like the one in the 1970s seems unlikely.
Let's now turn to the demand-side factors. Point four relates to the interplay between inflation and economic growth (inflation can be described as a business cycle’s lagging indicator). Looking at key economic leading indicators, such as the new orders component of the Institute of Supply Management (ISM), current growth is still far too weak to justify another strong inflation impulse.
What about point five – significantly increasing fiscal stimulus? While US fiscal policy in the 1970s was very loose, a strong fiscal stimulus seems unlikely in the near future. However, there are important developments that investors should keep an eye on in this regard: the US presidential elections on November 5, 2024 (campaign promises?) and future Chinese policy (stimulus to boost the Chinese economy?).
The last demand-related driver is inflation expectations getting out of control. Unanchored inflation expectations are treacherous because they can trigger a kind of self-fulfilling prophecy. If consumers believe that future inflation will be higher than current inflation, they have an incentive to consume sooner rather than later (since they would have to pay more for the same goods and services in the future). Unlike in the 1970s and 1980s, however, today’s inflation expectations are well anchored (chart 3).
Chart 3: Current inflation expectations well-anchored

Source: Refinitiv, Vontobel. In pink: unanchored inflation expectations; in blue: well-anchored inflation expectations. Michigan data as of July 2023.
The last four factors are aimed at supply shocks. First and foremost, there is a possibility of another energy price shock. The Arab oil embargo (1973 to 1974) was the straw that broke the camel’s back. As a result of the embargo, the price of oil quadrupled from 2.90 US dollars per barrel (before the embargo) to 11.65 US dollars per barrel (in January 1974), fueling inflation. A few years later, the Iranian revolution (1979) led to another oil price shock.
Right now, everything seems calm – at least according to the Chicago Board Options Exchange’s Crude Oil Volatility Index. Whether we will witness another energy price shock in the coming months is difficult to say: 2022 highlighted just how unpredictable geopolitical developments can be. We think investors should keep an eye on the situation in the Middle East in particular, in addition to the developments in Ukraine.
The next supply-side shock (global supply chain problems) is relatively disconnected from the 1970s and 1980s but is relevant to inflation developments today.
Regarding supply chains, we believe there is little cause for concern at present. For example, a relevant index from the New York Federal Reserve (Global Supply Chain Pressure Index) has fallen from its pandemic high of 4.3 to -1.2.
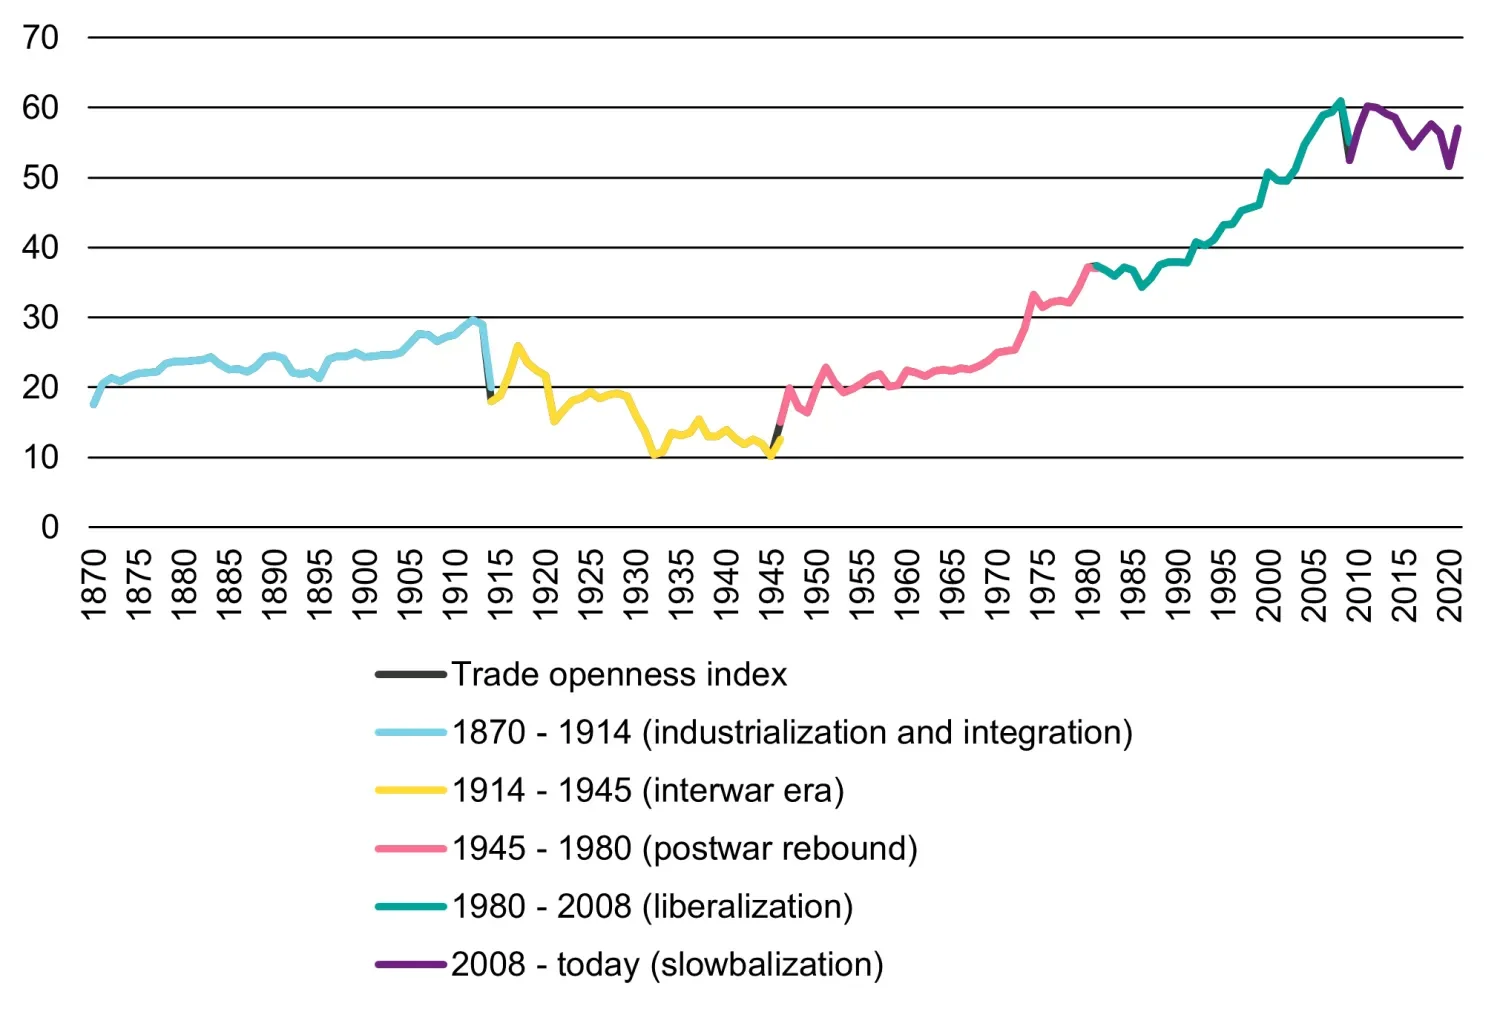
One development that we are following closely in this context, however, is the increasing polarization (also dubbed “slowbalization”) that can be observed between, e.g., the US and China (chart 4). In our view, it cannot be ruled out that this development will lead to higher prices in the long term.
Chart 4: Slowbalization could have an inflationary effect3

Source: PIIE Charts, Our World in Data, World Bank, Vontobel.
Let's move on to point nine: a shortage in the US housing market. Here, we would put a “cautious” first check mark. According to Freddie Mac, the US currently lacks about 3.8 million homes, both for rent and for sale.4 This shortage is an important reason why US house prices have hardly declined despite higher interest rates. This also has an impact on US housing inflation. The latter is currently of enormous relevance, as it accounts for around 50 percent of US core inflation.
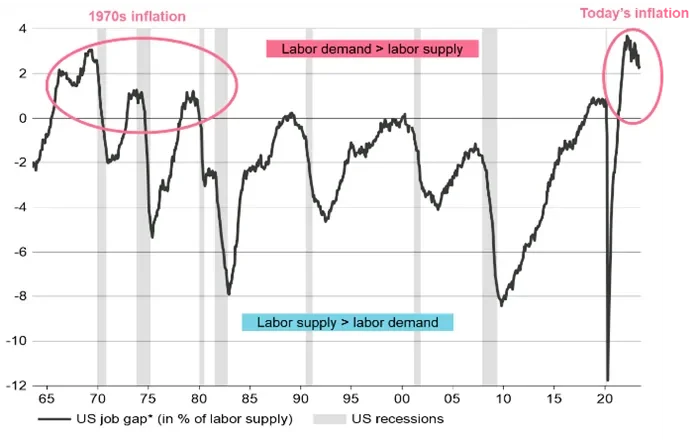
Point 10 – labor shortages – also poses an upside risk to inflation. The so-called job gap is gaping wide today, just like in the 1970s and 1980s.
What’s ahead – smooth sailing or choppy waters?
The answer to this question depends on one’s time horizon. In the short term (i.e., the next few months), the fade-out of base effects can result in higher inflation prints.
In the medium term (i.e., in the second half of 2023 and likely also sometime after that), we expect inflation to continue to fall and do not anticipate a significant flare-up in consumer prices – in line with our economic baseline scenario for 2023.
In the long term (i.e., multi-year horizon), developments such as increasing de-globalization or so-called “greenflation” harbor upside potential. Investors should therefore not necessarily assume that inflation will fully return to the levels of recent decades.
Given these different time horizons, we believe it is even more important to have a checklist.
1. The neutral interest rate is the rate at which monetary policy is neither stimulating nor restricting economic growth.
2. The “Nixon Shock” comprised a series of measures that the then-US President Richard Nixon wanted to use to get a grip on rising inflation. Among other things, Nixon basically broke the US promise to be able to exchange the US dollar for gold at any time. The dollar thus lost its status as an anchor for other currencies. The “Nixon shock” paved the way for the collapse of the Bretton Woods system. Under Bretton Woods, gold formed the basis for the dollar; other currencies were pegged to the value of the dollar.
3. The trade openness index is defined as the sum of world exports and imports divided by world GDP. 1870 to 1949 data are from Klasing and Milionis (2014); 1950 to 1969 data are from Penn World Tables (10.0); 1970 to 2021 data are from the World Bank.
4. "Federal Home Loan Mortgage Corporation" (called Freddie Mac) is a publicly traded, government-sponsored enterprise designed to provide liquidity, stability, and affordability in the mortgage market.


