Sectors or Factors?
Multi Asset Boutique
When it comes to fine-tuning equity exposure, allocators need broad categories to choose from, like sectors or factors. Shall I overweigh certain sectors or factors depending on my macro view of the world? Or shall I stay passive and refrain from using ‘selection’ as a degree of freedom? Those are the questions.
For allocators, it’s more practical to use sectors or factors as selection categories to choose from, as there is no time for stock-by-stock analysis anyway, especially when, as it happened around April, volatility spikes.
This year’s market turbulence—such as the tariff announcement in early April—has shown how difficult it can be for investors to navigate disruptive events. Traditional safe havens have been scarce, with even US Treasuries or German Bunds offering less protection than in the past. Beneath the surface, however, certain strategies can still help mitigate downside risk. Minimum Volatility equity strategies, for example, have provided relative stability across the cycle and in turbulent markets.
Beyond these tactical challenges lies a bigger question—often shaped more by ideology than evidence: should allocators use sectors or factors in order to make their equity selection compatible with their macro world view? In this Quanta Byte, we weigh the pros and cons of both, trace their history, and examine how sectors and factors intersect—before staging a “tournament” between the two.
Sectors, factors and the shifting market playbook
The way investors access and deploy capital in equity markets has changed dramatically in recent decades. Industry-specific mutual funds first appeared in the early 20th century, but sector investing only gained momentum in the 1960s and 1970s as pension funds and institutional investors grew in importance. The launch of the Global Industry Classification Standard (GICS) in 1999 reflected rising demand for sector-based strategies.
Factor investing, by contrast, traces its roots to the Capital Asset Pricing Model (CAPM) of the 1960s. Since then, factors such as Value, Quality, Momentum, Minimum Volatility, and Dividend Strength have become established and widely used.
Challenging market conditions often prompt a reassessment of investment processes. The Global Financial Crisis exposed the risk concentration in benchmark-based investing, while the era of quantitative easing—with high correlations across asset classes—and rising geopolitical risks have spurred greater interest in thematic approaches.
Yet sector strategies remain a vital part of the investor toolkit. As industry dynamics evolve faster than ever, profit pools can shift quickly along the value chain. Overlooking sectors such as Information Technology—propelled by unprecedented innovation—can be a costly mistake.
Before weighing the benefits and drawbacks of sector and factor strategies, we first examine the return characteristics of sectors—using the same approach as in our earlier deep dive into factors in previous Quanta Bytes.
Sector performance through the business cycle
We measure sector performance relative to the MSCI World benchmark1, using the business cycle states defined by our Vontobel Wave model2. Figure 1 shows each sector’s relative out- or underperformance by cycle state, as well as across the full cycle.
Starting with the unconditional performance— the average relative performance since 1995, regardless of cycle state—three winners stand out: Information Technology (+4.3%), Health Care (+1.5%) and Consumer Staples (+0.5%). Energy, Industrials and Consumer Discretionary roughly matched the benchmark, while Materials, Financials, Communication and Utilities lagged behind.
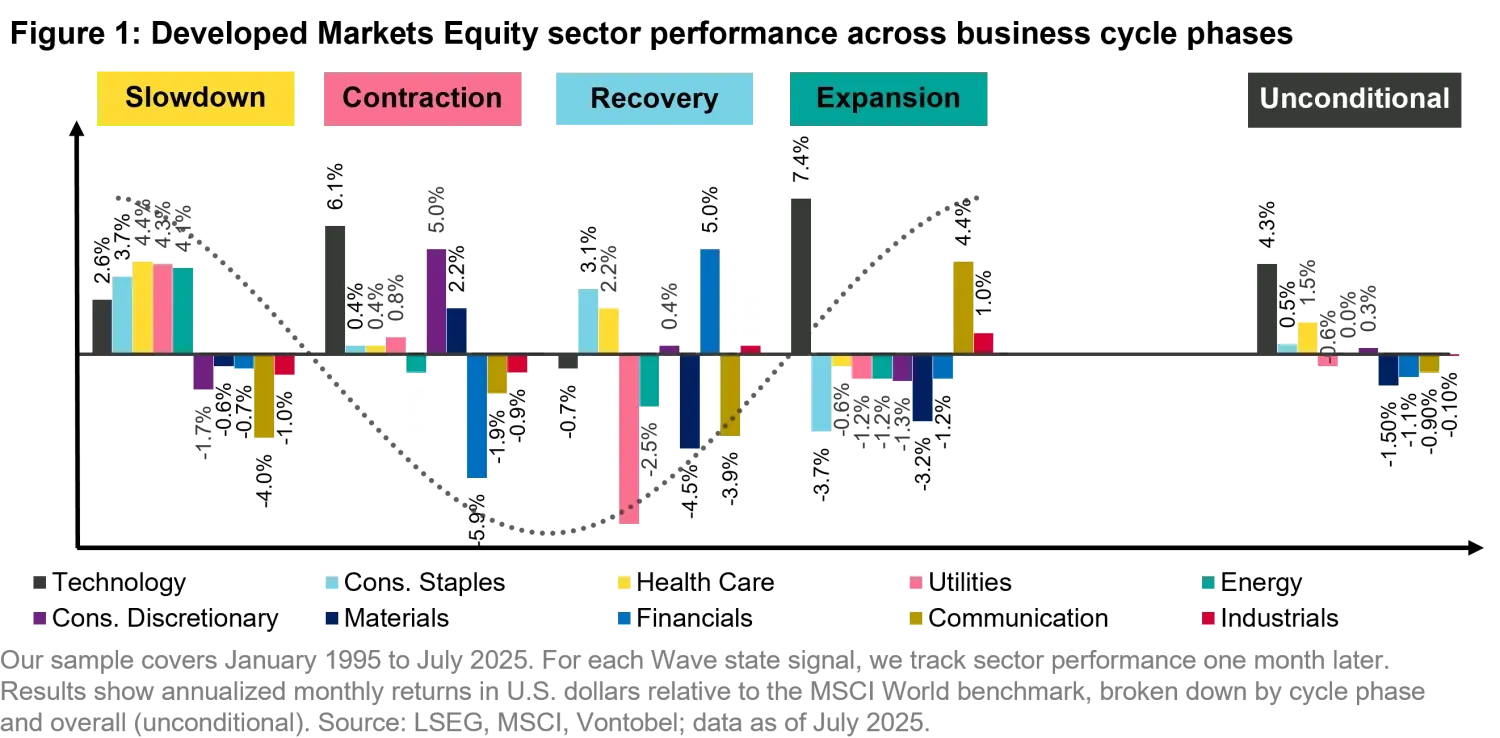
When we break performance down by business cycle phase, clear patterns emerge:
- No sector consistently outperforms in all four phases.
- Information Technology, Consumer Staples and Health Care outperform in all phases but Expansion (consumer staples and health care) or Recovery (Technology).
- Communication and Energy underperform in all phases but Recovery (Energy) or Expansion (Communication).
- In contractions, IT (+6.1%), Consumer Discretionary (+5%) and Materials (+2.2%) stand out.
- Utilities, Health Care and Consumer Staples display classic defensive traits: they tend to outperform when the Wave signals a slowdown or contraction, but show weaker or negative relative performance during upturns—recovery and expansion.
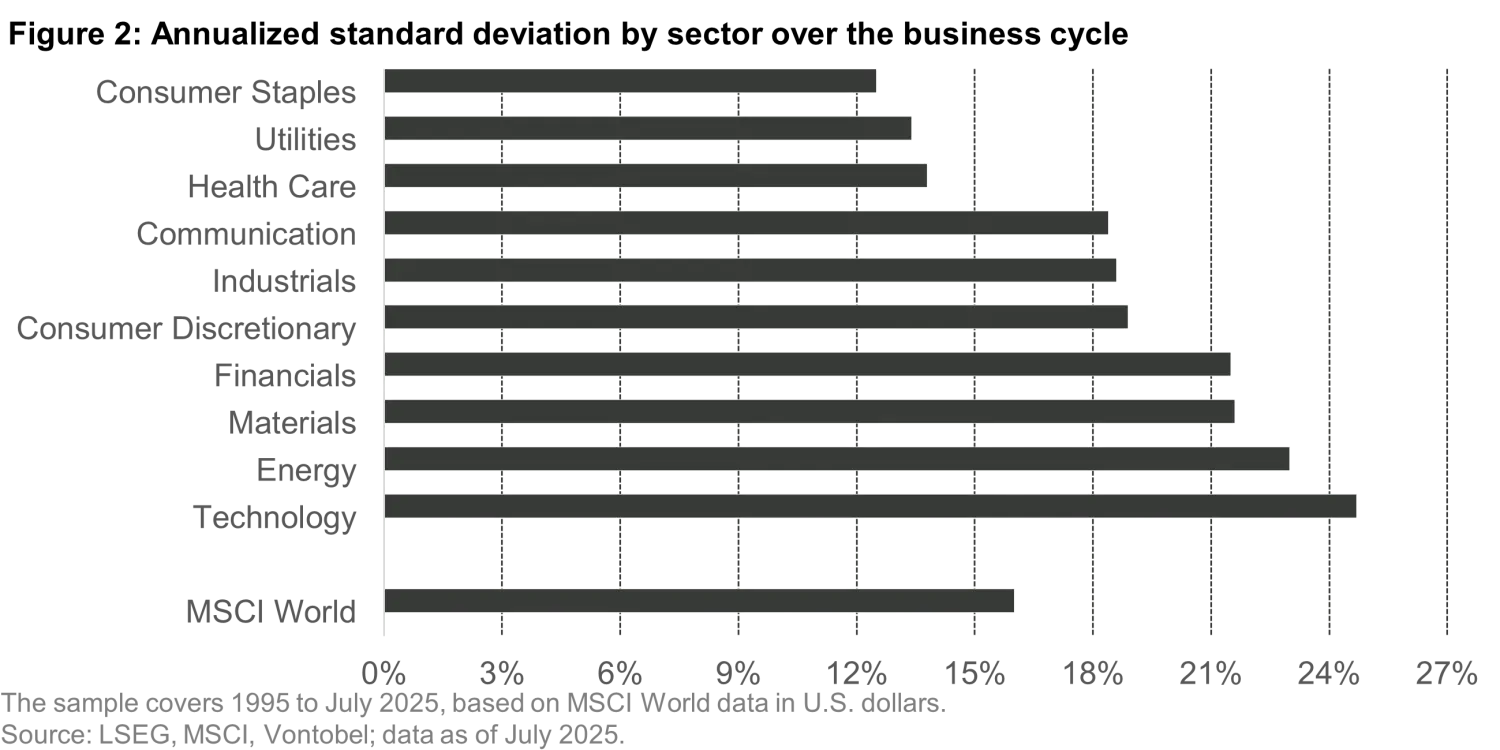
These defensive sectors also come with lower volatility. Utilities, Consumer Staples and Health Care each have annualized volatility below 14%, compared with more than 18% for the broader sector universe (Figure 2).
With the results from our factor study in mind – based on a similar analysis – we can now examine the intersection of factor and sector returns.
When Factors Meet Sectors: What Investors Need to Know
Investors often look at equities through a sector lens or a factor lens. In practice, the two dimensions are closely linked.
To explore this relationship, we conducted two studies: a correlation analysis and a business cycle analysis. The correlation analysis uses historical correlations of 5-day returns. Figure 3 shows, for each factor, the two sectors with the highest correlation.
The results fall into three clear groups:
- Momentum, Quality, Size (Small Caps) and Growth correlate most with Industrials and Consumer Discretionary (black bars).
- Value, Dividend Strength and Size (Large Caps) align with Financials (blue bars).
- Minimum Volatility shows the strongest correlation with Consumer Staples (yellow bars).

Correlations can shift over time. Take the Growth factor, for example. Since the early 2000s, its correlation with technology stocks has risen from 0.80 to 0.97 (see Figure 4) — one of the highest factor–sector correlations in our sample, with a long-term average of 0.92.
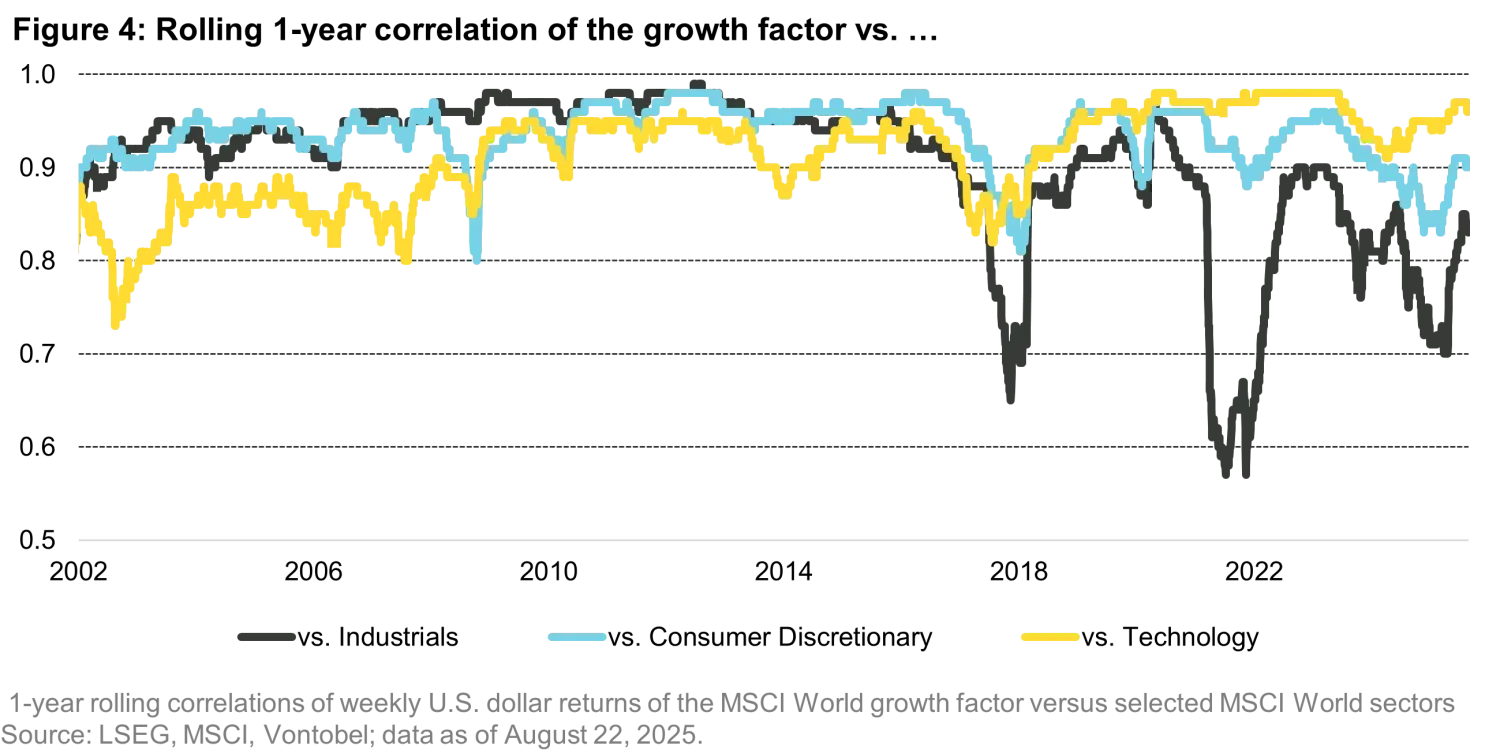
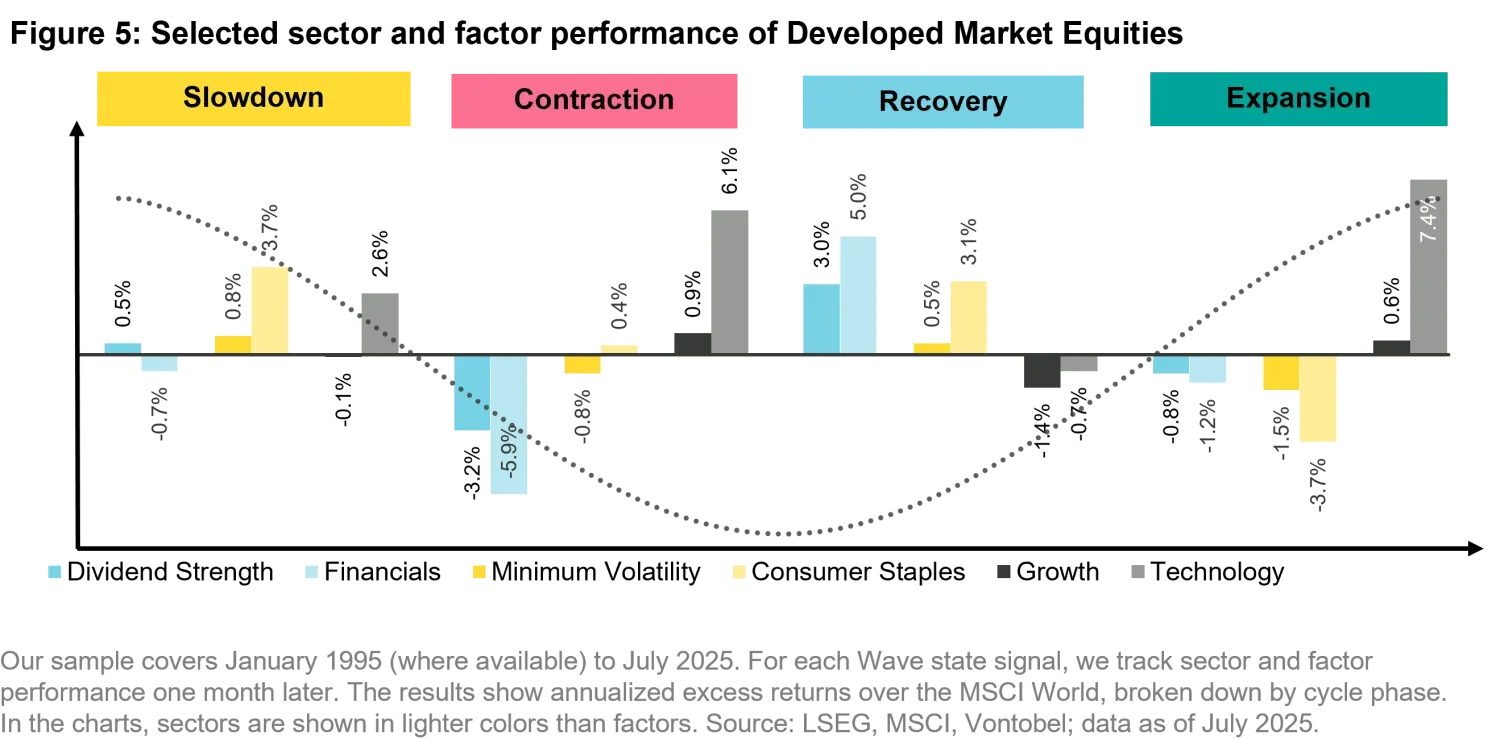
Figure 5 shows the return distribution of selected sectors and factors across the business cycle. We focused on pairs with higher correlations (Figure 3) and selected one pair from each group (black, blue and yellow bars).
The results show that the correlations presented in Figure 3 hold well in most business cycle states. However, return differences between the pairs can be substantial. For example, while Growth and Technology stocks are highly correlated, their annualized returns differ significantly in both expansion and contraction phases.
Both analyses suggest that, despite return differences, there is considerable overlap between sectors and factors. In some cases, the return profile of a sector can be approximated by a factor—and vice versa. Investors loading on a certain factor should therefore be aware of the potential sector exposure that comes with it. For Minimum Volatility stocks, the only comparable sector is Consumer Staples.
Sectors Deliver Highs, Factors Deliver Balance
Taking the intersection of factors and sectors into account, one might conclude that it makes little difference whether investors take a sector-based or factor-based approach to equities. But it does. To illustrate this, we staged a “tournament” between factors and sectors, counting the number of medals each approach collects.
The disciplines:
- Highest and lowest excess return
- Highest and lowest volatility
- Highest and lowest Sharpe ratio
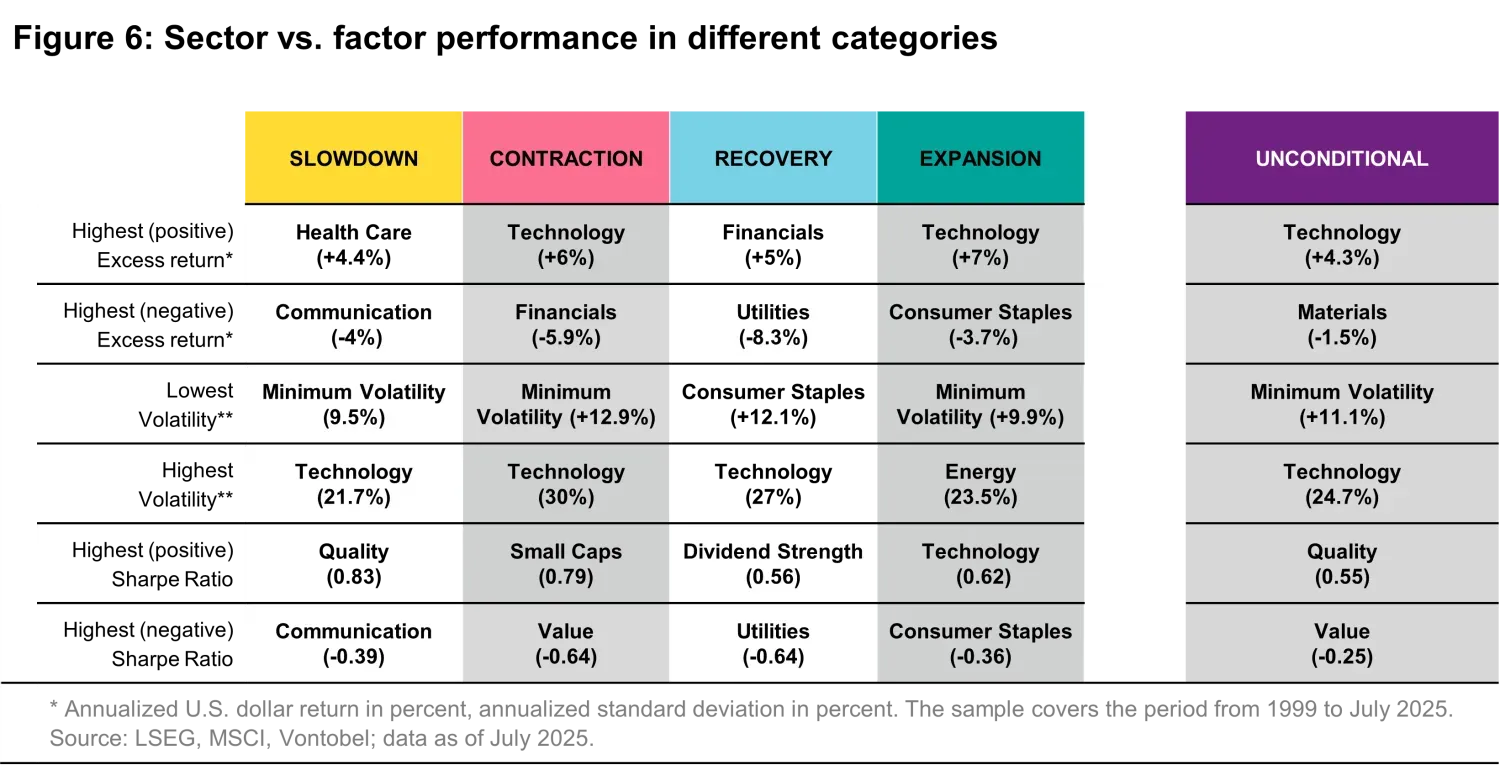
Figure 6 shows that no other factor or sector strategy tends to outperform Technology during contractions — though it comes with the highest volatility. Its annualized excess return reaches +6%. At the other end of the spectrum, Financials lag with –5.9%. Minimum Volatility stocks offer the lowest risk, while Size (Small Caps) deliver the highest Sharpe ratio at 0.79.
Figure 5 reveals five key observations:
- Excess return: Across all business cycle states, sector strategies deliver the highest excess returns. However, they also take the bottom spot in each state, as the worst performer has been a sector, not a factor.
- Volatility: Low volatility strategies—except during recovery—consistently posted the lowest volatility. The Technology sector shows the highest volatility exposure compared with all other sectors and factors.
- Risk-adjusted returns: Factors’ lower volatility gives them the edge in the Sharpe ratio category, making them the clear winners on a risk-adjusted basis.
- Cycle positioning: The wide gap between the best and worst excess returns in sector strategies allows long-only and long–short investors to use our Wave business cycle signals more effectively with sectors.
- Volatility-sensitive investors: The more volatility matters, the better factors perform—particularly Quality, which leads in risk-adjusted terms.
How we navigate?
Clients often ask why we approach the equity market from a factor perspective rather than a style or sector perspective. The answer is simple: more predictable returns.
Our recent experiment showed that sector strategies tend to dominate the extremes in excess return rankings—taking both the top and bottom spots. When volatility targets or restrictions are part of the equation, factors have historically held, and are likely to continue holding, the upper hand in risk-adjusted terms.
This year provided a clear example. Idiosyncratic risks—such as tariff announcements on specific product categories—often hit entire sectors at once. While factors can be correlated, they remain better diversified. Tariffs are designed to protect or penalize sectors, not factors.
That said, tactical sector bets can still make sense, especially to express high conviction views. A strong view about a specific business cycle phase can lead us to take sector positions. But these will always be in addition to our strategic focus on the Quality, Dividend Strength and Minimum Volatility factors.
1. We present annualized monthly equity returns for developed markets relative to the MSCI World benchmark.
2. Our business cycle indicator defines four distinct states: slowdown, contraction, recovery and expansion.
This marketing document was produced by one or more companies of the Vontobel Group (collectively "Vontobel") for institutional clients. This document is for information purposes only and nothing contained in this document should constitute a solicitation, or offer, or recommendation, to buy or sell any investment instruments, to affect any transactions, or to conclude any legal act of any kind whatsoever. Views expressed herein are those of the authors and may or may not be shared across Vontobel. Content should not be deemed or relied upon for investment, accounting, legal or tax advice. Past performance is not a reliable indicator of current or future performance. Investing involves risk, including possible loss of principal. Vontobel neither endorses nor is endorsed by any mentioned sources. Although Vontobel believes that the information provided in this document is based on reliable sources, it cannot assume responsibility for the quality, correctness, timeliness or completeness of the information contained in this document. Except as permitted under applicable copyright laws, none of this information may be reproduced, adapted, uploaded to a third party, linked to, framed, performed in public, distributed or transmitted in any form by any process without the specific written consent of Vontobel. To the maximum extent permitted by law, Vontobel will not be liable in any way for any loss or damage suffered by you through use or access to this information, or Vontobel’s failure to provide this information. Our liability for negligence, breach of contract or contravention of any law as a result of our failure to provide this information or any part of it, or for any problems with this information, which cannot be lawfully excluded, is limited, at our option and to the maximum extent permitted by law, to resupplying this information or any part of it to you, or to paying for the resupply of this information or any part of it to you. Neither this document nor any copy of it may be distributed in any jurisdiction where its distribution may be restricted by law.
Read next:
2026 Large Language Models OutlookRelated insights

2026 Large Language Models Outlook

2026: Multi Asset Reloaded - Investors (Still) Need Diversification

Global rates: a mirage of diversification

The signals beneath the surface

When Many Own the Same Few
