How do we play covered calls?
Multi Asset Boutique
Premium Equity Income (3 of 3)
How do we play “covered calls”?
In this three-article series, we take an in-depth look at covered call strategies. In the first article, we introduced the basic workings (the ‘What’) of a covered call strategy. In the second, we argued why covered calls offer a compelling way to play equities in the new decade (the ‘Why’). In this third article, we give a glimpse into our investment capabilities (the ‘How’) and provide readers with details on how to capitalize on the opportunity.
In the second article, we showed three different analyses, all pointing to more moderate returns for equity markets when compared to the last decade, all pointing to more moderate returns for equity markets when compared to the last decade. This, as explained in the first article, is an ideal scenario for covered call strategies.
The question is now obvious: how shall we use covered calls to profit from moderate returns in equities? In brief, our approach blends a portfolio of selected equities with a dynamically adjusted option overlay. It benefits from the robustness of a systematic strategy, while adapting to market conditions through active management. This differentiates it from more traditional, static approaches.
The Evolution of Covered Call Strategies
While covered calls are simple in principle, they require careful implementation for them to yield the desired results. A brief overview of approaches available to investors is warranted at this stage.
Discretionary approaches to covered calls were the first to become available. In such cases portfolio managers decided opportunistically on which calls to write and when. Results often fell short of expectations. Specifically, income generation was often too low to significantly impact portfolio performance.
Systematic approaches were those who appeared next. Also referred to as buy-write index strategies, these approaches mechanically implement covered calls on the totality of the stock portfolio (corresponding to a coverage ratio of 100 percent). These strategies also showcased mixed results, as they generally provide limited upside potential in rising markets and still expose investors to downside risks during downturns.
Given the limitations discussed above, we developed a different approach.
Where does our approach differ?
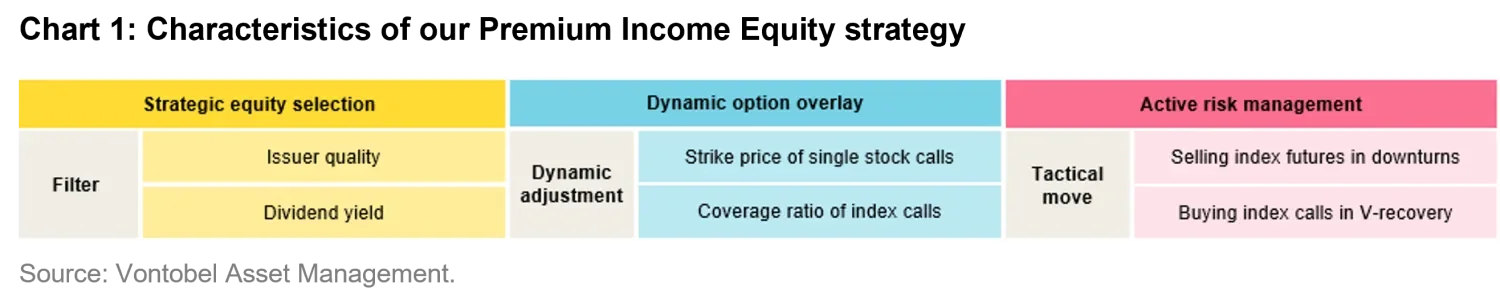
Our approach (which we call Premium Equity Income) differs from others in that it consists of three (and not just one) sources of alpha, as showed in Figure 1: strategic equity selection, dynamic option overlay, and active risk management.
Strategic equity selection
Since investors approaching covered call strategies are affine to income while seeking a resilient exposure to equity markets, it appears logical to us to begin with a long portfolio of high-quality equities, chosen for their attractive dividend yields and market resilience. This choice is poised to do well in sideways / mildly rising equity markets. Differently from a passive buy-write index, where typically no active selection takes place, we actively select a high-conviction portfolio comprising a limited number of issuers. There is typically a trade-off to be made between yield and quality. The higher the yield offered, the lower the quality (and vice versa). We thus look for securities offering an attractive trade-off between the two.
We measure quality via profitability metrics widely used in the accounting industry such as gross profit to assets, return on equity, and return on assets. These can adequately capture dimensions of company’s profitability at different levels of the income statement. Looking at the past 15 years, quality stocks not only outperformed, but they particularly shone during shocks, making them particularly suitable for our strategy.
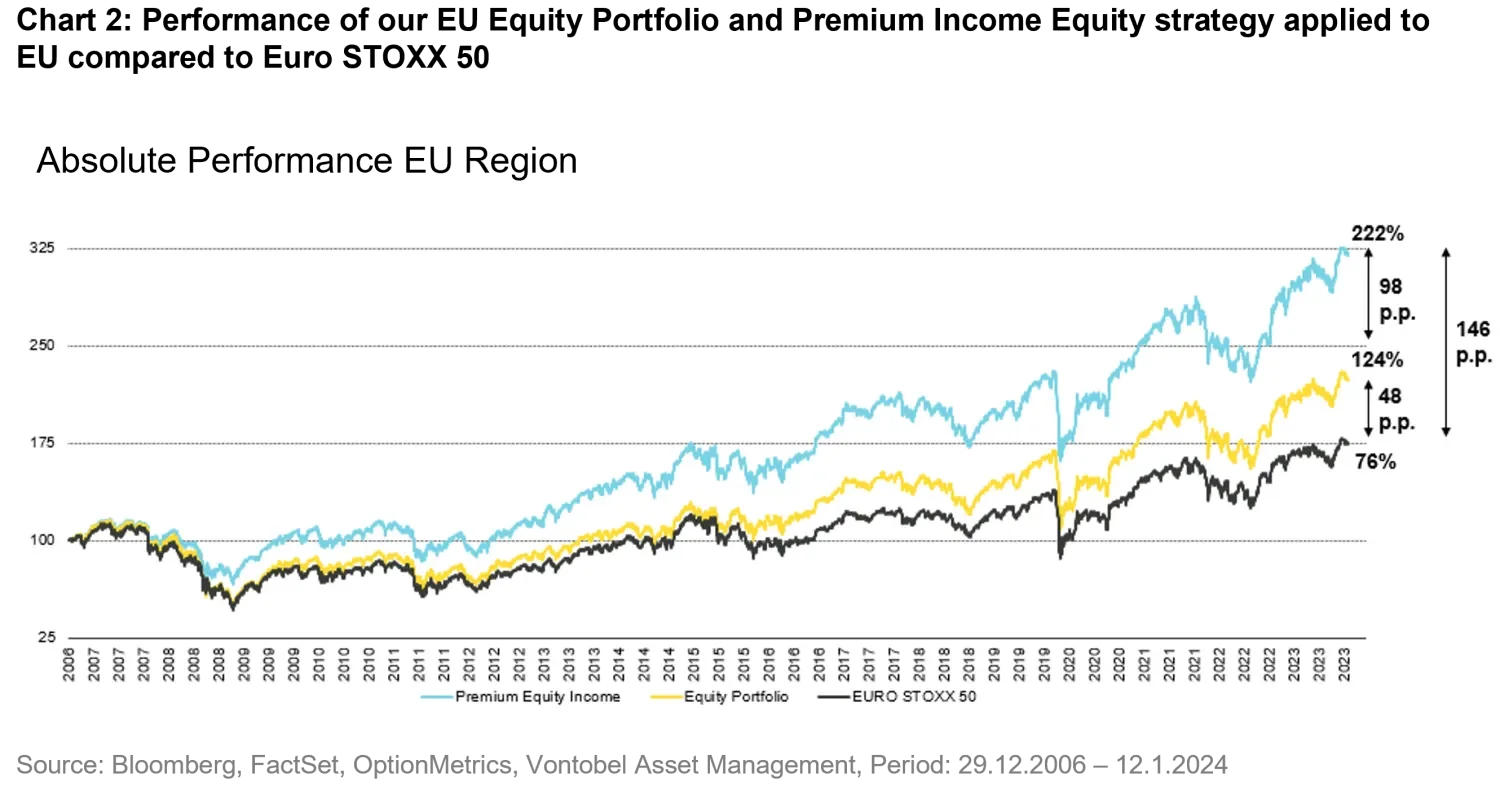
Figure 2 depicts the performance of our final selection of 30 issuers (based on the quality vs. yield trade-off) against the reference benchmark. Our strategic equity selection (yellow line) outperformed the Euro STOXX 50 benchmark (black line) by 48 percentage points during the 2003-to-2023 period.
Dynamic option overlay
Instead of mechanically implementing a purely systematic call option overlay, we choose strike price and coverage ratio dynamically based on market conditions. These two are the central parameters of the option overlay.
Strike price positioning relates to how far out of the current stock price we want to set the option strike. The closer the strike, the richer the premium, but the higher the risk of the option being exercised during rallies.
We want to avoid the option being exercised more than 50 percent of the time, since this leads to lower payouts for the strategy. In the discussion that follows, we speak of a portfolio made of only call options (i.e., no underlying stock portfolio is available).
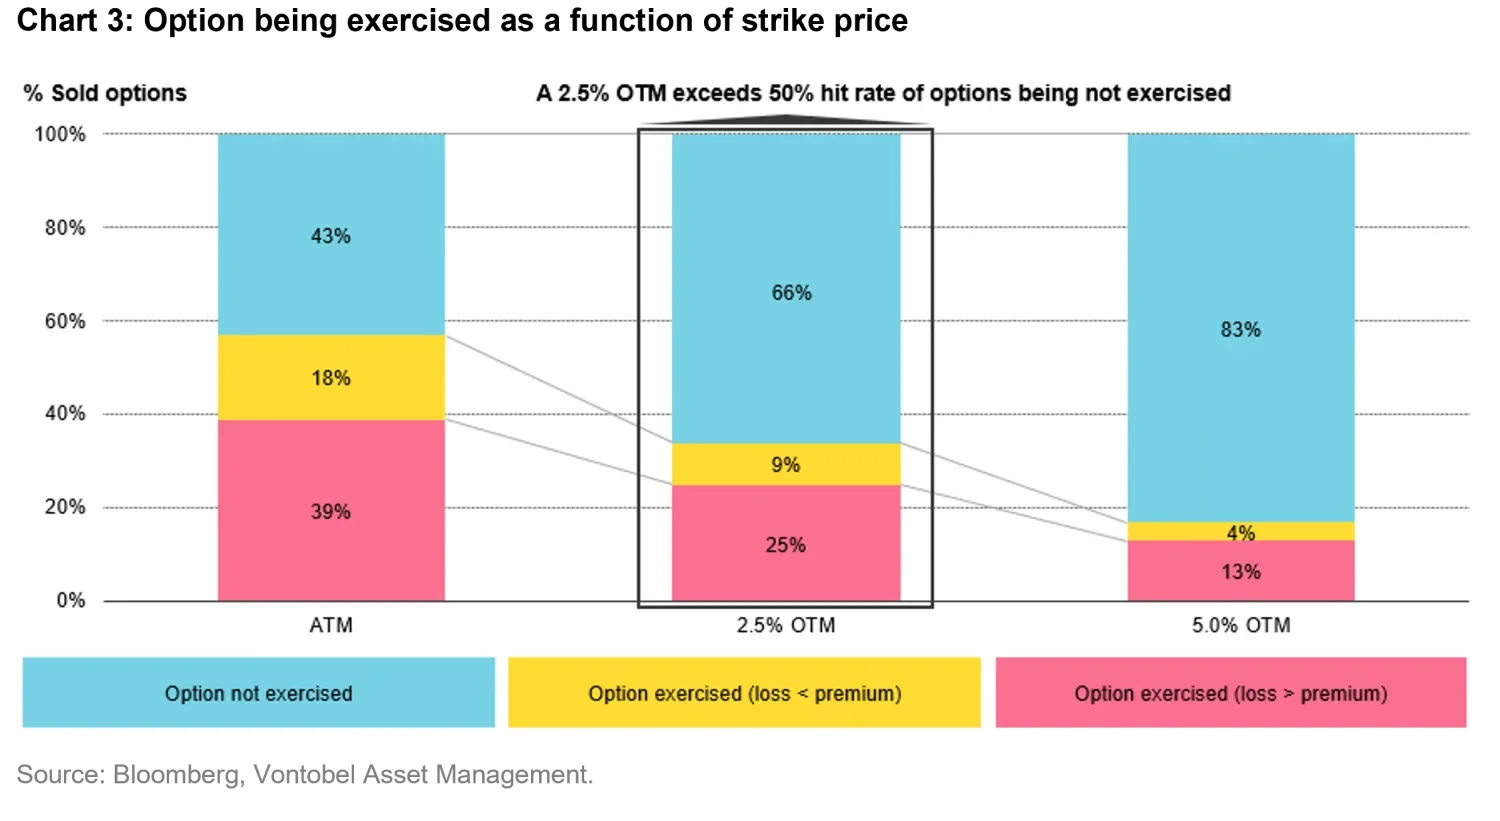
As shown in Figure 3, selling options at-the-money (aka ATM, i.e., with strike equaling the current stock price) leads to only 43 percent of them not being exercised (blue color). In 18 percent of the cases, while the option will be exercised, we will still come out with an overall profit (yellow color). In these cases, the option premium is higher than the loss for having to buy a stock at a higher price and selling it at a lower price to the option buyer. In 39 percent of the cases, the option will be exercised with us making losses greater than the premia obtained (colored in coral).
By selling 2.5 percent out-the-money (OTM), the favorable scenario of options not being exercised increases to 66 percent, which is above the 50 percent threshold we set.
While in theory one could look for the exact out-of-moneyness such that the percent of options expiring unexercised is 50 percent, we decided to go for 66 percent by setting the minimum OTM of 2.5 percent to ensure robustness and simplicity.
Going further out-of-the-money (e.g., 5 percent OTM) would increase this percentage further, but with the disadvantage of having lower premium.
Starting from this ‘default’ positioning at 2.5 percent, we then enhance performance by dynamically changing the strike of single stock calls between 2 percent and 6 percent. We do so based on prevailing market conditions. If we anticipated the stock to have limited upside potential, we sell at 2 per-cent, since keeping the (high) premium would be more advantageous. Conversely, if the opposite were true, we’d sell further OTM since we are fine to accept a lower premium in exchange for having an option which is less likely to be exercised.
We now bring back the discussion to our long equity portfolio. In what follows, we assume the call option overlay sits on top of a fully invested, long-only equity portfolio. In such a setup, the coverage ratio represents the other key parameter defining the strategy properties. As discussed, the coverage ratio represents the portion of the equity portfolio against which call options were sold.
A 100 percent coverage ratio means that calls were sold in an amount where, if all call options were exercised, we’d need to deliver to the buyer the entirety of the stock portfolio.
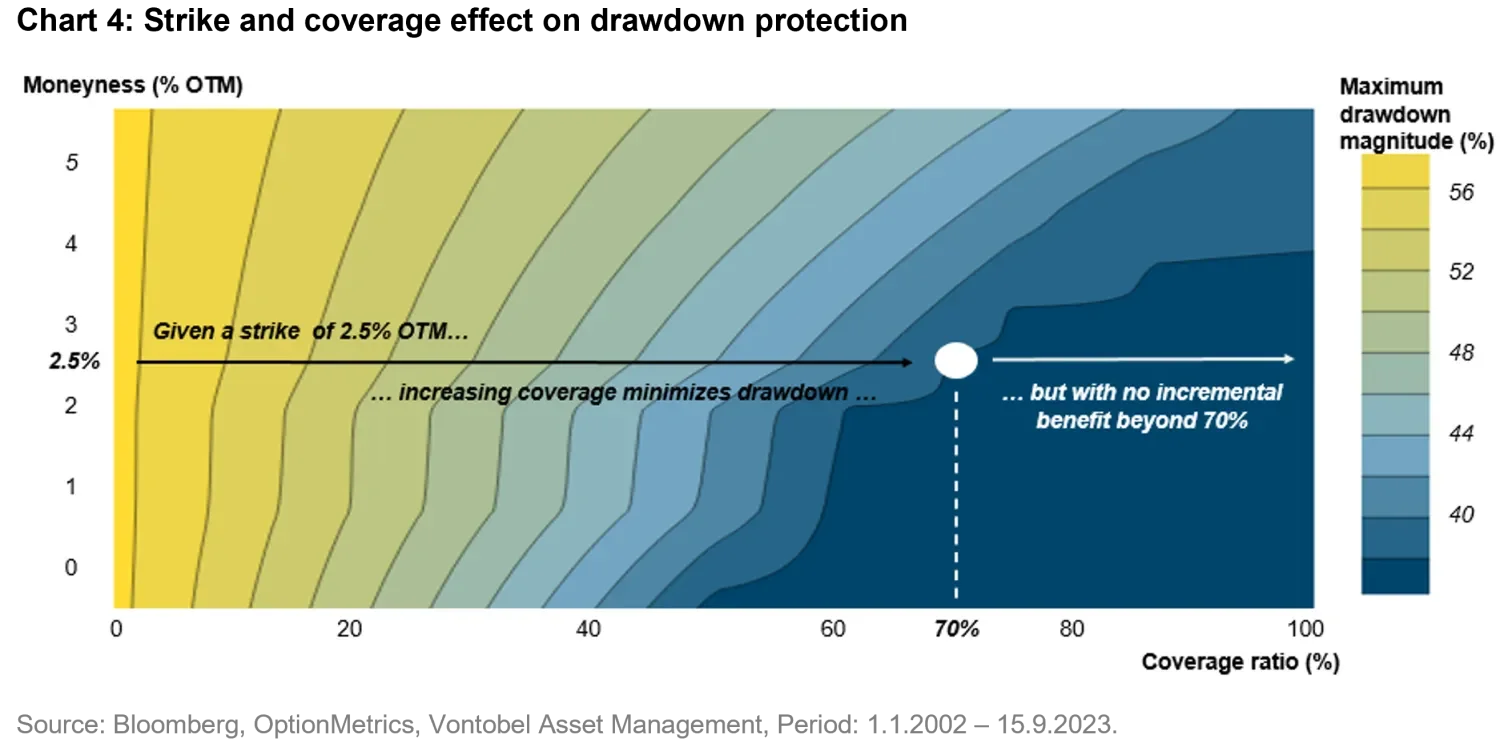
Figure 4 depicts the relationship between strike positioning (y-axis denoted as moneyness), coverage ratio (x-axis), and maximum drawdown magnitude (whose magnitude is represented by the color in the chart). For example, by choosing a strike positioning of 2.5 percent, one can see that the higher the coverage ratio, the smaller the maximum draw-down magnitude (i.e., the stronger the downside protection). However, there is a ceiling effect at around 70 percent coverage, beyond which no incremental benefit is palpable. Like for the strike price, we adjust the coverage ratio dynamically. Starting from a ‘default’ coverage of 50 percent, achieved through single stock calls, we adjust it by writing index calls in a range between 0-20 percent of the portfolio. Therefore, overall, the ratio can range between 50 percent and 70 percent. The basic idea is that, if we anticipate a market drop, we increase the coverage ratio. This allows us to collecting premia that are less likely to be exercised. As you will have noted, we modulate the coverage ratio via index calls (i.e., call options written on the equity index) rather than single stock calls.
The reason is that index calls allow us to tactically change the coverage ratio base more nimbly (since they are more liquid) and more simply (we don’t have to act on each stock individually, but rather on the whole market).
Active risk management
The strategy is then further enhanced with tactical moves to solve two additional problems posed by traditional strategies: drawdown blunder and V-shaped recovery misses.
Drawdown blunder refers to the fact that simple covered call strategies only provide limited downside protection in case of big downturns. In some cases, investors need more. Let’s exemplify this with an example. Assume we sell OTM options on a USD 100 stock portfolio and collect premia that are about USD 2 (i.e., 2 percent of the notional exposure). If markets were to tumble by 10 percent, the portfolio’s value would only drop by 8 percent, but 8 percent may still be too much.1
We solve this problem by selling index futures to further reduce exposure in anticipation of significant drawdowns. This tactical exposure reduction is dynamic, ranging be-tween 0-30 percent of the portfolio and allows the strategy to have additional downside protection.
V-shaped recoveries are situations in which the market, after a significant decline, experiences a robust rebound. Consider this extreme scenario: markets are at 100, and they experience a 20 percent drop to 80. Assume we sell then the options exactly at this trough (i.e., at the worst possible time). Now, imagine that the markets rally back up by 25 percent, ending up again at 100. Since all the options would be exercised in this scenario, the benefit from the upward movement would be limited to the increase from 80 to the strike price, rather than the full recovery back to 100. This is how covered calls limit the upside potential during re-bounds.
We solve this problem with a tactical buying of index calls when we estimate that we are close to the trough and ahead of a rebound. To time the purchase, we use the insight that the strongest the drop, the strongest the likelihood of recovery. This allows the strategy to restore upside participation in case of a V-shaped recovery.
From Theory to Practice
Our strategy is applicable across diverse equity markets, spanning regions such as the United States, European Union, and Switzerland. While principles are adaptable and scalable to multiple geographical contexts, our research indicates that region-specific tuning of the strategy parameters works best.
Depending on the circumstances, the strategy can be conceived as an overlay on top of an existing portfolio.
Figure 2 shows the performance over the last 15 years of our Premium Equity Income strategy (made of the single stock portfolio and the option overlay) in the European region. The strategy for EU stocks has outperformed the benchmark index, delivering an average annual return of 6.6 percent, cumulating into the outperformance by 48 percentage points. Total returns of the overall strategy surpassed those of the Euro STOXX 50 by 146 percentage points since 2006 (222 percent vs. 76 percent), consistently delivering superior results to investors.
1. Note that, for simplicity’s sake, we are not considering the time-value of the option, but only its value at expiry. This simplification is legitimate for the case considered.
Read next:
Why covered calls?Related insights

Why covered calls?
