
What are covered calls?
In this three-article series, we revisit covered call strategies. In this first article, we introduce the basic workings – the “what” – of covered calls.
In this three-article series, we revisit covered call strategies. In the first article, we introduced the basic workings (the ‘What’) of a covered call strategy. In this second article, we argue why covered calls offer a compelling way to play equities in the new decade (the ‘Why’). In the third, we give a glimpse into our special investment capabilities (the ‘How’) and provide readers with details on how to capitalize on the opportunity.
In the first article, we showed that, if equity markets rose vigorously, investors would be better off with a long stock position. On the contrary, if equity markets rose slowly, or moved sideways, a covered call approach would yield better returns.
So where do we think equity markets will go? We will answer the question by comparing the recent history (i.e., the last decade) for rolling returns, stock valuations, and premia decomposition in the context of long-term history. To mention the conclusion upfront, our analyses point to a new regime of more moderate returns. This would be an optimal scenario for covered call strategies.
Figure 1 shows the 10-year rolling average of the S&P 500 annual returns over the last 200 years. Over the centuries, various peaks can be observed, but the general tendency is for mean reversion to occur thereafter. As an example, the post WWII period showed rolling averages above 10 percent for some years, before reverting to the mean in the 60s.
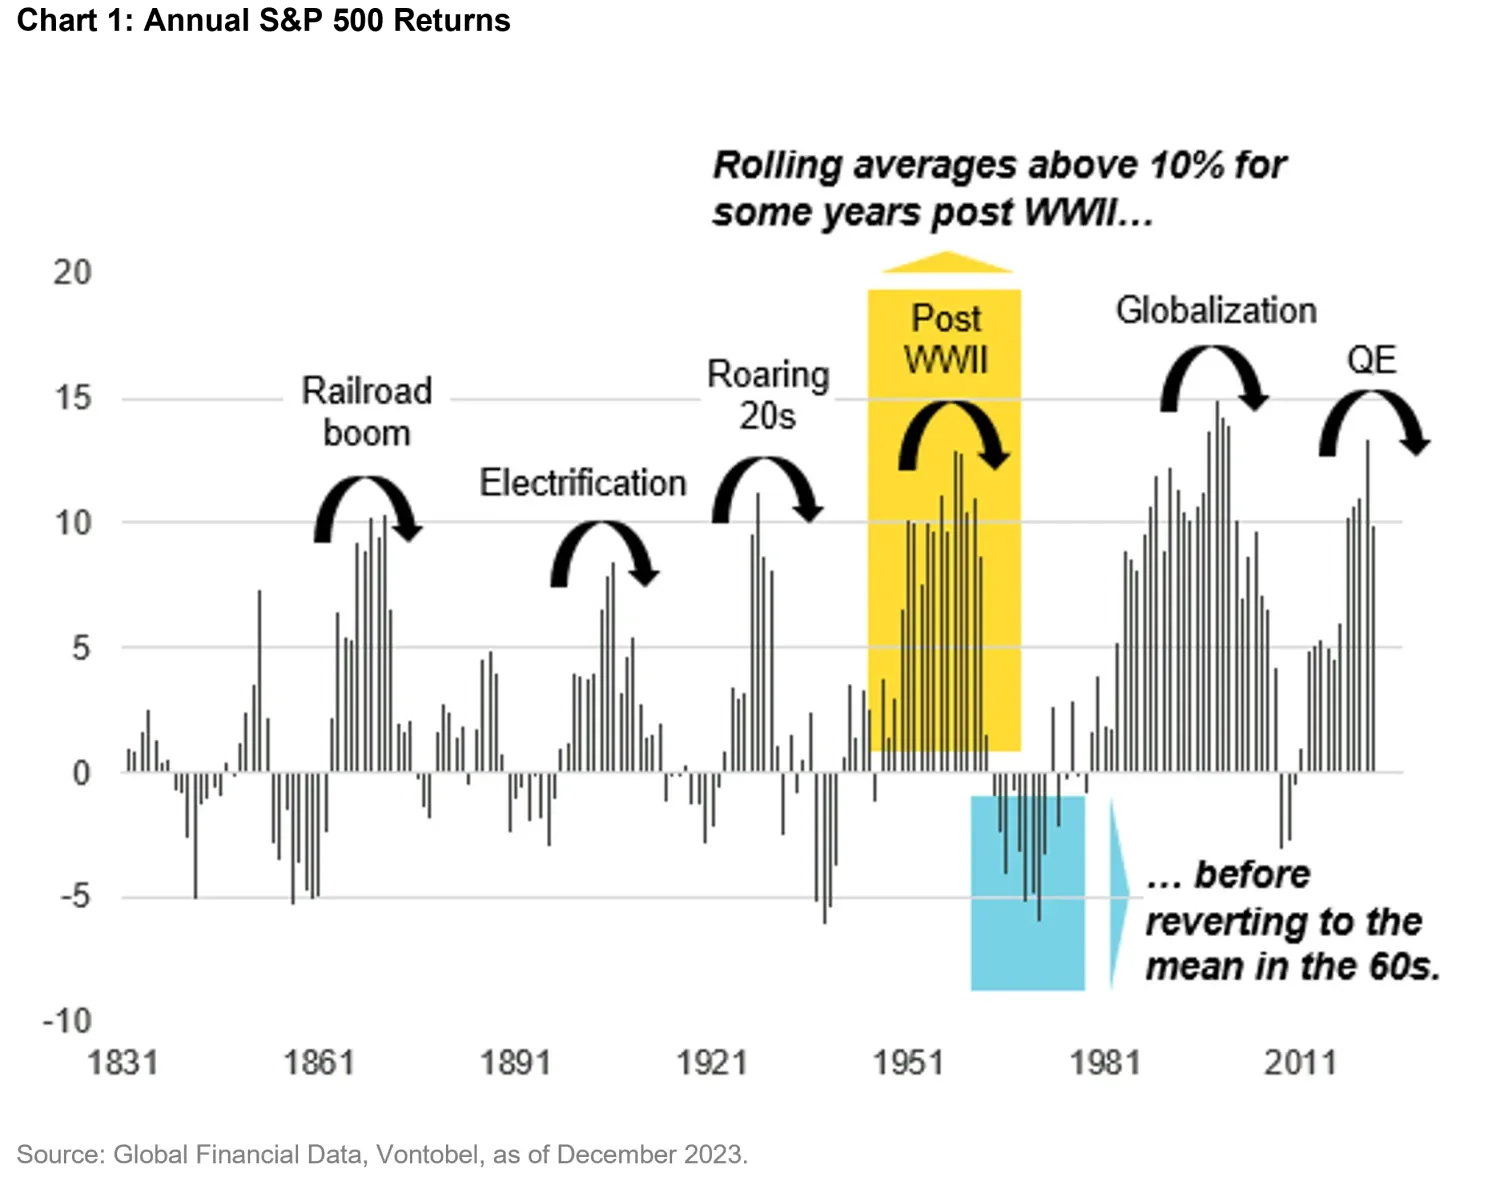
In recent years, US equities also experienced a robust bull market, with rolling averages consistently around 10 percent. We argue that this scenario is not sustainable in the long run. This analysis points to lower returns being more probable than not.
Figure 2 plots the Shiller P/E ratio, defined as stock prices divided by the moving average of the past ten years of earnings, adjusted for inflation, over the last 150 years. The ratio is useful to understand whether the stock market is under/overvalued at any given point in time. Due to its adjustments for inflation and cycles, the ratio is a more robust indication of long-term over-/under-valuation compared to the classic P/E ratio.
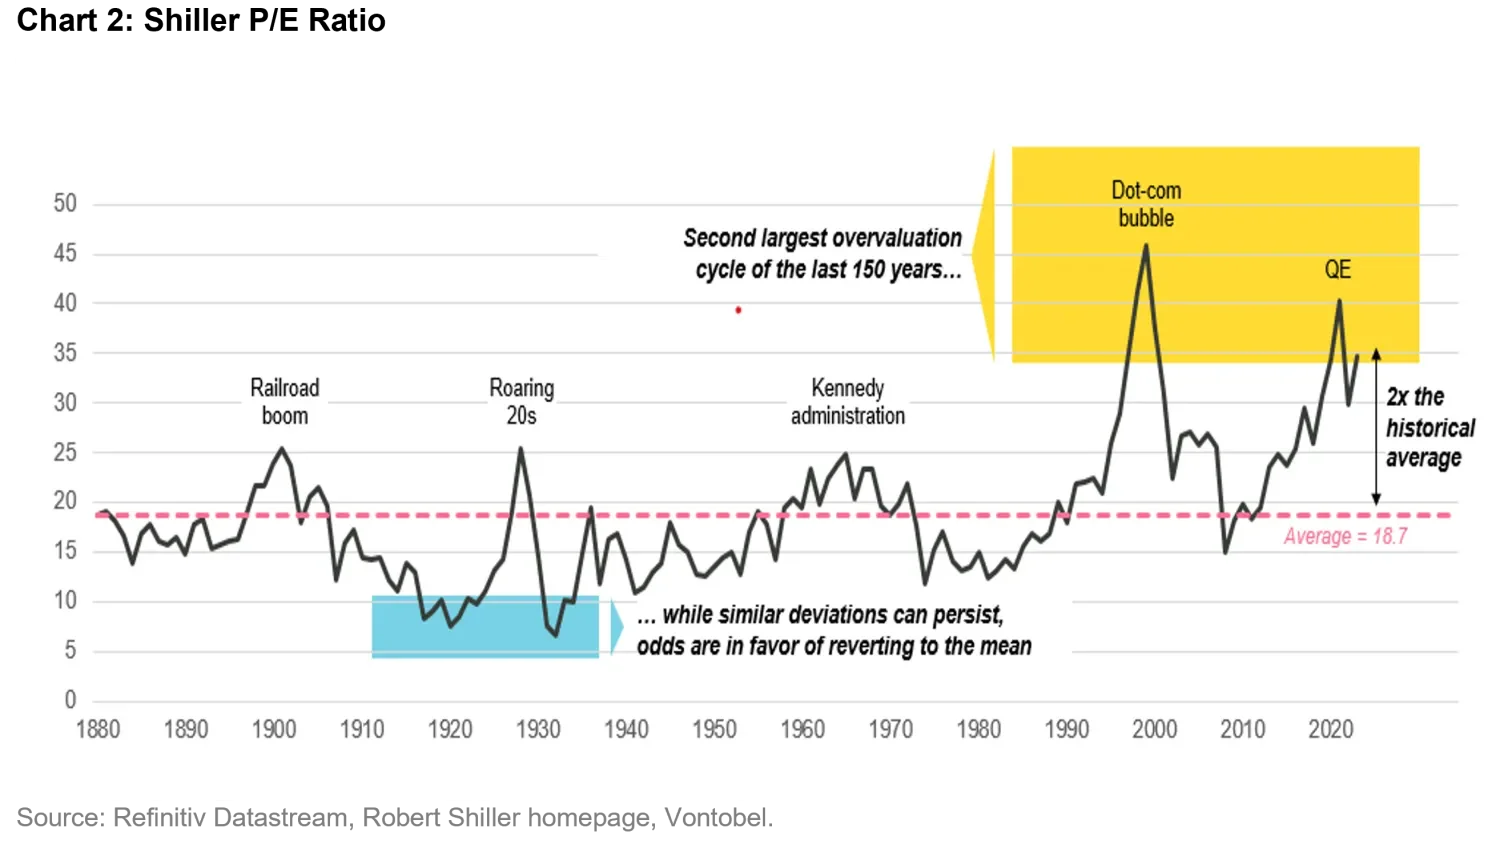
While deviations from historical averages can persist, there exists, also in this case, a significant likelihood of a reversion to the mean over time. Recent years have seen a period of elevated valuations, with the ratio standing at twice the historical average. The fact that we are witnessing the second-highest overvaluation of U.S. Equities in history suggests more moderated long-term return expectations for the future.
Figure 3 decomposes the historical S&P 500 yearly excess returns (equity premia) into its four main components – real cash return, real earnings growth, multiple expansion, and dividend yield – between 2013-2023 (short-term history) and 1950-2023 (long-term history).
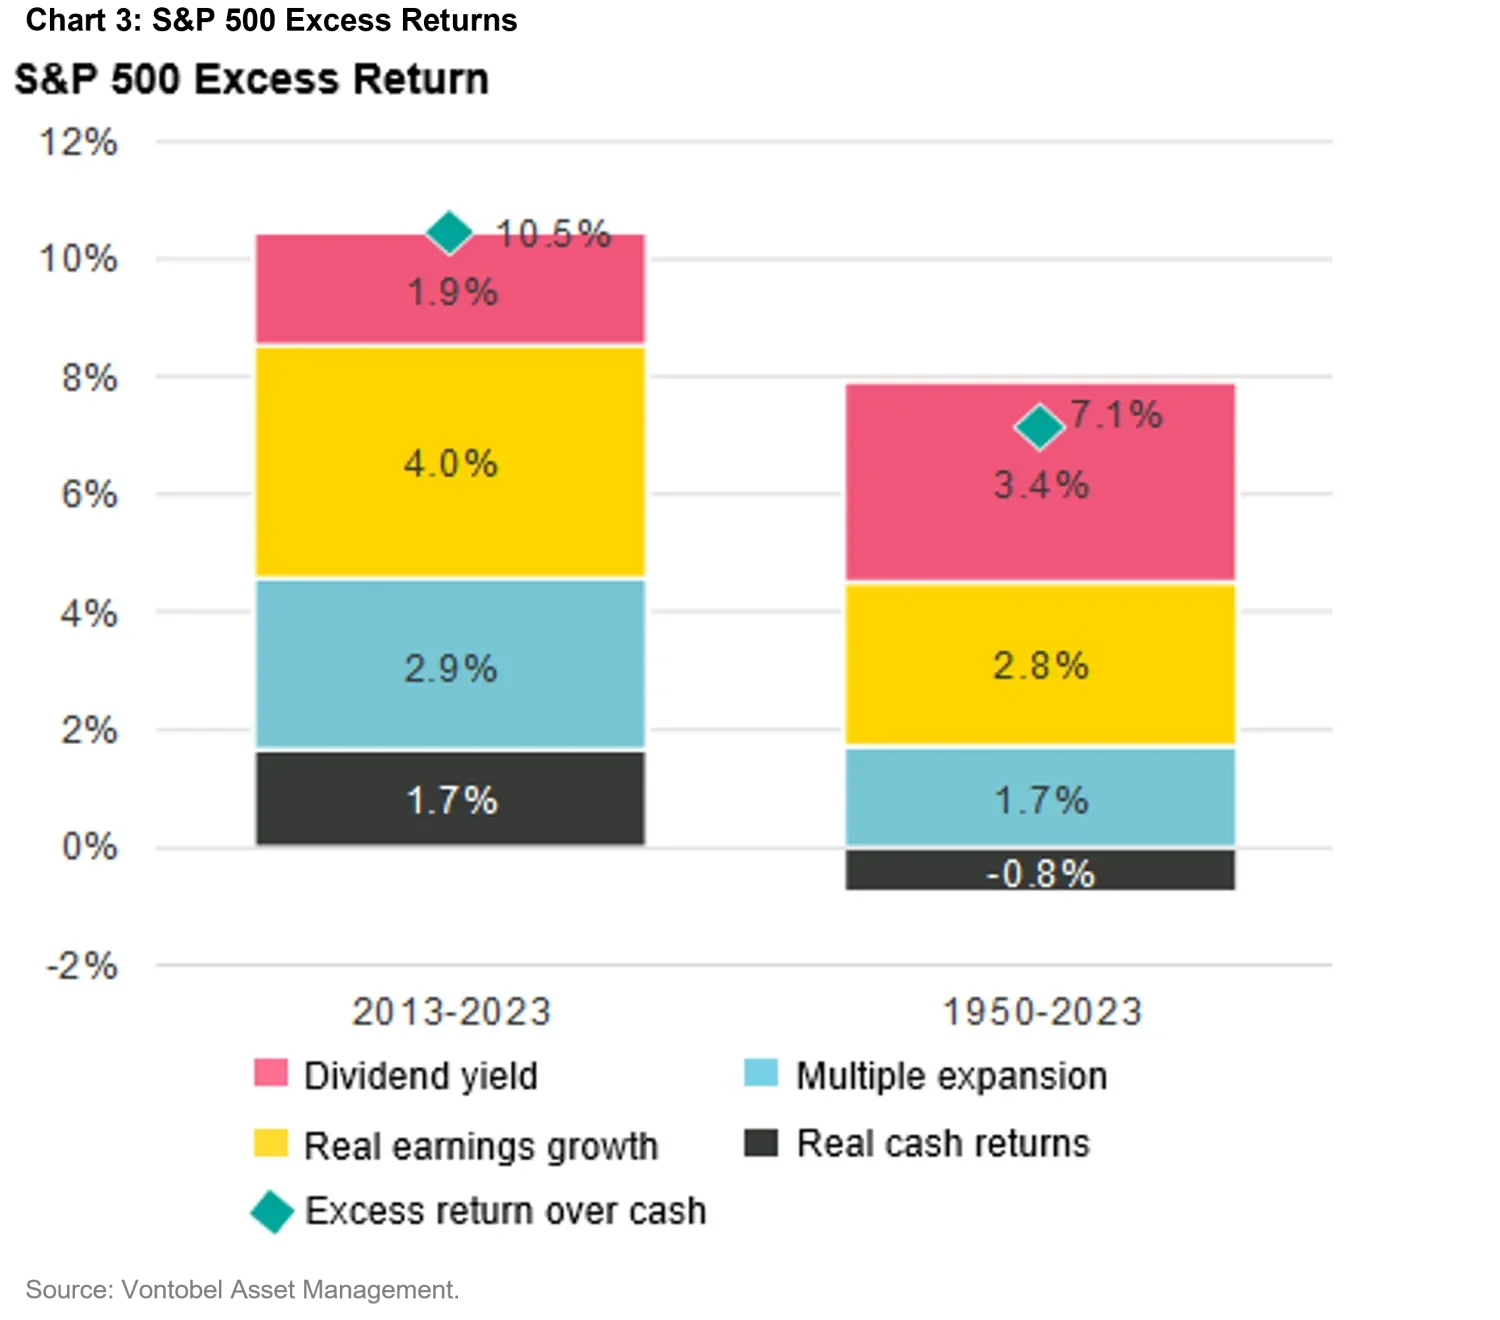
The above-average excess return of the last decade (standing at 10.5 percent p.y. for the 2013-2023 period vs. 7.1 percent p.y. for the 1950-2023 period) was driven by high multiple expansion and high real earnings growth, both of which were much higher during the last decade: 2.9 percent vs 1.7 percent for multiple expansion and 4.0 percent vs 2.8 percent for real earning growth. These are exceptionally high numbers, which we think will revert to the historical mean in the next years.
Simply put, imagining a future with excess return as high as the last decade would require a repeat of the exceptionally high earning growth and expanding valuations seen in recent years.
On a positive note, assuming a reversion to the mean would indeed occur, note how dividends may provide an attractive opportunity to investors to extract income out of equity markets. The long-term dividend yield (towards which we expect equity markets to converge in the future) stands at 3.4 percent vs. 1.9 percent for short-term history.
Dividends, in the same vein as the call option premia discussed in the first article of this series, are a way for investors to extract income from equity markets. If equity markets were to grow less vigorously than in the recent decade, income – if harnessed properly – will represent a more significant source of total investor returns.
Seen mathematically, covered call strategies may provide the extra source of income which we think investors should expect in coming years, as per Figure 3. When added to 7.1 percent the long-term decomposition of the equity premia as depicted in Figure 3, “income” may restore the 10.5 percent excess equity returns seen in the last decade. In that sense, covered call strategies provide investors with a mechanism to smooth equity market returns throughout cycles (and keep them double digit).
Our analysis anticipates a more moderate bull market in the coming future, with equity returns reverting to historical means.
Covered calls – as well as high dividend stocks – represent an opportunity to investors to restore a higher equity premium, one that is comparable to the high levels of the last decade. Both opportunities compensate with “income” the lower expected returns coming from capital appreciation.
As described in the article, the devil is in the details (we said “if harnessed properly” in the article – while this is simple in principle – it requires care and attention when deployed).
In the next article, we will describe our approach, and delve into its benefit compared to more traditional approaches that are nowadays available.