Rating upgrades, inflows, and elevated risk appetite continue to propel EM hard currency bonds
In our previous emerging markets (EM) quarterly outlook, we highlighted two forces contributing to tighter spreads among EM hard currency issuers: an accelerating trend of EM sovereign rating upgrades and the return of inflows into the asset class. Over the past three months, these two trends have accelerated, leading to further spread compression, particularly among low-rated sovereigns, which have experienced the highest number of rating upgrades. We believe that these two trends, which have driven exceptionally strong returns year-to-date, will continue to support the asset class into 2026.
In 2025, the performance of hard currency sovereign and corporate bonds has diverged. The hard currency sovereign index (EMBI Global Diversified) delivered total returns of 13.5% in the first eleven months of the year, while the EM corporate index (CEMBI Broad Diversified) rose by 8.2% during the same period. The longer duration of the EMBI GD explains 83 basis points (bps) of the performance difference. For comparison, in 2022, when interest rates rose rapidly, the CEMBI BD outperformed due to its shorter duration. However, 414 bps of this year’s performance difference can be attributed to the tightening in EM sovereign spreads, which compressed by 92 bps during this period, while high-yield (HY) EM corporate spreads widened by 10 bps1.
A small portion of the underperformance can be attributed to the emergence of distressed situations in Brazil and other idiosyncratic stories, but since spread widening has occurred across most regions and many countries, this explanation is insufficient. Thus, we believe the main driver of the spread divergence is the divergent credit rating trends between sovereigns and corporates.
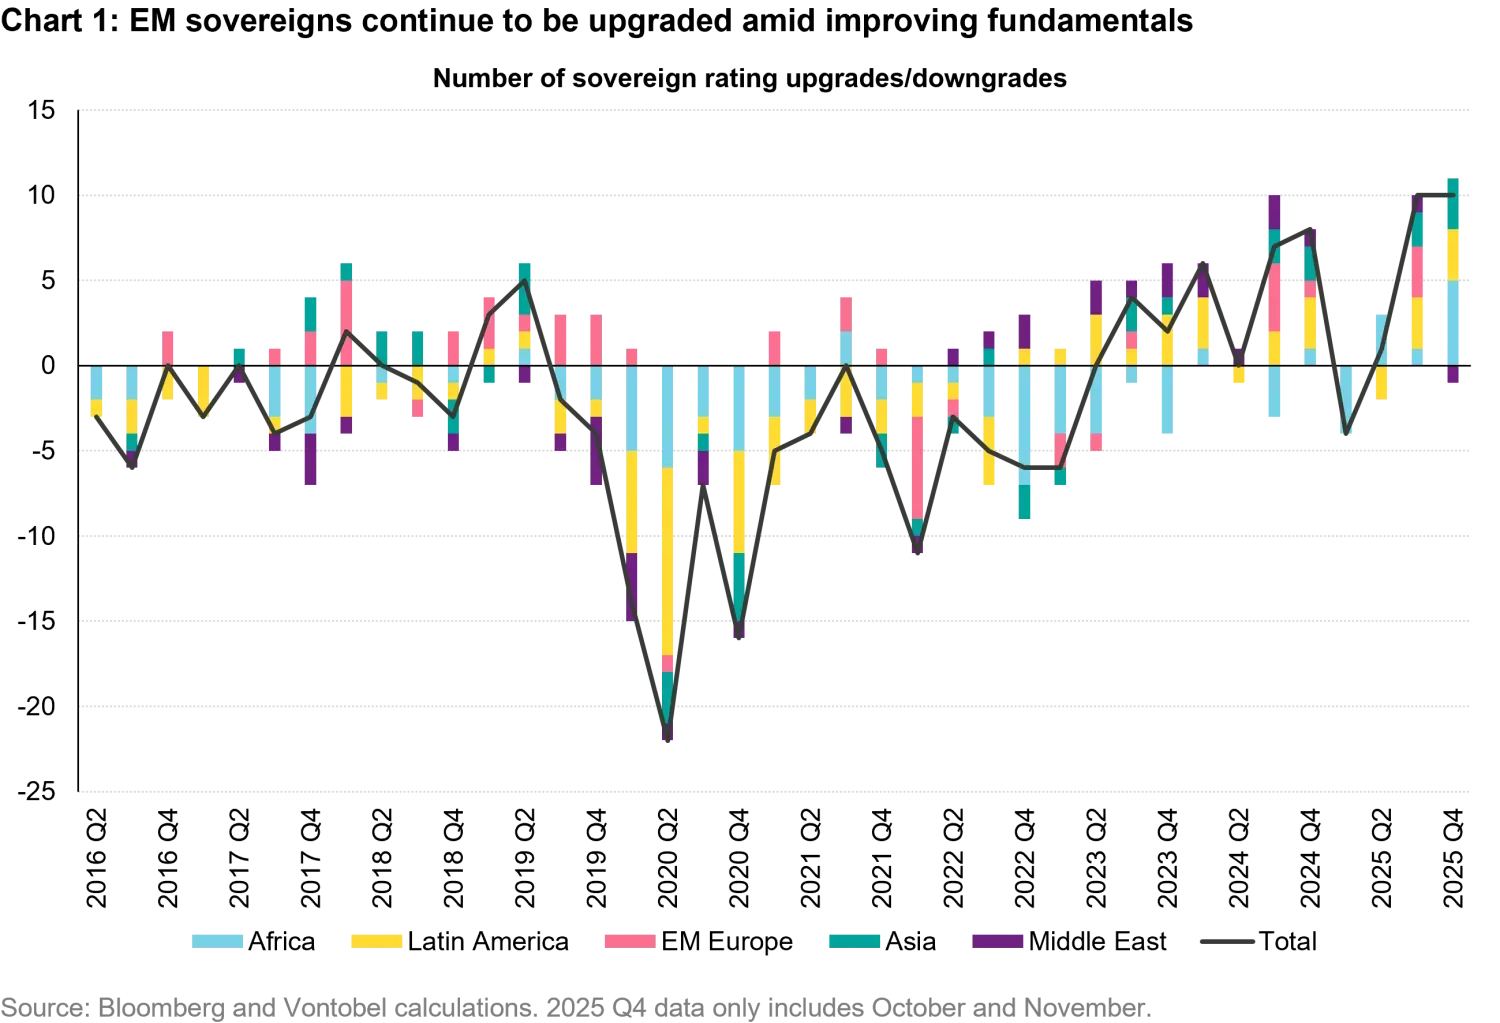
Third quarter net upgrades for EM sovereigns are strongest in over a decade
In October and November, 14 emerging markets and frontier sovereigns were upgraded, while only three were downgraded. This matches the net positive rating actions of the entire third quarter of 2025, the strongest quarter in over a decade. In contrast, EM corporates have experienced net downgrades since August, mainly in Latin America. This differs from the first half of 2025, when both sovereigns and corporates saw net upgrades.
However, this trend does not indicate weak corporate fundamentals overall. The 2025 EM HY corporate default rate of 3%, below 1% when including investment grade (IG) issuers, was below the historical average and is expected to remain this low in 2026. On the sovereign side, there were no defaults for the second consecutive year in 2025. While sovereign default rates are likely to remain low, a third consecutive year of zero defaults is uncertain due to unresolved distressed cases, such as Senegal and the Maldives, which together represent less than 1% of the benchmark.
This situation is unusual, as corporate credit rating trends typically lag behind sovereign trends. When a country's macroeconomic conditions improve, the financial health of private businesses usually follows months later, leading to corporate rating upgrades. Additionally, sovereign and corporate indices handle defaulted bonds differently. Defaulted sovereign bonds remain in the index and are often upgraded from default to CCC after restructuring. In contrast, defaulted corporate bonds are removed from the index, and any restructured or new bonds from these issuers are treated as new entries, not upgrades. This discrepancy affects trend comparisons, but there were only three sovereign upgrades from default (D) in 2025: Sri Lanka, Ghana, and Zambia. If corporate methodology mirrored that of sovereigns, more upgrades from D to CCC would likely be observed.
Rating trends between sovereign and corporates should begin to converge in 2026
If history is any guide, rating trends between sovereigns and corporates should begin to converge in 2026. Easing global financial conditions – driven by Federal Reserve (Fed) rate cuts, rate reductions by most EM central banks, and improved US dollar (USD) liquidity from rising foreign exchange (FX) reserves – are expected to compress corporate spreads as well. With very few exceptions, such as Panama and Rwanda, nearly all EM countries increased their FX reserves in 2025, strengthening their ability to repay external debt for both sovereigns and corporates. If rating trends converge as anticipated, EM corporate spreads, particularly in the HY segment, may offer greater value than sovereign spreads. However, this top-down outlook requires careful bottom-up selection, especially given recent unexpected distress in countries like Brazil.
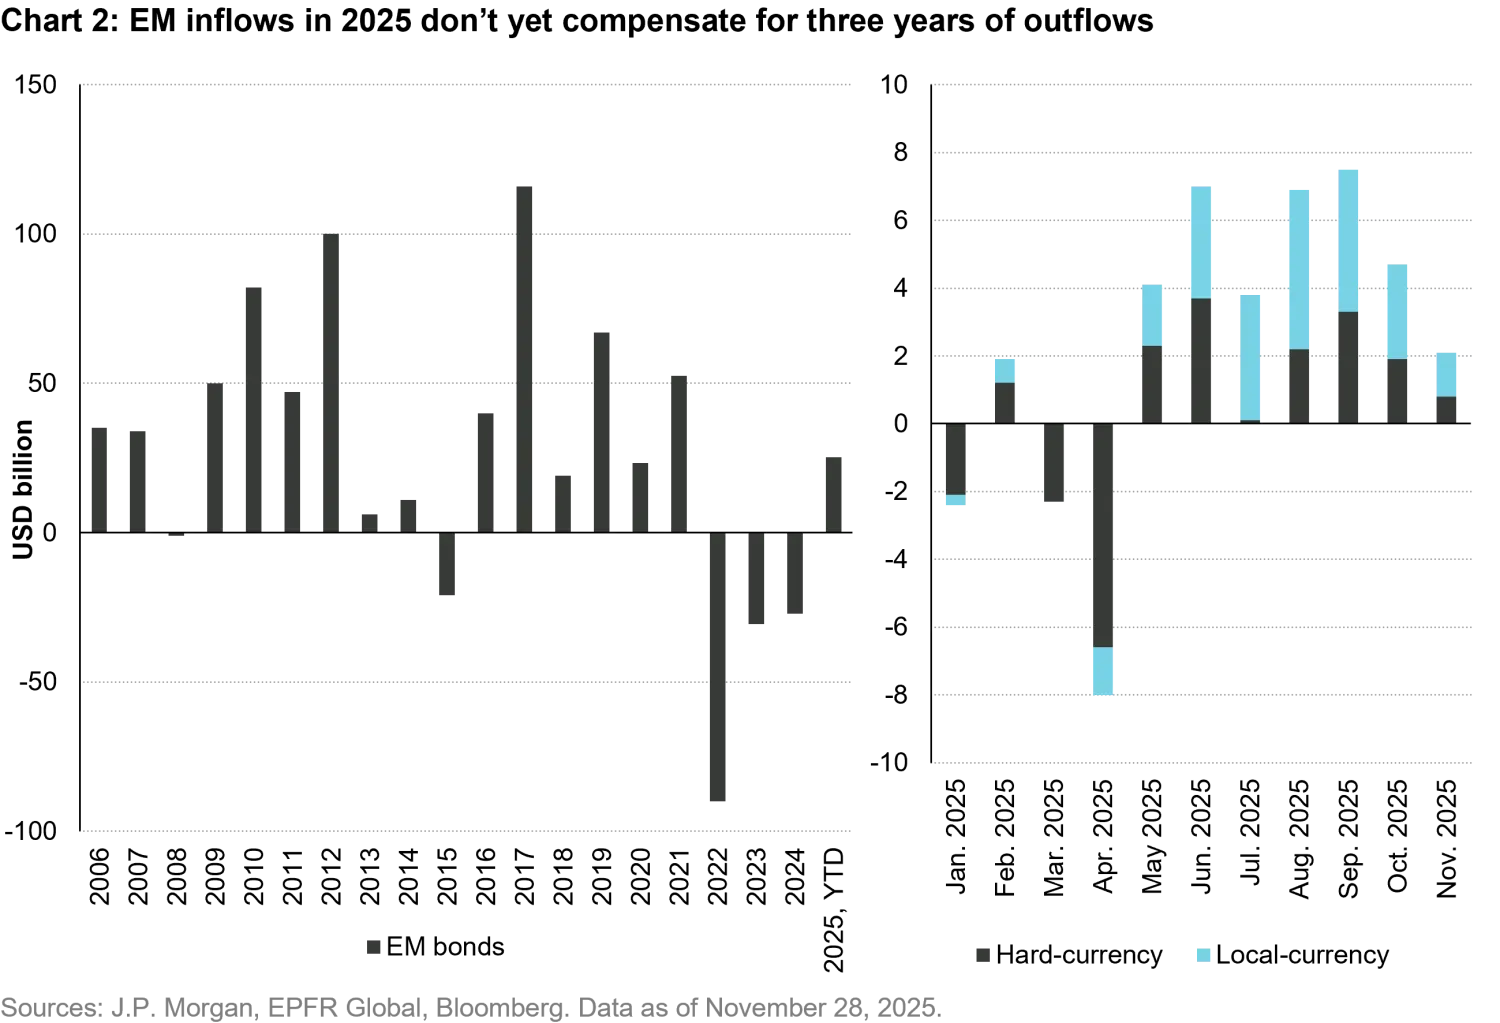
Continued inflows, rising demand and reduced supply likely to support EM bonds
Inflows into emerging market fixed income, a key driver of this year’s performance, are expected to continue into 2026. EM fixed income attracted USD 24 billion in the first 11 months of 2025, which only partially offsets the USD 34.1 billion outflows in 2024, let alone USD 30.7 billion in 2023, and USD 90 billion in 2022. These figures suggest that global allocations to EM fixed income remain well below historical levels, leaving room for further growth and strong demand for EM bonds.
On the supply side, EM sovereign gross issuance exceeded USD 250 billion in 2025, a new record, but this was partly due to countries regaining market access in 2024 and 2025 after losing access in 2022, creating pent-up supply. However, sovereign net financing needs are projected to decline in 2026, which should lead to lower gross and net issuance. Meanwhile, corporate bond net supply is expected to remain negative for the fifth consecutive year. With rising demand and reduced supply, technical factors are likely to continue supporting EM bonds in 2026.
Last quarter, we accurately identified these two key trends and added value through country allocation and bond selection. However, we may have been overly cautious. We noted that short-term upside potential was limited due to already tight spreads compared to historical levels. This caution was warranted, as total returns were less impressive than in the previous quarter. Nonetheless, sovereign spreads continued to tighten, particularly among HY bonds, driven by credit rating upgrades and strong risk appetite.
Easing trade uncertainty, lower recession risks, and an accommodative Fed should boost risk asset valuations
Looking ahead, we remain confident that risk assets, including EM fixed income, will perform well in 2026. Although valuations are less attractive than they were six months ago, several factors support our optimism. Trade uncertainty has eased, with most agreements now settled, tariff rates having peaked, and remaining deals likely to materialize or receive US exemptions, as seen with Brazil. While the US economy is slowing, recession risks appear lower, and a rebound in the second half of 2026 is possible, as the economy adjusts to higher tariffs. Additionally, the Fed’s easing cycle is expected to support US growth and loosen global financial conditions, which should boost risk asset valuations. Geopolitical risks have also moderated, particularly in the Middle East, while prospects for a Ukraine peace deal have improved, and rising tensions in Venezuela have limited global impact.
As we move into 2026, the current level of aggregate spreads suggests limited space for further compression among sovereigns. As a result, we prefer corporates, particularly in the HY segment. That said, we remain mindful of somewhat higher corporate risks amid the rapidly improving financing conditions for sovereigns, which have yet to translate into corporates in many countries.
Although sovereign spreads are historically low, some laggard countries may still experience further spread compression. Argentina and Ecuador are expected to regain market access in 2026, with spreads likely converging toward the average for B-rated sovereigns. Relative value opportunities also exist among less risky BB-rated countries such as Ivory Coast, the Bahamas, Uzbekistan, and Turkey. Even IG-rated countries present opportunities, such as Bulgaria, which will join the eurozone in 2026, and Mexico, where short-dated P-caps (pre-capitalized) bonds issued to manage Pemex’s short-term debt appear attractive.
In the corporate space, we find attractive valuations in Brazil, where recent contagion from a few idiosyncratic distressed cases and high domestic interest rates have driven up refinancing costs. These costs are expected to ease slightly in 2026 as the central bank begins cutting rates. Similarly, we believe Turkey offers appealing corporate valuations. Elevated interest rates and tighter fiscal policies have dampened consumer demand and constrained free cash flow recovery for companies. However, most Turkish companies still access hard currency debt markets to meet their funding needs. Additionally, Turkish banks are expected to see improved net interest margins next year as the policy rate and domestic funding costs gradually decline, boosting sector-wide profitability.
Bullish outlook for EM hard currency bonds in 2026, with slightly higher expected total returns for corporates
Our outlook for EM hard currency bonds remains bullish for 2026. We expect total returns between 3.4% and 9.9% for sovereigns and between 5.1% and 9.9% for corporates in our central scenarios. The higher expected total returns for corporates, despite their slightly lower yield to maturity, reflect their lower spread-duration sensitivity. This is relevant in the context of already tight spreads and limited potential for US Treasury yields to decline compared to one year ago.
Our outlook is subject to two US-centric risks:
A sharper-than-expected US economic slowdown could revive recession fears, triggering a correction in risk assets and wider EM spreads. However, the Fed would likely accelerate its easing cycle in this scenario, with duration gains partially offsetting the impact of spread widening. Total returns for EM bonds would likely remain positive.
The US economy could prove more resilient than expected. Looser fiscal policy ahead of midterm elections could result in higher-than-expected inflation and a hawkish policy reversal by the Fed. In this scenario, EM spreads would remain tight, but rising US Treasury yields could push total returns toward the lower end of our central scenarios.
Local currency
EM local currency continues to look bright into 2026
During the first 11 months of this year, emerging market (EM) local currency bonds delivered their best absolute return since 2009, achieving a performance of 17.5% (measured in US dollars (USD)). This significantly outpaced the returns of their hard currency EM counterparts. While the asset class performed well throughout the year, its outperformance relative to hard currency peers was primarily driven by a 10.4% decline in the USD during the first half of the year. In the second half of 2025, total returns for EM local currency bonds were between EM corporate bonds (CEMBI BD) and EM hard currency sovereign bonds (EMBIG Diversified).
We have maintained a bearish outlook on the USD and a bullish stance on EM local currency since Liberation Day, driven by four factors:
Expectations that the US economy would be more adversely affected than the rest of the world by the imposition of tariffs on its trading partners;
Narrower interest rate differentials, as a weaker US economy would prompt the Fed to resume rate cuts while other developed market (DM) central banks remain on hold or are hiking rates (e.g., the Bank of Japan);
Diminished confidence in US institutions due to unpredictable policies; and
The disinflationary impact of tariffs on the rest of the world.
These macroeconomic factors remain relevant today. However, our conviction in a weaker USD is not as strong as it once was.
EM local currency is well positioned, even if the USD does not weaken further
Although traditional macroeconomic trends suggest a weaker USD, the ongoing AI boom may continue to drive capital flows into US equity markets, potentially offsetting some or all of the relative macroeconomic weakness in the US. It is difficult to quantify the net effect of these two opposing forces. Therefore, we currently expect the USD to either remain range-bound through 2026 or to weaken further, albeit not as much as in 2025.
That said, EM local currency bonds can still perform very well even with a stable USD, as demonstrated in the second half of 2025. The USD began trading sideways in the third quarter once it became apparent that trade deals were forthcoming. It then recovered slightly, rising 2.6% between the end of June and the end of November as the US economy started to show signs of resilience. Despite this, EM local currency bonds delivered a healthy 4.7% return (11.5% annualized) between July and November, positioning them between EM corporate bonds (3.9% or 9.4% annualized) and EM hard currency sovereign bonds (7.2% or 17.9% annualized).
In fact, EM foreign exchange (FX) returns—the portion of the local currency index performance attributable to pure currency gains—were +1% over the last three months, even though the USD strengthened by 1.7% (as measured by the US Dollar Index (DXY)) against major global currencies. This highlights that the asset class is well positioned to continue delivering solid returns, even if the dollar does not weaken further.
To explain why we remain bullish on EM local currency bonds despite our reduced conviction in a weaker dollar, we will adopt two perspectives. First, we will take a historical approach by reviewing over 20 years of performance for this asset class across different USD regimes. Second, we will examine EM-specific factors that are likely to support the asset class's performance in 2026.
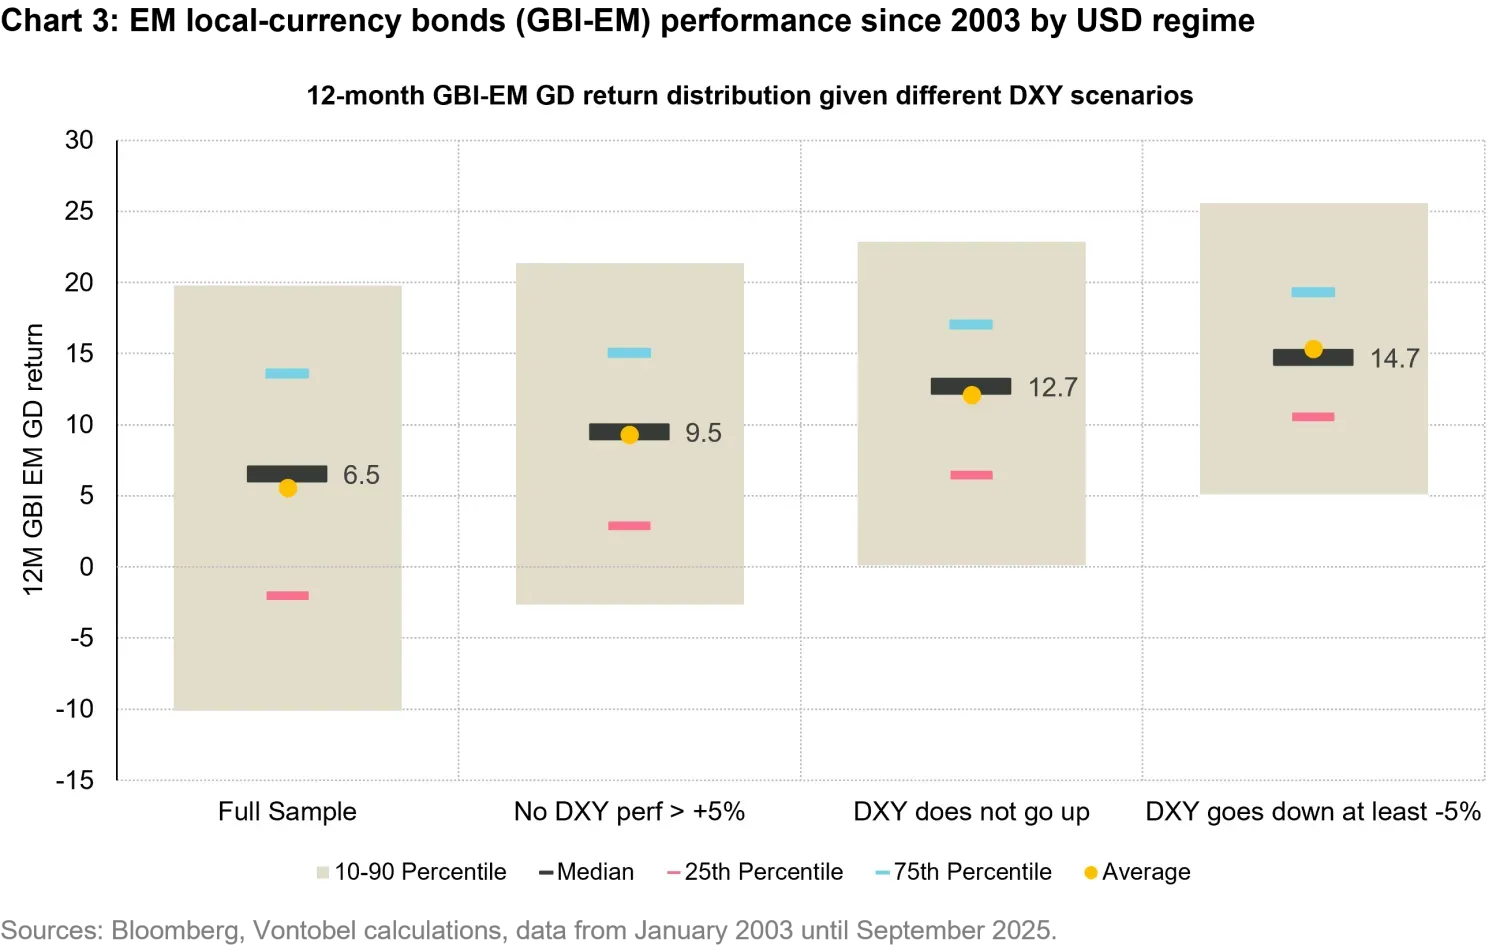
Looking at more than 20 years of data for EM local currency, we observe a median annual return of 6.5% (in USD) since 2003, with a wide range of returns (see the “Full Sample” column in Figure 1). When we exclude periods during which the USD rallied by more than 5% over a 12-month period, the median return increases to 9.5% (see the “No DXY” perf > +5% column). If we further eliminate all periods of USD rallies, the median 12-month return for the asset class rises to 12.7% (see the “DXY does not go up” column). Finally, periods when the USD declined by at least 5% (such as 2025) the median 12-month return for the asset class increases to 14.7%.
Given the macro environment described above, we believe it is unlikely that 2026 will experience a USD bull run. Therefore, this historical perspective suggests relatively high return expectations for EM local currency bonds.
Statistics don’t drive returns, so let’s examine factors likely to support EM local currency bonds in 2026. At the index level, GBI-EM’s 5.9% yield-to-maturity may seem relatively low but reflects higher average credit quality and a bias toward low-yielding Asia, suggesting slightly lower return expectations compared to its hard currency counterparts, assuming no significant market developments occur over the next 12 months. However, markets are constantly evolving, so while yield-to-maturity is a reasonable predictor of expected returns over the long term, it is less reliable over a shorter 12-month horizon. Our macro outlook anticipates that the USD will likely remain range-bound, as it has over the past five months, or potentially decline further, perhaps by one standard deviation (4.8%).
Furthermore, we believe EM FX has a strong chance of outperforming major non-USD developed market currencies due to two key factors. First, EM inflation is typically higher than DM inflation – which leads to nominal EM FX depreciation over the long-term. However, the current inflation differential between EM and DM is minimal: most of Asia is experiencing either deflation or significantly below-target inflation; South Africa recently lowered its inflation target to 3% (from 4.5% ± 1.5%); and inflation expectations in Brazil are finally declining.
As a result, inflation expectations for the GBI-EM index as a whole have dropped to 2.8% for 2026, slightly below the 2.9% expected for the US. Therefore, while nominal yields for EM local currency bonds may not appear particularly high, they are quite attractive in real terms (when accounting for relative inflation). Moreover, this ongoing disinflation in EM economies not only supports EM currencies but should also enable EM central banks—such as those in Brazil, South Africa, Hungary, and Poland—to cut interest rates in 2026, likely resulting in duration gains for EM local currency bonds.
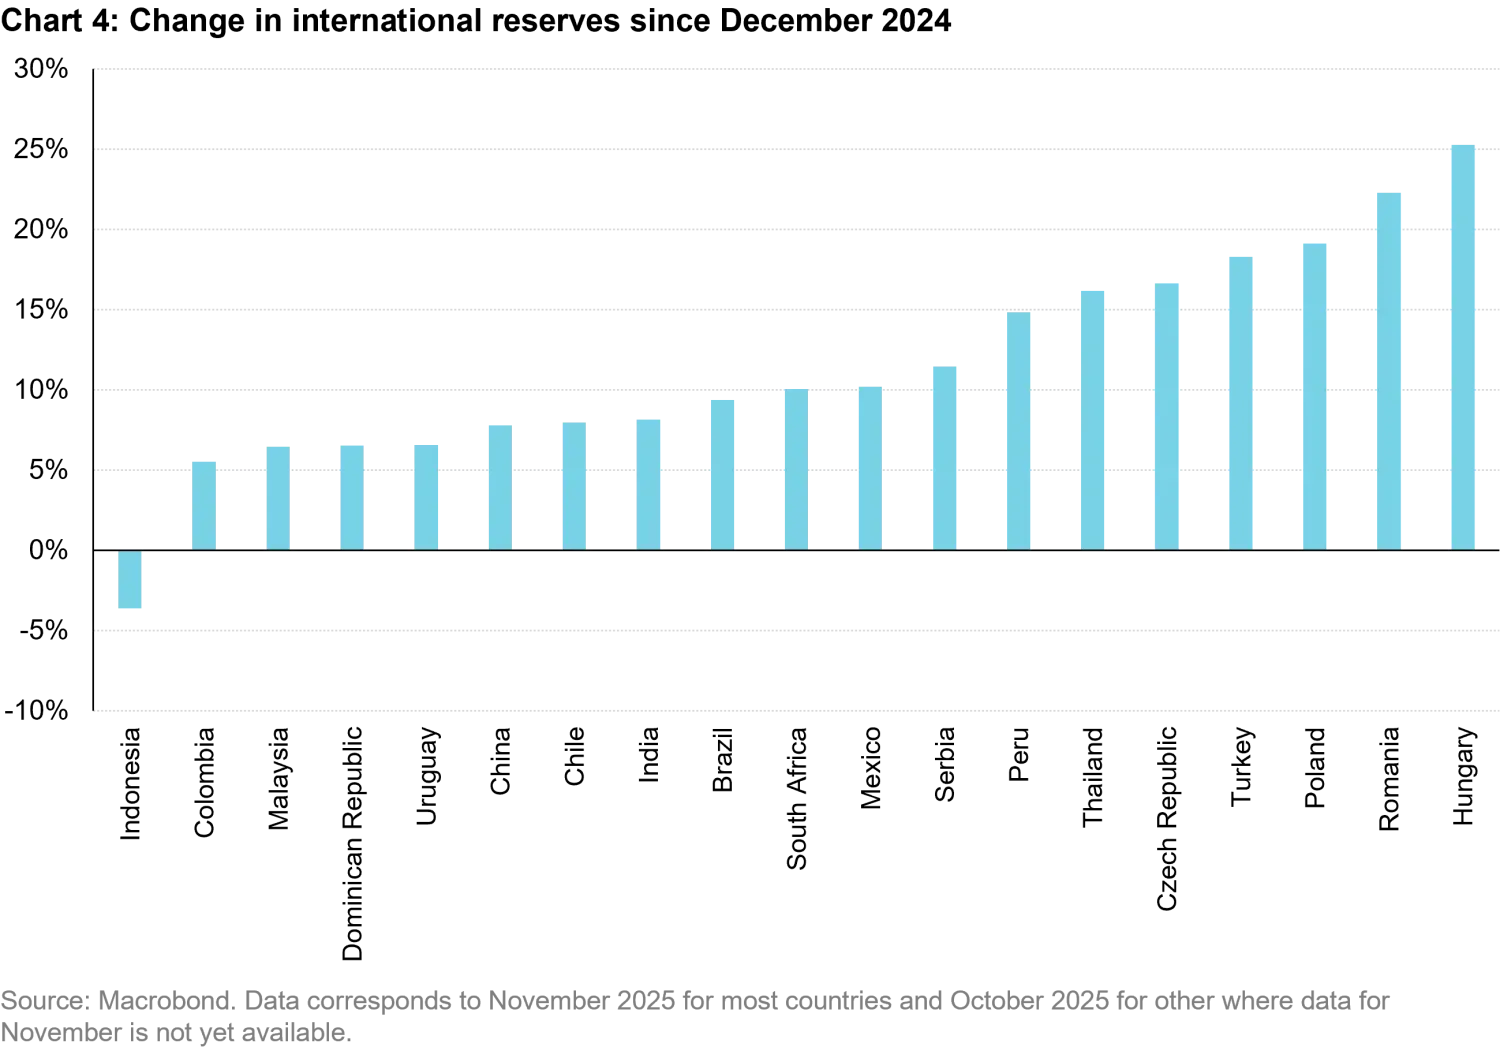
A second reason we believe EM FX can perform well even with a sideways dollar is the healthy state of external accounts in most EM countries. Over the years, the composition of the local currency index has shifted, with the aggregate now representing a net oil importer. Currently, low oil prices, combined with elevated copper prices, are creating favorable terms of trade and enabling the accumulation of FX reserves across nearly all countries in the index (with the exception of Indonesia; see Figure 2). This is positive for EM FX performance and also strengthens these countries’ ability to service external debt.
Slightly more optimistic outlook for EM local currency over EM hard currency bonds
In summary, we believe the current macroeconomic environment remains favorable for this asset class, despite our conviction in a USD bear market being lower than it was a few months ago. We anticipate total returns for the asset class to range between 6% and 12%, with returns exceeding the 5.9% yield-to-maturity (YTM), driven by a combination of EM FX returns and lower EM interest rates, which support bond price appreciation. This outlook is slightly more optimistic than our return expectations for hard currency bonds, where already tight spreads limit upside potential—unlike the current valuations in EM FX.
1. Source: Bloomberg, Vontobel.
Any projections or forward-looking statements regarding future events or the financial performance of countries, markets and/or investments are based on a variety of estimates and assumptions. There can be no assurance that the assumptions made in connection with such projections will prove accurate, and actual results may differ materially.