Emerging Markets Bonds
A high-conviction and contrarian approach, combining bottom-up and relative-value strategies.
In the world of investment, achieving a balanced and diversified portfolio is key to managing risk and maximizing returns. While many assets are commonly considered for inclusion, emerging markets local currency often remains under-allocated, despite the huge growth in the asset class itself.
This introductory article presents five reasons why you should think about giving Emerging Markets Local Currency Debt a more permanent allocation in your investment portfolio. It’s the first in a series: future articles will dig deeper into several key issues presented below, with the final post in the series offering a more pointed look at valuation in the asset class.
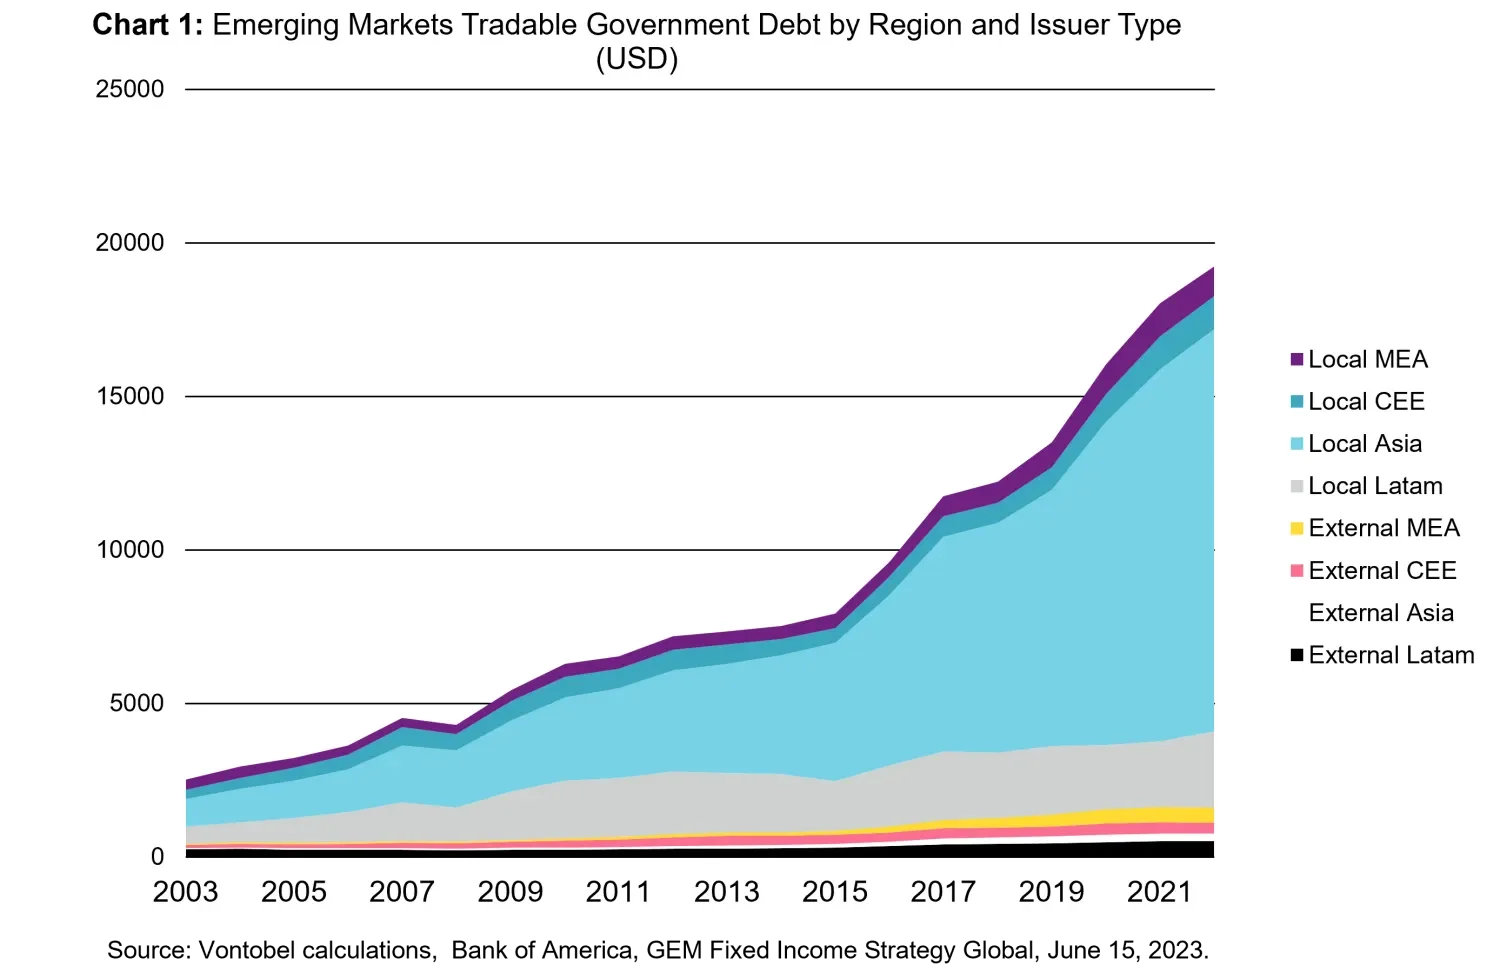
Emerging Market Local Currency Debt issuance has accelerated in the past few years, reducing convertibility risk, and dwarfing the emerging market hard currency universe in absolute size. This comes as no surprise: most countries aspire to issue solely in their own currency.
As such, we believe emerging markets local currency is the inescapable market of the future, coupling good performance with better liquidity. And while this inescapability is no guarantee for good performance from an investor point of view, it's time we pay a bit more attention.
Emerging economies have learnt from past crisis, leading to more disciplined fiscal and proactive monetary policies. Many countries adopted floating exchange rate regimes, providing flexibility against external shocks, and improving the balance of payments. This enabled better accumulation of foreign exchange reserves, which in turn affords greater monetary policy flexibility. While this isn’t the case across the board, it is the case for every country in the EM local-currency index (J.P. Morgan GBI-EM Global Diversified) with the single exception of Turkey, but even this chronically high-inflation country appears to be reversing course as of today, as evidenced by a major policy U-turn last year.
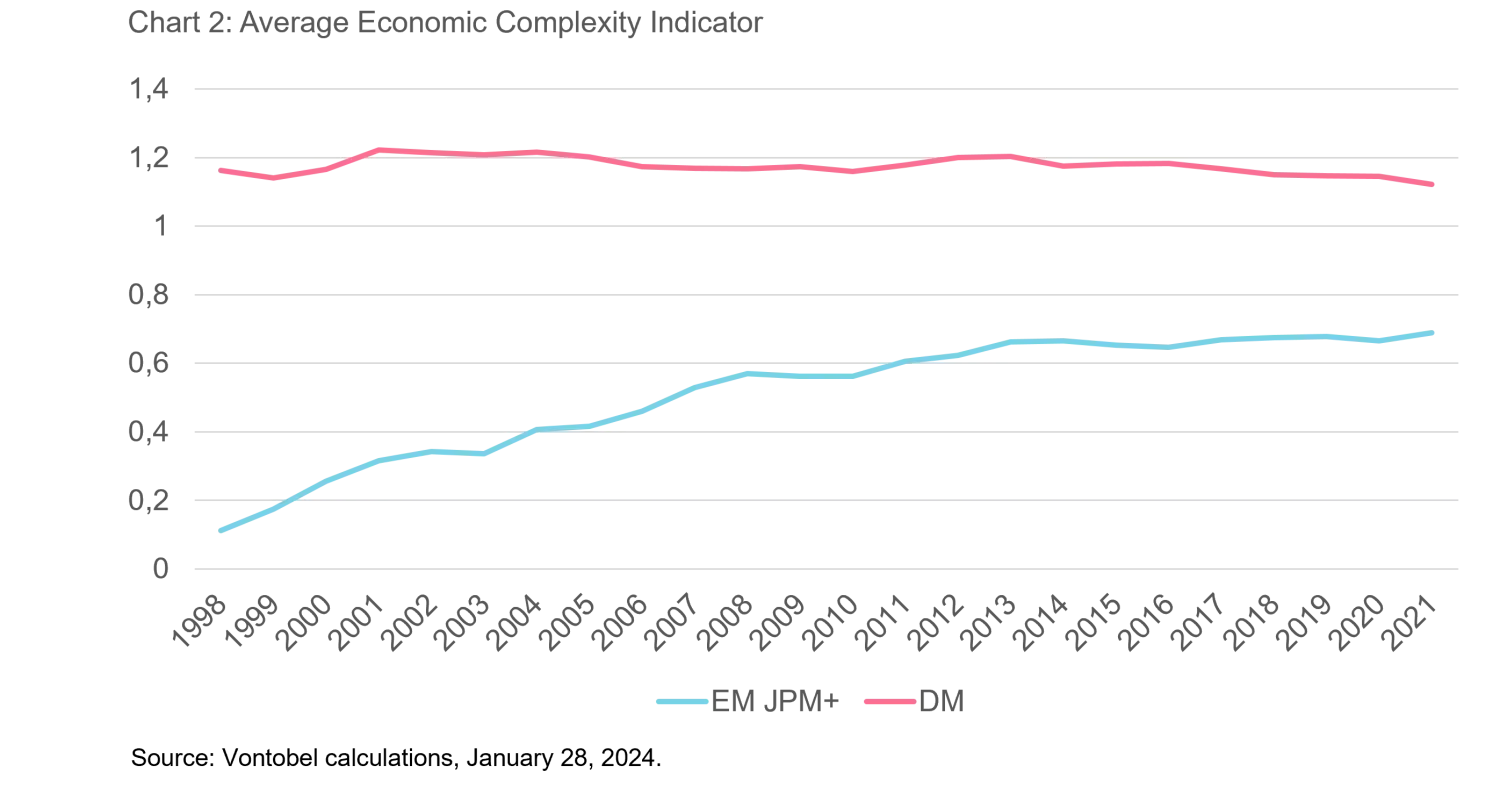
Moreover, major EM economies became increasingly robust by diversifying beyond reliance on single sectors or commodities, fostering sustainable growth through burgeoning service and technology sectors. Financial systems become fortified, and regulatory frameworks enhanced, leading to more robust banking sectors, and reduced vulnerability. The economic complexity index (ECI) illustrates how far an economy has evolved.1 The ECI Trade, the traditional ECI, is "based on the geography of trade and captures the sophistication of a country's exports”. It “estimates a country's ability to produce and export complex products that require a high level of knowledge and skills”.2 Economic complexity is strongly correlated with GDP per capita and has been shown to be a good predictor for future economic growth.
The graph below illustrates the average equally weighted evolution of the ECI-index of a large set of emerging economies vs a large set of developed markets (DM). While the pace of convergence may have slowed in past years, the direction remains consistent.
Even from a geopolitical perspective, we can identify a more robust background. At first, this may seem somewhat counter-intuitive. Initiated by the Global Financial Crisis of 2008, intensified by protectionist policies under Trump and enshrined by the emphasis on self-reliance during Covid, the overall trend seems to be a move towards less trade and a shrinking and de-risking of supply chains. Necessarily this cast doubt on the future of the Chinese export-led model, and by extension the success of subcontracting Emerging Economies.
However, while the aforementioned factors have indeed been major contributors to the deceleration of trade as a percentage of global GDP during the 2008-2020 period, the most recent trade figures indicate the highest level ever. Trade as a percentage of GDP reached a record 63 percent in 2022.3
Secondly, we believe that in the current climate, the less apparent positive outcomes of the prevailing political landscape actually outweigh the negative impacts:
a. Many emerging countries refuse taking sides in geo-political issues, which allows several countries of the so-called Global South to directly profit from frictions. For example, India paying less for its energy needs through discounted Russian oil would be a case in point.
b. Moreover, geopolitics also kickstarted the whole friend-shoring trend enabling countries like Vietnam, Indonesia, Thailand, India, Malaysia, Brazil, and Mexico to capture part of EM growth that was previously driven by China. While some may argue that this transfer of production and trade away from China happens at a slight loss in efficiency, it would however not be large, and is anyway dwarfed by the fact that the friend-shoring effect would benefit most of the local currency index while impacting negatively only China, which represents a mere 10 percent of the index.4
EMLC is all about the only truly “free lunch” we know in financial markets: diversification. This means diversification internally inside the asset class, but also externally in combination with other asset classes.
The internal diversification comes from the EMLC market being made up of almost 40 different countries across all continents. These countries not only have different economic cycles with some countries slowing whilst others are accelerating, but in addition, various countries will naturally have different fundamental economic drivers. For example, some countries are commodity exporters and tend to perform well when commodity prices are going up, whilst other countries may be commodity importers and could suffer from higher commodity prices. The broad internal diversification results in sometimes counterintuitively low volatility. An investment in EMLC is most often less volatile than an investment in US Treasuries for a non-USD based investor, a point we will explore in detail in later articles in this series.
High external diversification points to EMLC also serving as a complement to other assets over any applicable investment horizon by virtue of its decorrelation. Most portfolios will exhibit lower volatility risk metrics after including EMLC . However, in contrast to many hedges, investors don't have to pay for the reduction in portfolio risk you are targeting. You actually get paid for it, and generously.
While all of EM fixed income experienced outflows – almost USD 120 billion in the last two years5 - local currency accounted for a disproportionate amount because of years of relative underperformance vs EM hard-currency debt. Cross-over investors are nearly absent, and dedicated investors hold only a fraction of what they had back in 2013. Predicting when exactly global risk appetite turns toward local currency is notoriously difficult, but we do have two convictions. One, the positioning is so light that disproportionally large gains could be made once investors dip their toes back into EM local debt. Two, if the future looks anything like the past, flows tend to follow performance with a short lag. We believe the solid double-digit performance of EM LC on the back of a positive Q4 2023 should help turn the flows back up.
There's another more structural reason why we think the tide is turning for good in EM local currency: the demise of Quantitative Easing (QE). QE has been, for nearly a decade, a major driver behind the relative underperformance of EM LC vs EM hard currency. If we picture global QE as a big shining sun warming up all asset classes, the nearer you are to the sun, the more you feel its warmth. While developed market assets bought directly by central banks would feel the strongest heat, emerging markets hard currency – intrinsically a US dollar asset class – would be much closer to the sun than emerging market local currency.
QE in developed markets looks solidly retired for the foreseeable future. Even the laggard Bank of Japan is expected to end QE over the next six months . A different inflation background and the political repercussions of rising inequality have outweighed the at times questionable benefits of balance sheet expansion. While QE will remain part of any central bank’s toolbox, blanket liquidity expansion seems to be a thing of the past. Relatively speaking, this can only benefit EM LC.
1.
https://ourworldindata.org/how-and-why-econ-complexity
2. Vontobel calculations based on OEC Trade Data (
https://oec.world/en
). EM JPM+ group consists of the JPM GBI EM members including Israel, Singapore, and Taiwan. Equally weighted.
3.
https://data.worldbank.org/indicator/NE.TRD.GNFS.ZS
4.
https://www.jpmorgan.com/content/dam/jpm/cib/complex/content/markets/composition-docs/pdf-26.pdf
5.
https://am.vontobel.com/insights/2024-according-to-our-fixed-income-boutique
.