
A Shock to the Magnificent Seven—But Not the Market
Multi Asset Boutique
Just weeks ago, few would have predicted that a Chinese AI startup could shake the Magnificent Seven so significantly, triggering a 4% drop in just a few trading hours. But that’s exactly what happened. As our colleagues from the Conviction Equities Boutique highlighted in a recent report1, DeepSeek has emerged as a case study in cost efficiency, challenging the assumption that cutting-edge chips and vast computing power are essential for competitiveness in AI.
The sharp market correction has raised concerns—is this the start of a broader sell-off in tech? Will the broader market be affected? We don’t think so. A closer look at equity markets suggests this is more likely a correction limited to big tech rather than the beginning of a systemic downturn.
Despite the Magnificent Seven’s heavy weighting in the S&P 500, the index managed to recover its early losses on Monday, January 27. While semiconductor stocks continue to struggle, we see little sign of broader contagion across sectors.
But our constructive market view goes beyond these observations. The combination of a supportive economic backdrop—growth picking up but not overheating—and our view of continued policy easing remain the key reasons for our optimism in months ahead. Let’s dive into the economic backdrop argument first, using our business cycle analysis.
Constructive business cycle signals
Economic data improved further in January, as reflected in our business cycle model, Wave2. Take China, for example. The government’s fiscal stimulus—announced in the second half of 2024—is delivering results. Real GDP growth accelerated to 5% by year-end, consumer demand is picking up, and retail sales exceeded expectations. Even the struggling housing sector is showing early signs of stabilization.
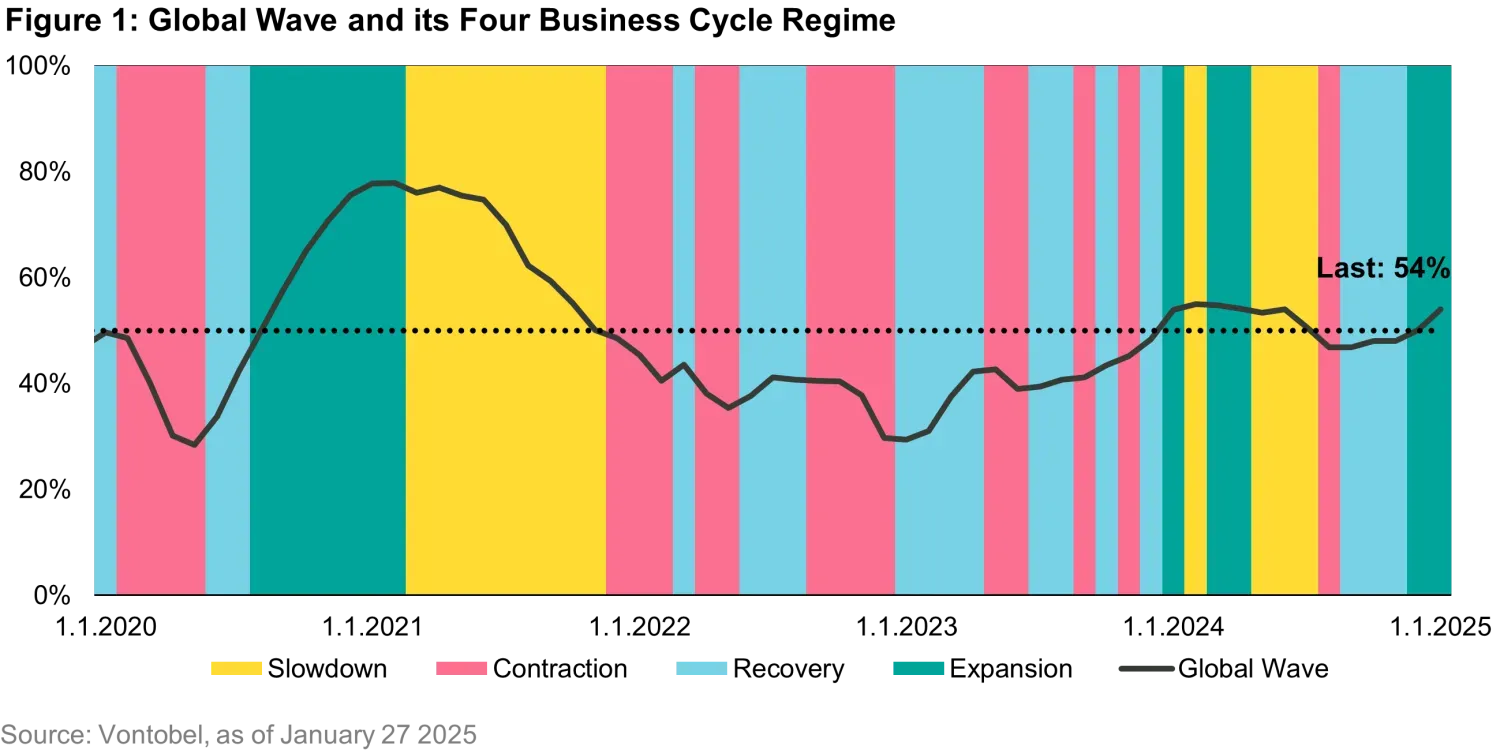
Developed markets have maintained growth momentum, supported by rising real household incomes in recent quarters3. In Europe, Wave has signaled weaker trends in recent months, but the latest flash PMIs for January suggest resilience for the months ahead.
These positive trends have triggered an expansion signal for emerging markets and confirmed the expansion signal for developed markets. As a result, our business cycle indicator continues to support a constructive market outlook in our hybrid investment process.
Hurdle for “dovish surprises” hangs lower
The outlook for financial markets will depend heavily on the Federal Reserve’s policy decisions in the months ahead. Figure 2 illustrates the Fed Surprise Index4, which takes the 12-month out Fed funds rate forecast made a year ago and subtracts the effectively realized policy rate. This indicator measures whether the Fed has over- or underdelivered relative to past market expectations.
Figure 2 shows that a long phase of “hawkish Fed surprises” lies behind us. This means that the Fed Funds rate has not been cut as much as markets had expected 12-months ago5.
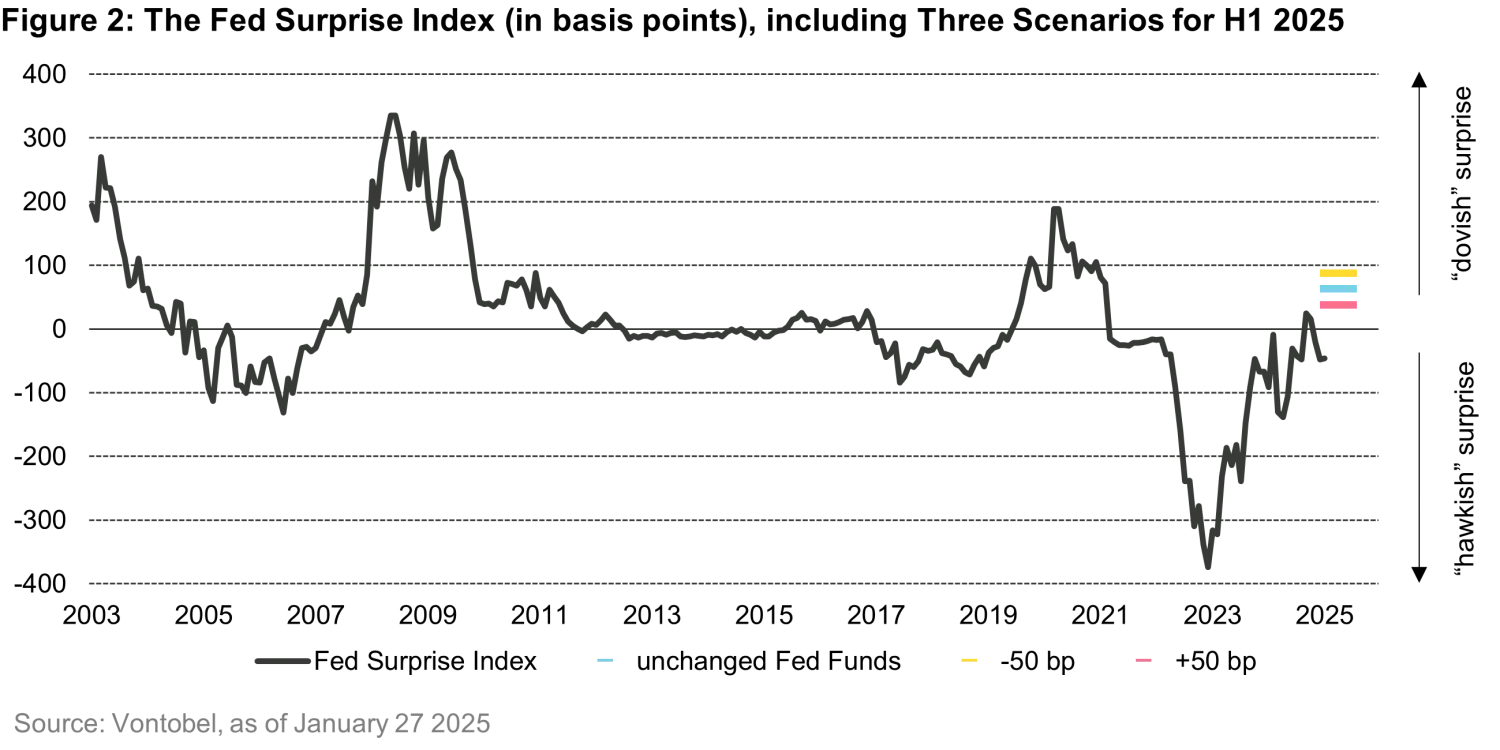
Figure 3 highlights the strong correlation between these surprises and bond market performance. “Dovish surprises” – as expected – have been associated with positive Treasury returns over the same period, while hawkish surprises have weighed on bond markets. The impact extends beyond fixed income. Dovish surprises are also positively correlated with returns in riskier asset classes, reinforcing the Fed’s influence across financial markets.
With 12-month-ahead rate forecasts for 2024 already known, the job of forecasting whether it’s worth remaining invested in risky assets is equivalent to assessing whether the Fed Surprise Index will move into “dovish surprise” territory.
We modeled three scenarios:
- The Fed keeps policy rates unchanged.
- The Fed hikes rates twice—by 25 basis points each—in Q2 and Q3 2025.
- The Fed cuts twice in the same quarters, aligning closely with our house view.
As the chart illustrates, all scenarios lead to the index entering dovish surprise territory in the coming months. However, by autumn, the index would shift back toward hawkish surprise territory in all three scenarios6.
As discussed earlier, Figure 3 tells us that these surprises are closely correlated with effective bond market returns.
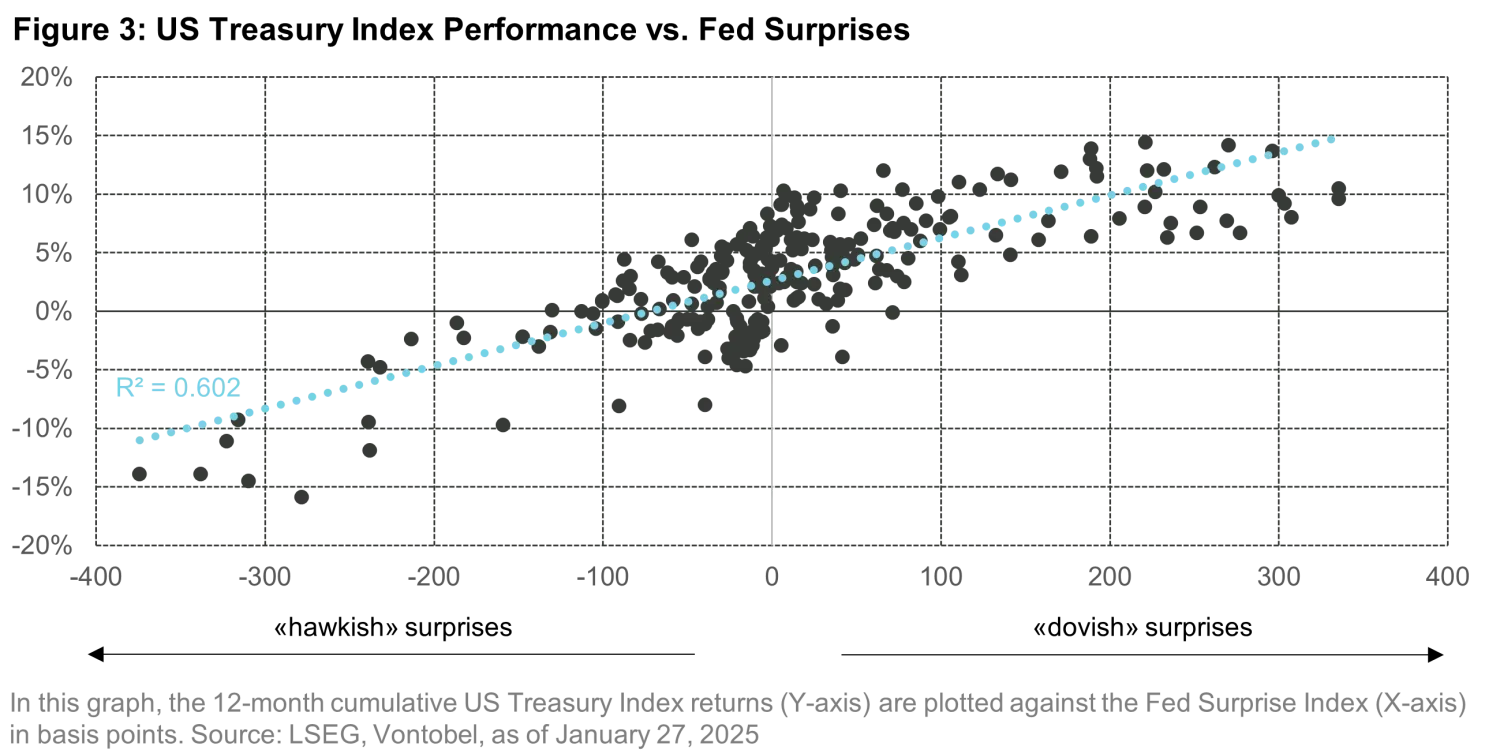
We recognize that the Fed Surprise Index scenario analysis simplifies certain factors. Elements like convexity and the term premium also play a role in predicting bond returns. However, the index still provides a solid approximation of the threshold needed to trigger a hawkish or dovish surprise. It offers a useful gauge for understanding market expectations and potential shifts in sentiment7. With the bar for dovish surprises set lower in the first half of 2025, the outlook for bond returns has improved.
We Maintain a “Risk-On” Stance
As the bar for dovish Fed surprises lowers and our business cycle indicator signals improving risk appetite, we view the recent market pullback as a positioning adjustment rather than the start of a broader downturn or tech stock re-evaluation.
The main risk to our outlook is the Fed signaling a need for policy tightening over the next 12 months. However, the January 29 Fed meeting reinforced its commitment to a measured, data-driven approach to easing. As Jay Powell put it, the Fed is “not in a hurry to adjust the policy stance.” Additionally, the Fed’s neutral rate forecast suggests that policy easing is more likely than tightening over the next two years8.
As a result, we maintain a risk-on stance with a positive outlook for equities and a preference for spread over duration in debt markets. We see opportunities in investment-grade corporate bonds and emerging markets to generate attractive excess returns. However, uncertainties around U.S. trade policy call for hedges, including the U.S. dollar, Japanese yen, gold9, and option-based tail hedging strategies.
1. See “DeepSeek’s strong new AI model – AI’s Sputnik moment?”
2. For further details on our business cycle model wave we refer to “The Vontobel Wave – a superior business cycle model”
3. Wage growth in developed markets has remained relatively stable, while falling inflation has boosted real wages.
4. This indicator has been shown first by BCA. See for example “The Golden Rule of Bond Investing”
5. For example, on January 24, 2024, overnight indexed markets were pricing a Fed Funds rate of 4.1% for January 2025. A Fed Funds rate of 4.5% by January 24, 2025, translates to a Fed Funds Surprise Index of approximately -40 basis points.
6. The latter (not shown in the chart) is due to the extreme easing expectations in autumn 2024, which are difficult to beat on the dovish side once we approach autumn 2025.
7. It can be shown that when market participants bet against the Fed, the relationship between the Fed Funds Rate and U.S. Treasury returns weakens. This suggests that if rate expectations rise aggressively from here, Treasury returns are more likely to turn negative, even amid current dovish surprise index.
8. See the “FOMC statement” and “Summary of Economic Projections” for further details.
9. See our recent Quanta Byte “Renewed macro support for Gold”.
About the author

Related funds
About the author
Explore related topics:
Up next:
Towers and the Starlink ThreatRelated insights

Towers and the Starlink Threat

Quarterly Commodity Outlook - Halftime Whistle: Fundamentals Take the Field

Investors’ Outlook: And now for something completely different

Investors’ Outlook: Adjusting the focus

Investors’ Outlook: Strait forward
