
Min Vol During High Vol
Multi Asset Boutique
In our year-end Quanta Byte Humble New Year Resolutions, we highlighted min vol as a key theme—and the first few months have delivered. While equity and bond market swings have eased somewhat in the aftermath of Donald Trump’s tariff announcement on April 2nd, the landscape remains fragile. Moody’s downgrade of the U.S. credit rating from AAA to AA1 is a clear reminder: the path to higher equity markets will remain uneven.
A good moment, in our view, to re-iterate our conviction into one of our preferred strategies for 2025—Minimum Volatility1. In the following sections, we first outline the most likely macro scenario going forward. We do so by using our proprietary business cycle model Wave. We then assess which equity factors we expect to do well in the current phase. Our analysis is focused on developed market equities.
Wave is in Slowdown
Emerging markets remain in expansion, while developed markets show signs of a slowdown2 (Figure 1). The U.S. tariff announcement in early April triggered a sharp market reaction and prompted major banks to cut their growth forecasts.
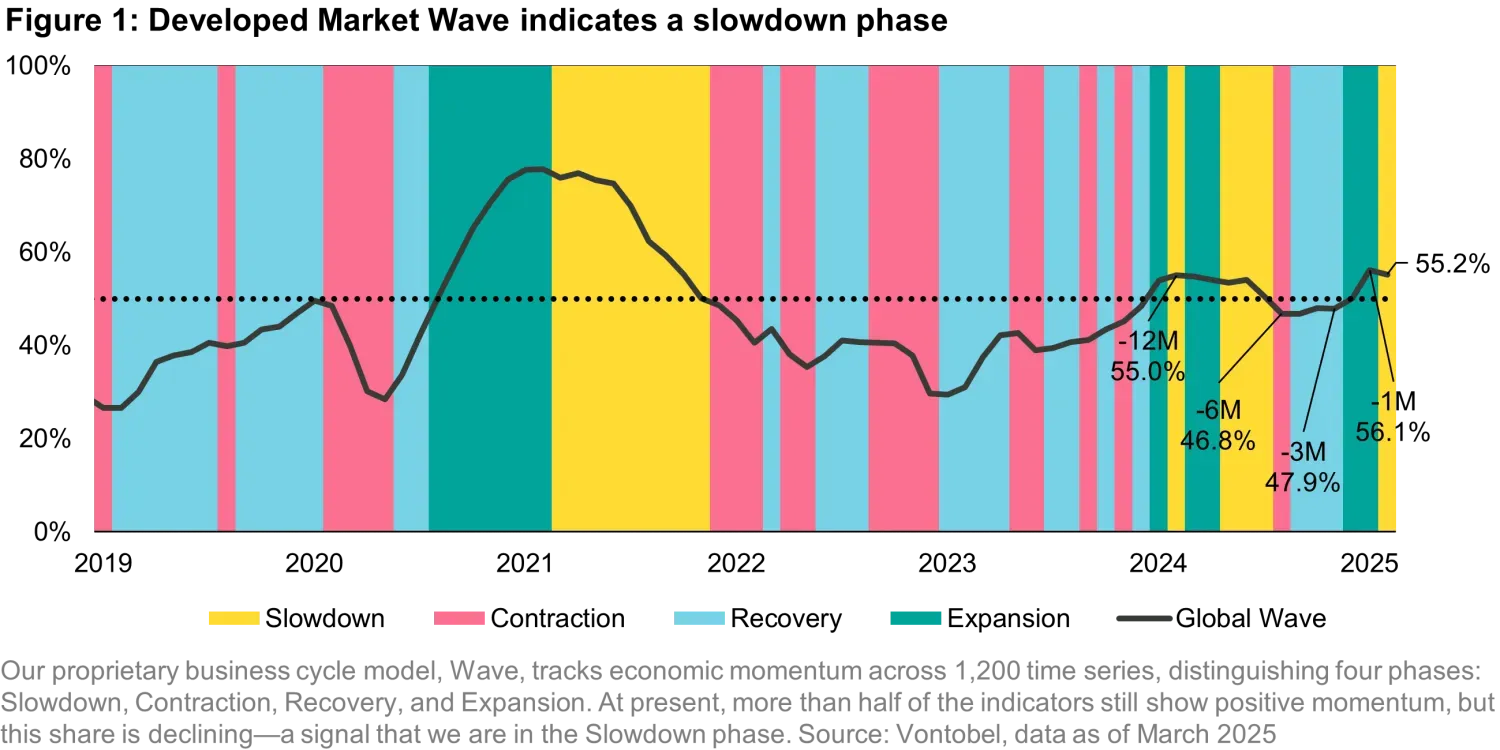
Markets stabilized after the U.S. announced a 90-day suspension of tariffs beyond the basic 10%. Bilateral deals—such as with China—lifted growth forecasts. Still, the effective U.S. tariff rate remains about 10 percentage points above early-year levels—a clear headwind for both trading partners and the U.S. economy.
With the Wave base case pointing to a continued slowdown, we focus on which equity factors tend to perform in the regime we’re in, and in the one where we’ll be. But first, let’s briefly review key findings from academic research on equity factors.
Few factors matter
Since the 1980s, academics have introduced hundreds of equity factors. Yet only a few have consistently proven effective through rigorous testing. Our analysis focuses on the most reliable: Value, Quality, Momentum, Minimum Volatility, High Dividend and Growth. These factors have shown resilience over time and remain central to many successful investment strategies today.
While factor research has a long history, the study of how factor performance evolves over time is relatively new. The central question: Does the state of the economy influence how factors perform? Most research relies on traditional business cycle indicators, such as the OECD leading indicator or Purchasing Managers’ Indices (PMIs). Recent work by Kwon (2022)3 and others shows that adjusting factor allocation based on economic regimes can outperform static strategies. Polk et al. (2020)4, for instance, use the OECD indicator to define regimes. Their findings: Quality and Minimum Volatility tend to outperform both the equity market and other factors during a slowdown.
These empirical findings motivate our factor analysis. Given that Wave has a proven track record of anticipating adverse market regimes—such as contraction—earlier than traditional business cycle models5, we will base our factor analysis on our proprietary model. For comparability, we use MSCI’s factor definitions as the foundation for our analysis.
The value of min vol
Our business cycle analysis measures how developed market equity factor strategies perform versus their benchmark6, depending on the cycle state7. Figure 2 shows relative out- or underperformance by factor, cycle state, and across the full cycle.
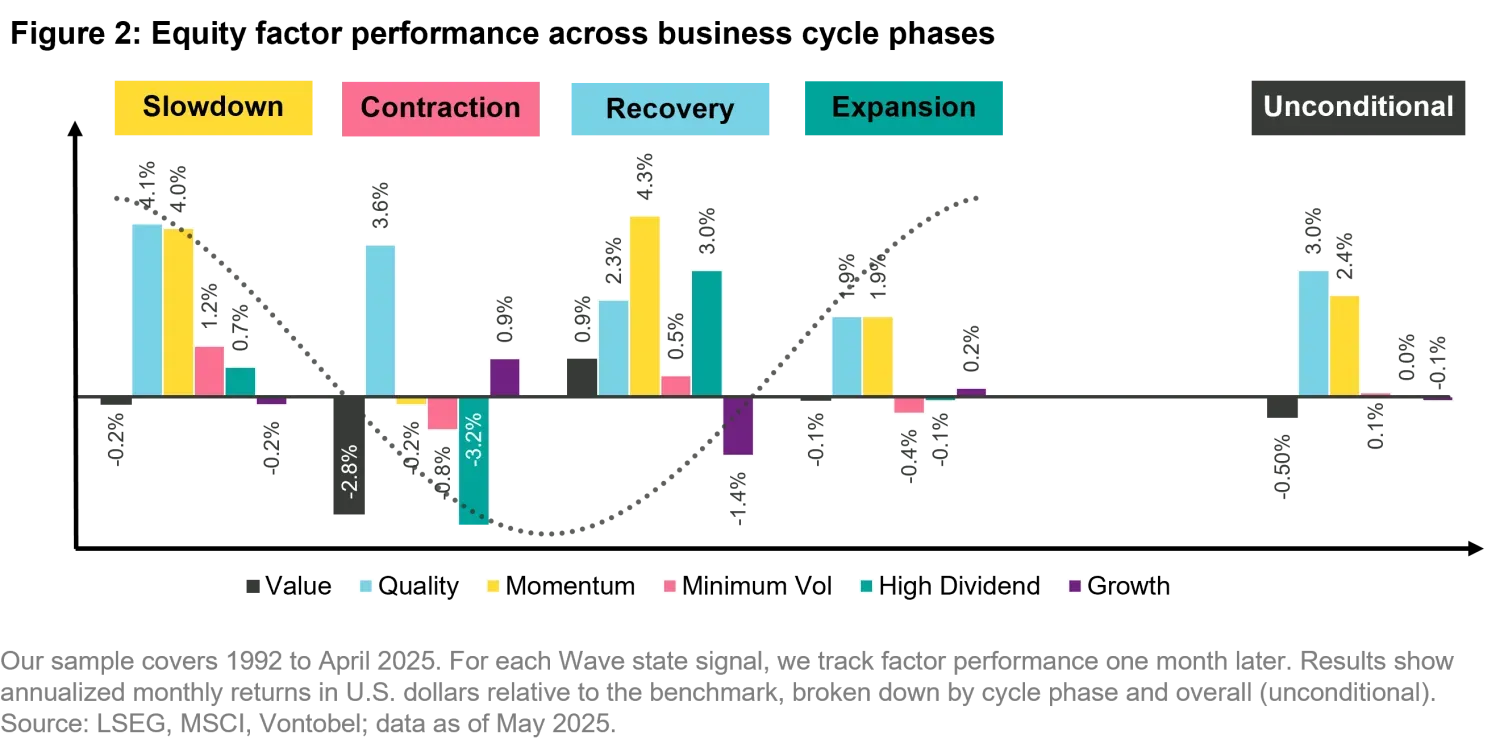
We start with unconditional performance—the average out- or underperformance of each factor since 1995. Our analysis highlights three clear winners: Quality (+3%) and Momentum (+2.4%). Minimum Volatility and Dividend strategies matched the benchmark, while Value and Growth slightly underperformed. Quality and Momentum are the only factors with double-digit returns—11.6% and 10.6%, clearly beating the MSCI World’s 8.6%.
Breaking down performance by cycle phase reveals clear patterns. First, Quality consistently outperforms the benchmark in every phase. Momentum lags slightly—only during contractions. Second, in slowdowns, Quality, Momentum, Minimum Volatility and High Dividend strategies tend to outperform. Third, Value and High Dividend underperform in contractions. But High Dividend rebounds strongly during the recovery phase.
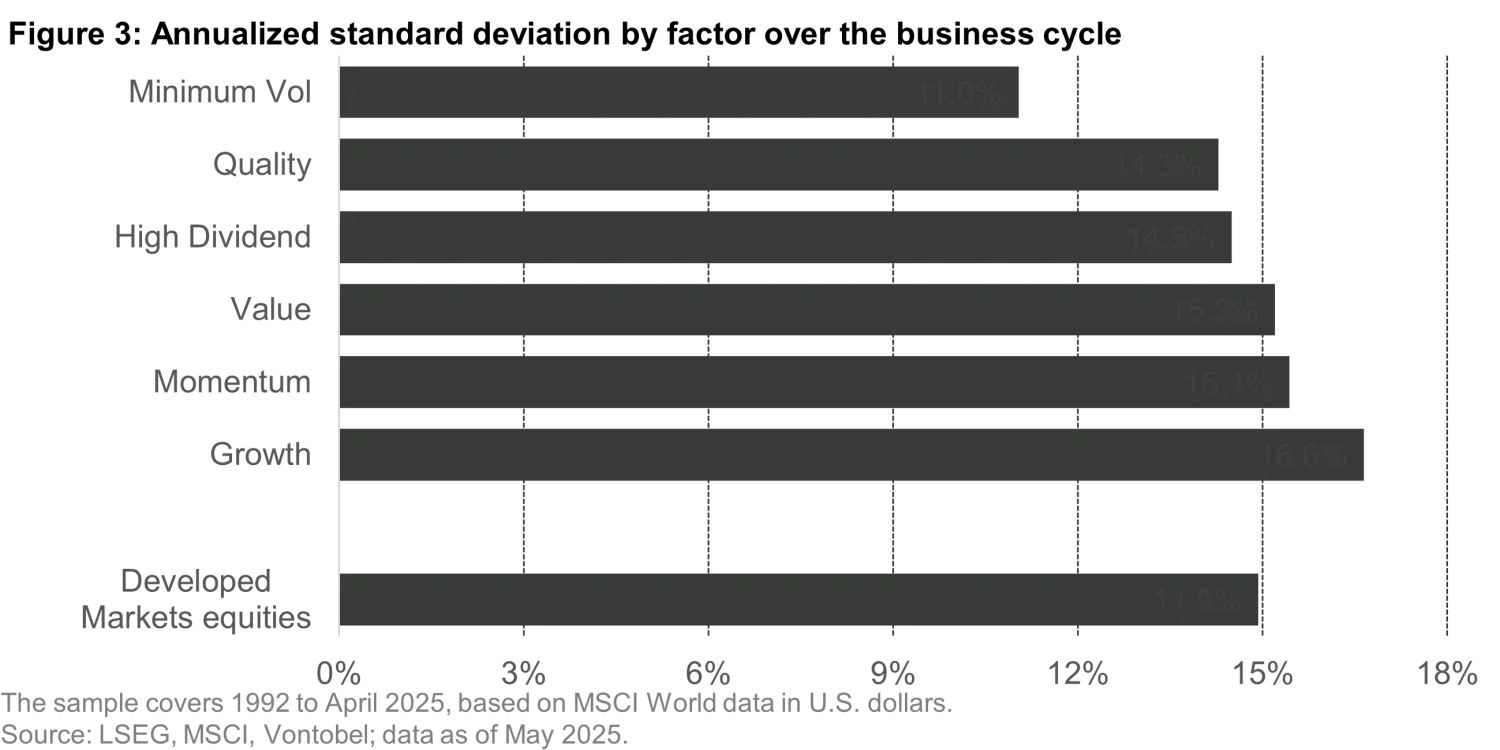
At first glance, the data might suggest doubling down on Quality and Momentum. But that would miss the point of Minimum Volatility. Its strength lies not in outperforming during bull markets, but in offering steadier returns through uncertainty. As Figure 3 shows, Minimum Volatility stands out for its lower risk and more resilient performance.
Min Vol has kept his word in 2025
Our business cycle model, Wave, signals a slowdown, making minimum volatility strategies attractive—even for risk-tolerant investors. Figure 2 shows minimum volatility outperformed the MSCI World during slowdowns. Though quality and momentum delivered higher returns, minimum volatility’s lower volatility and better risk-adjusted metrics motivate our preference.
As Figure 3 shows, the annualized standard deviation for min vol stocks is 11%, compared to 14%-17% for other strategies, including the benchmark. These results suggest that certain strategies cater to different investor profiles, with min vol being particularly attractive for risk-averse investors. This is especially true as some portfolio hedges, such as long-duration bonds, have failed to protect portfolios this year amid tariff announcements and Europe's shift away from fiscal austerity, which has triggered higher inflation expectations and rising yields.
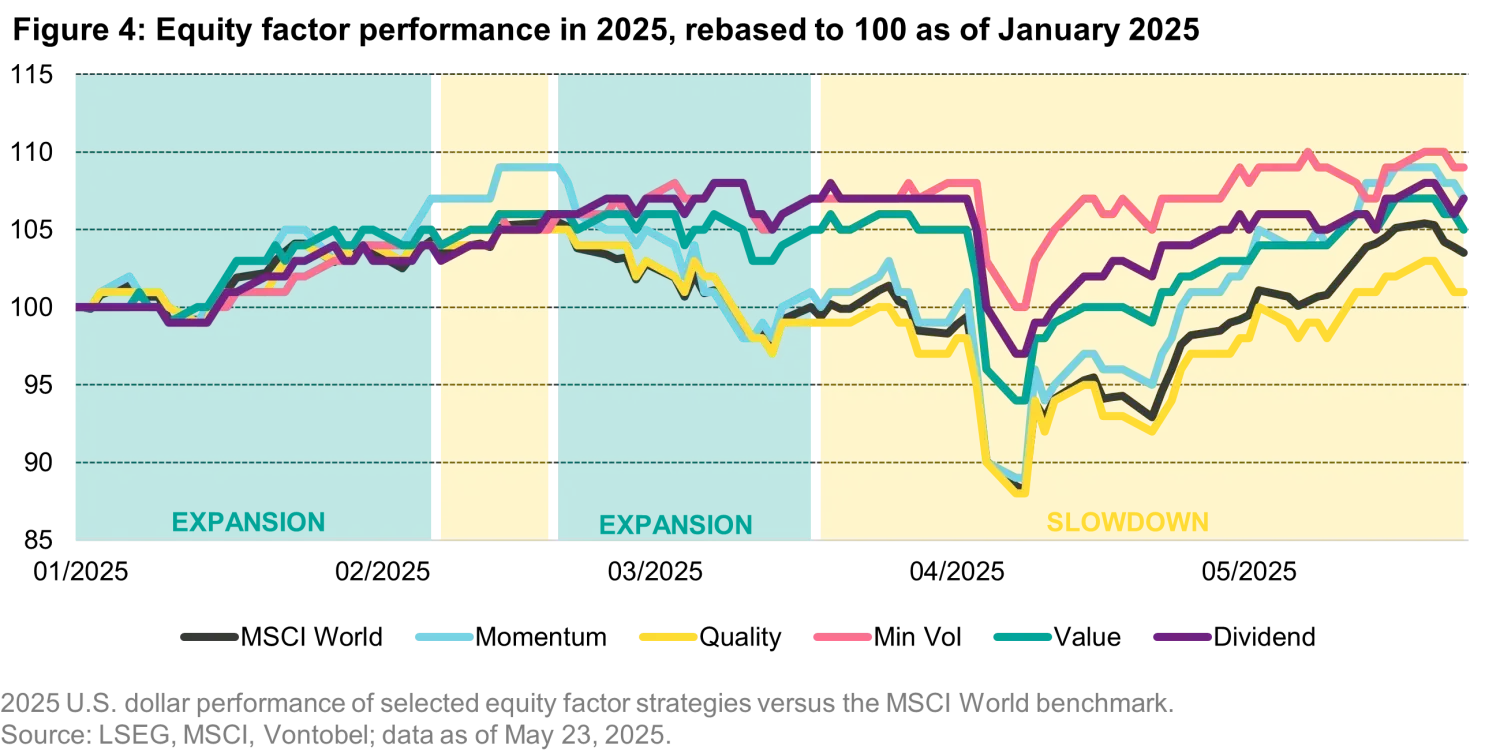
Minimum Volatility isn’t just about managing risk—it has also outperformed the benchmark and other factors year-to-date. As Figure 4 shows, these strategies have outperformed so far in 2025. The trend began with the U.S. tariff announcement in early April—and since then, minimum volatility has continued to lead other strategies. With U.S.–European tariff negotiations in focus, investors watch market risks closely. Minimum volatility may continue to outperform in the weeks ahead.
How we navigate?
Market volatility has eased, but uncertainty remains high8. The U.S. tariffs confirmed so far imply an average import duty 10 to 12 percentage points above where it stood at the start of the year. This is a historic increase, taking tariff levels back to those last seen in the 1920s—and is likely to show up in economic data over the coming months.
Geopolitical risks add another layer of unpredictability. Regarding the war in Ukraine possible outcomes range from escalating tensions to a longer-lasting ceasefire or peace. For investors, this means staying alert to sudden shifts in sentiment.
In this environment, we believe Minimum Volatility strategies will remain a valuable tool to navigate potential market turbulence9. Even the rise in U.S. Treasury yields left few clear safe havens. Two of our preferred hedges—the Japanese yen10 and gold11—have performed solidly in recent weeks. We expect them to continue offering protection, especially if weaker economic data starts coming in. Much will then depend on the Fed’s reaction12. In its May policy statement, the Fed signaled it is in no rush to ease, as the full inflationary and economic impact of tariffs remains uncertain.
Two unknowns—the economic data and the Fed’s response—could weigh on markets, especially if the U.S. and global economy weaken and policy support falls short. In this environment, we have recently adopted a more neutral stance on riskier assets such as equities—while maintaining our bias toward Minimum Volatility strategies. At the same time, we are reducing our long-held overweight in credit, which has become increasingly correlated with equities during the latest sell-off.13
1. In our Quanta Byte “Timing Factors with Macro Regimes” we discussed the attractiveness of Minimum Volatility Strategies in phases of an economic downturn.
2. For more on our approach to identifying turning points in the economic cycle, see “The Vontobel Wave – a superior business-cycle model.” It explains how we use leading indicators to define the four phases of the cycle—slowdown, contraction, recovery and expansion—and how this helps guide our investment decisions.
3. See Kwon, D. (2022) “Dynamic Factor Rotation Strategy: A Business Cycle Approach”, International Journal of Financial Studies, 10: 46.
4. See Polk et. al (2020) “Time-Series Variation in Factor Premia: The Influence of the Business Cycle”, Journal of Investment Management, Vol 18, No. 1.
5. We have outlined this in our white paper, “The Vontobel Wave – a superior business-cycle model”.
6. We present annualized monthly equity returns for developed markets over its benchmark, the MSCI World.
7. Our business cycle indicator identifies four distinct states: Slowdown, Contraction, Recovery, and Expansion.
8. In “Humble New Year Resolutions” we emphasized the importance of portfolio hedges for the year 2025, anticipating increased market volatility.
9. We discussed the attractive portfolio construction properties of Minimum Volatility strategies in "Timing Factors with Macro Regimes."
10. Check out “The Yen Reloaded: A Hidden Hedge?” for our take on the Yen.
11. Check out “Renewed macro support for gold” for our perspective on gold.
12. We outlined the prerequisites for a sustained market recovery in “Decoding the Market Response to U.S. Tariffs.”
13. We refer to our webpage for further information on our investment process.
This marketing document was produced by one or more companies of the Vontobel Group (collectively "Vontobel") for institutional clients. This document is for information purposes only and nothing contained in this document should constitute a solicitation, or offer, or recommendation, to buy or sell any investment instruments, to effect any transactions, or to conclude any legal act of any kind whatsoever. Although Vontobel believes that the information provided in this document is based on reliable sources, it cannot assume responsibility for the quality, correctness, timeliness or completeness of the information contained in this document. Except as permitted under applicable copyright laws, none of this information may be reproduced, adapted, uploaded to a third party, linked to, framed, performed in public, distributed or transmitted in any form by any process without the specific written consent of Vontobel. To the maximum extent permitted by law, Vontobel will not be liable in any way for any loss or damage suffered by you through use or access to this information, or Vontobel’s failure to provide this information. Our liability for negligence, breach of contract or contravention of any law as a result of our failure to provide this information or any part of it, or for any problems with this information, which cannot be lawfully excluded, is limited, at our option and to the maximum extent permitted by law, to resupplying this information or any part of it to you, or to paying for the resupply of this information or any part of it to you. Neither this document nor any copy of it may be distributed in any jurisdiction where its distribution may be restricted by law. Persons who receive this document should make themselves aware of and adhere to any such restrictions. In particular, this document must not be distributed or handed over to US persons and must not be distributed in the USA.
A propos de l'auteur

Fonds apparentés
A propos de l'auteur
Sujets :
Afficher le suivant :
Towers and the Starlink ThreatInsights apparentés

Towers and the Starlink Threat

Quarterly Commodity Outlook - Halftime Whistle: Fundamentals Take the Field

Investors’ Outlook : Et maintenant, quelque chose de totalement différent

Investors’ Outlook: Ajuster la focale

Investors’ Outlook: Sans détour
