Looking at international markets through a new lens
Quality Growth Boutique
Key takeaways
- There are many best-in-class companies headquartered outside the US. In fact, over the last decade, more than 100 non-US companies outperformed the S&P 500 Index.
- Home bias and benchmark anchoring are two widely held misconceptions that have led US investors to significantly overweight domestic stocks.
- International equities are a fertile ground for active management because the outperformance of quality stocks has been wider than in the US over the long term.
Is Apple as American as apple pie? At first glance, I would argue it is. The company was founded by Steve Jobs, an iconic American entrepreneur, and embodies quintessential American values like freedom, innovation, and individualism. However, a deeper analysis reveals that more than 60% of Apple’s revenues come from overseas and most of its products are manufactured in Asia. If Apple’s leadership team decides to move its headquarters to another country, will this impact the quality of its products, the moat of its business, or its market value? I doubt it.
We live in a globalized economy, yet when it comes to investing, most US investors have a clear preference for domestic over international strategies (Figure 1). Over the last decade, more than 100 international companies outperformed the S&P 500 Index. A US investor’s decision to underweight international stocks may have been a detractor from overall portfolio performance. So why do investors still make this distinction?

Clearly it is not due to lack of opportunities. There are wonderful companies outside the US that are best in class in what they do. In the luxury space, several come to mind: LVMH, Hermes, Brunello Cucinelli, among others. In consumers staples: Nestle, L’Oréal, and Diageo. In technology: Taiwan Semiconductor, Keyence, Tata Consulting, and the list goes on.
Our minds are a categorization machine. We process enormous amount of data to help us make sense of the world. In the Harvard Business Review article “The Dangers of Categorical Thinking” , Professors Bart de Langhe and Philip Fernbach explain that for categorization to have value, two things must be true: First, the categories need to make sense, like differentiating between sticks and snakes. And second, it needs to be useful – differentiating sticks from snakes helps us survive a walk in the woods.
But when a categorization is not valuable, it can lead to bad decision making. Compression is a type of categorization that happens when we oversimplify the multitude of variations that exist in a category. In financial markets, compression occurs when investors separate assets according to attributes such as geography, company size, and industry. While this is helpful in differentiating across investment opportunities, it may lead investors to allocate capital inefficiently. During the Internet bubble in the late 1990’s, financial markets gave a higher valuation to companies with a dot-com name. Recently, the same phenomenon repeated with the bitcoin craze.
I believe that to a certain degree, categorization plays a role in US investors’ decision to overweight US stocks relative to international because of two widely held misconceptions: home bias and benchmark anchoring.
1. Home bias
Investors tend to prefer what they understand and feel comfortable with. While this is a worldwide phenomenon, for US investors in particular, it is a convincing yet misleading idea. The US economy, despite all its problems, is still the strongest and most dynamic in the world. It grew from a roughly similar size to the European economy in 2008 to roughly one-third bigger today.
The US equity market is home to the largest number of leading companies in their respective global industries – Amazon, Microsoft, Visa, among others. The seven largest tech firms in the world, by market capitalization, are all American. And the US also appears safer from a geopolitical risk perspective. It is not only a military superpower, but it has no enemies on both sides of its borders, and it is separated from Europe and Asia by two large oceans.
While this all looks well and good, let’s not forget that US companies are important participants in the world economy. In the two main US indexes, the S&P 500 and the Nasdaq, international markets account for 40% and 50% of the total revenues respectively. Every US investor in a passive US index fund, like it or not, is also an international investor.
Bernard Arnault, the controlling shareholder of LVMH, a Frenchman, and one of the wealthiest persons in the world with a fortune estimated at $230 billion, did not accumulate his wealth with a home bias approach. Since his early years, Mr Arnault invested with a single-minded focus to acquire and control the best luxury global brands. This was the case with Mr. Arnault’s initial investment in LVMH in 1987, in the Italian jewelry brand Bulgari in 2011, and more recently in Tiffany & Co, the classic American jeweler. LVMH handily outperformed the S&P 500 by almost 5x in the last 20 years.
Sir John Templeton, a legendary investor, and one of the pioneers of global investing remarked: “…If you search just in Canada, you will find some, or if you search just in the United States, you will find some. But why not search everywhere? That’s what we’ve been doing for forty years; we search anywhere in the world.” Mr. Templeton began investing in Japan in the 1950’s, when the Japanese market was trading at a P/E of 4x compared to the US, which was trading at a P/E of 19.5x. This was the beginning of the exceptional growth in the Japanese economy, which lasted for 30 years.
2. Benchmark anchoring
The long-term outperformance of the US vs. international markets is undisputable, and it gives US investors a strong reason to over allocate capital to US equity markets. I believe there are structural reasons behind the relative outperformance, and I expect the gap to persist over the cycle.
The US equity market is overweight higher quality, faster growth sectors like information technology and health care (Figure 2). Over the long-term, stock prices follow earnings growth, and during the last 20 years, the total return (dividend yield + earnings growth) of the S&P 500 was 10% compared to 7% for the MSCI EAFE.

That said, if we dig deeper into the data, it becomes apparent that the underperformance of international equities was not equal across the board. In fact, the top 100 best performing stocks in the MSCI EAFE outperformed the S&P 500 by 400 bps, on average (Figure 3).

International markets are a fertile ground for active management. The gap in performance between the top quartile stocks in the international benchmark is wider than in the US (see Figure 4). Although, like in the US, a large number of international managers underperformed their benchmarks, the percentage of managers who outperformed their benchmarks in international is larger than in US strategies, (60% vs. 15% according to eVestment). I believe this is because international markets are less efficient.
Successful investing in international stocks requires going the extra mile. Some of the best opportunities in international markets are not necessarily household names for US investors.
Constellation Software, for example, may be the largest software company you never heard of. With revenues of $8 billion and a market capitalization of $40 billion, Constellation is the holding company of hundreds of Vertical Market Software (VMS) companies. VMS are critical mission software in niche applications like Jonas Fitness, billing management for fitness centers; CityView, management of permits & inspections for municipalities or Softlink Education, library management for schools, among many others.
And while you may not be familiar with Ashtead, a UK-based company, you probably have seen their green forklifts and earth moving machines across construction sites under the Sunbelt brand, the second largest equipment rental company in the US after United Rentals.

Contrary to general perception, exposure to international strategies is not just a way to get exposure to economies of other countries. This is the least important and less interesting aspect of international investing. In fact, in the Vontobel International strategy, the US is a larger exposure in terms of revenues (~35%). Not because of a top-down call on the US economy, but rather as the result of a careful process of stock selection. For some companies like Ashtead (rental equipment) and Flutter (online sports gaming), the US is their largest market in terms of revenues and growth opportunity.
Investing in international stocks allows US investors to expand their opportunity set, diversify risks, and ultimately aims to improve the quality and returns of their portfolio. The Vontobel International Equity strategy’s track record began in 1994 and is one of the longest in the industry. We seek to consistently beat the benchmark. Our approach is based on the simple idea of owning the best global companies that are domiciled outside the United States. We focus on companies that have predictable business models and competitive advantages, such as higher margins and faster earnings growth than most companies in the market.
Steve Jobs once said, “Don’t be trapped by dogma – which is living with the results of other people’s thinking.” Great investors, like Mr. Arnault and Sir John Templeton did not follow the crowd, they allocated capital to the best investment opportunities, wherever they found them.
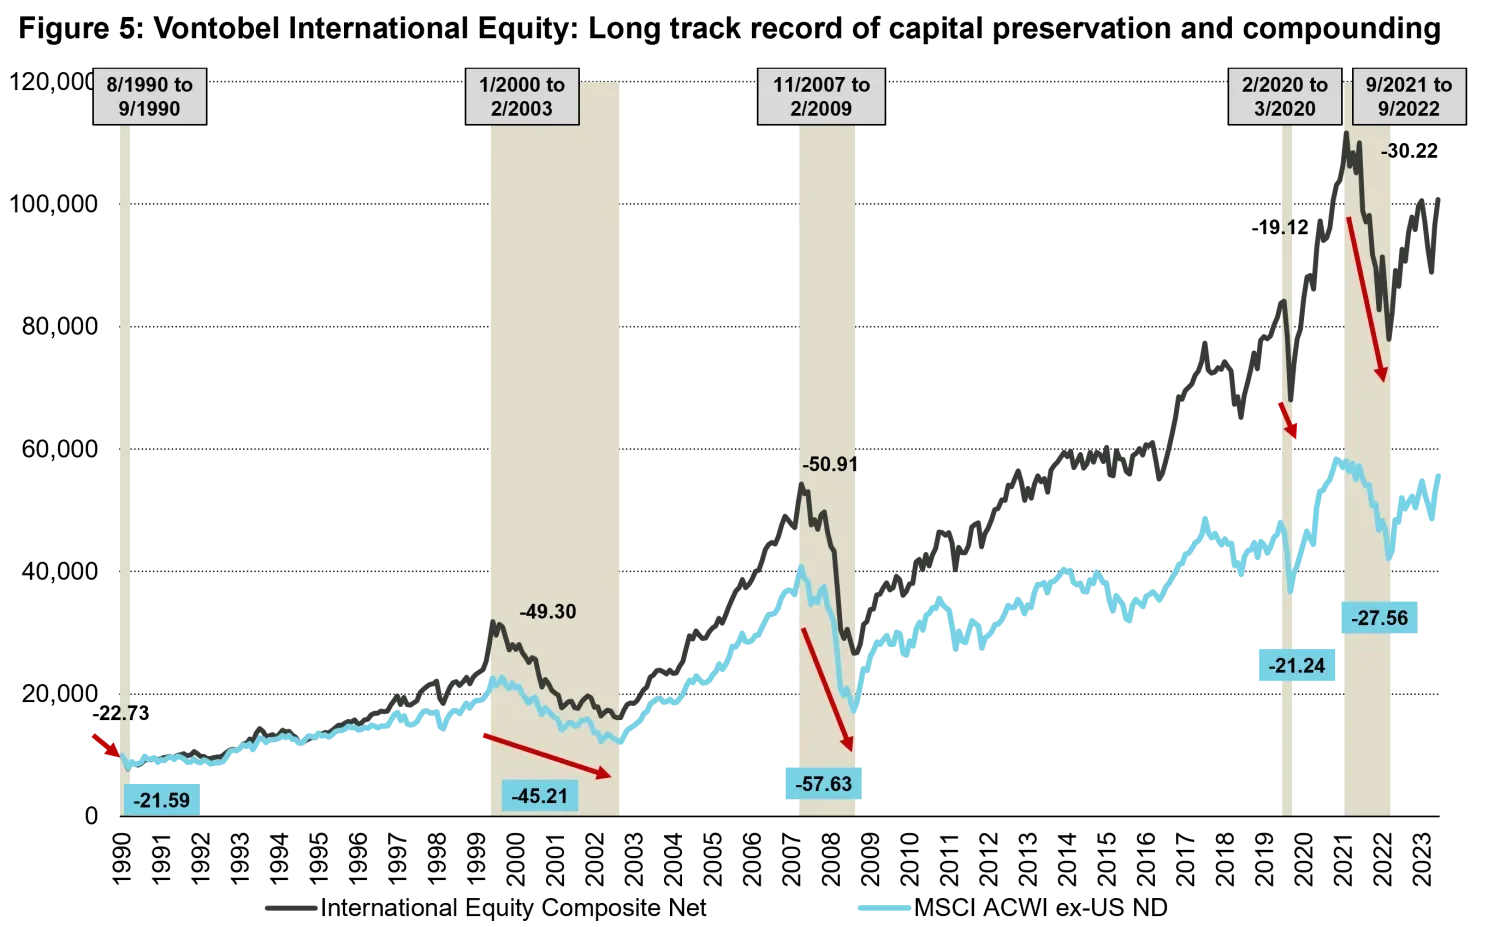
Past performance is not indicative of future results. Information is supplemental to the Composite’s GIPS Report and this along with the strategy’s standardized performance periods available at Vontobel International Equity - performance. Based on the Vontobel International Equity Composite . The graph represents the cumulative growth of $10,000. Results portrayed reflect the reinvestment of dividends and other earnings. The arrows represent the 5 most significant draw down periods. Maximum Drawdown (MDD): A maximum drawdown measures the loss in any losing period during a portfolio’s investment record. The maximum drawdown encompasses both the period from the portfolio’s peak to the portfolio’s valley (length), and the time from the portfolio’s valley to a new portfolio high (recovery). It measures the largest percentage drawdown that has occurred in any portfolio’s data record and is an indicator of downside risk over a specified time period. Source: FactSet as of December 31, 2023.
Important Information:
Past performance is not a reliable indicator of current or future performance. There is no guarantee investment objectives will be achieved and all investing involves risk, including possible loss of principal. No representation is given that any securities, products, or services discussed herein are suitable for any particular investor.
Companies discussed herein for illustrative purposes only and were selected without regard to whether such securities, were profitable and intended solely to help illustrate the subject matter under discussion. Investments discussed are not a reliable indicator of the performance or investment profile of any composite or client account. Information provided should not be considered as a recommendation to purchase, hold or sell any security nor should any assumption be made as to the profitability or performance of any security associated with them.
Any forward-looking statements and forecasts regarding future events or the financial performance of countries, markets and/or investments based on a variety of estimates and assumptions. These opinions are based on our analysis; not guaranteed; and actual results may differ materially. Further, we reserve the right to make changes and corrections to the information and opinions expressed herein at any time, without notice.
Certain companies discussed herein are holdings of the strategy’s representative portfolio and other accounts in the strategy may not have the same characteristics and allocations. The representative portfolio presented for discussion purposes only and basis for the selection is this is the account which we believe most closely reflects the strategy’s current portfolio management style. Performance was not a consideration in the selection of the representative portfolio and there is no assurance that we will make any investments with the same or similar characteristics as the representative portfolio presented.
Holdings and other portfolio characteristics are subject to change. There is no assurance that any securities discussed herein will remain in the portfolio at the time you receive this communication or that securities sold have not been repurchased. Securities discussed do not represent the entire portfolio and in the aggregate may represent only a certain percentage of the portfolio’s holdings. Diversification and/or asset allocation neither assures a profit nor eliminates the risk of investment losses. Indices are unmanaged; no fees or expenses reflected; and one cannot invest directly in an index.
About the author

David Souccar
Related strategies
About the author
David Souccar
Topics:
Related insights

Quality investing: focus on predictable and resilient growth

China Luxury: Green shoots or a structural shift?

Waiting for the “fat pitch”: Lessons from the 2026 Berkshire Hathaway Annual Meeting

Silicon is the new oil: Why the AI compute cycle still has runway

Itchy business: Galderma tackles a vexing problem in dermatology
