Just how healthy is the consumer?
TwentyFour
Consumers are being hit from seemingly all angles at the moment. Higher interest rates are coming, higher inflation is already hitting their pockets hard and economic growth is expected to slow. Given that consumption is the largest component of aggregate demand in developed economies, the ability of the consumer to cope with these shocks is absolutely crucial to the question of whether, and when, we might see a recession.
There are some fairly obvious and widely tracked gauges of the health of the consumer such as retail sales or personal consumption data, the gyrations of which are now making headlines on a regular basis. However, there are other important indicators investors can look at to investigate the strength of consumers’ balance sheets.
The first of these is the savings ratio. In recent months the prevailing view has been that consumers remain in good shape, and this argument rests to a great extent on the fact that in the wake of the COVID pandemic, large fiscal transfers and loose monetary policy (at a time when it was difficult to spend money due to lockdowns and other restrictions) translated into the highest savings rates in history. The savings ratio is calculated as households’ income minus households’ expenditures, divided by households’ income. This is ‘stock’ rather than a ‘flow’ measure; the data is non-cumulative and thus it is a snapshot of a point in time, so when the savings ratio falls it merely means people are saving less this month or this quarter than they than they did last month or quarter. However, as long as the savings ratio stays positive, people are adding to their wealth (everything else being equal). Pre-COVID, since the 1980s the average savings ratio was just over 7% in the US and close to 8.5% in the UK. If these ratios were to fall towards zero, or significantly below their long term averages for a sustained period, we could reasonably speculate that consumers are having difficulties paying their bills. The chart below shows that savings have normalised, as we would expect given fiscal transfers have also normalised since the pandemic, but the figures for the US and the UK have so far only fallen to levels pretty close to their historical averages.
Savings ratio in US and UK
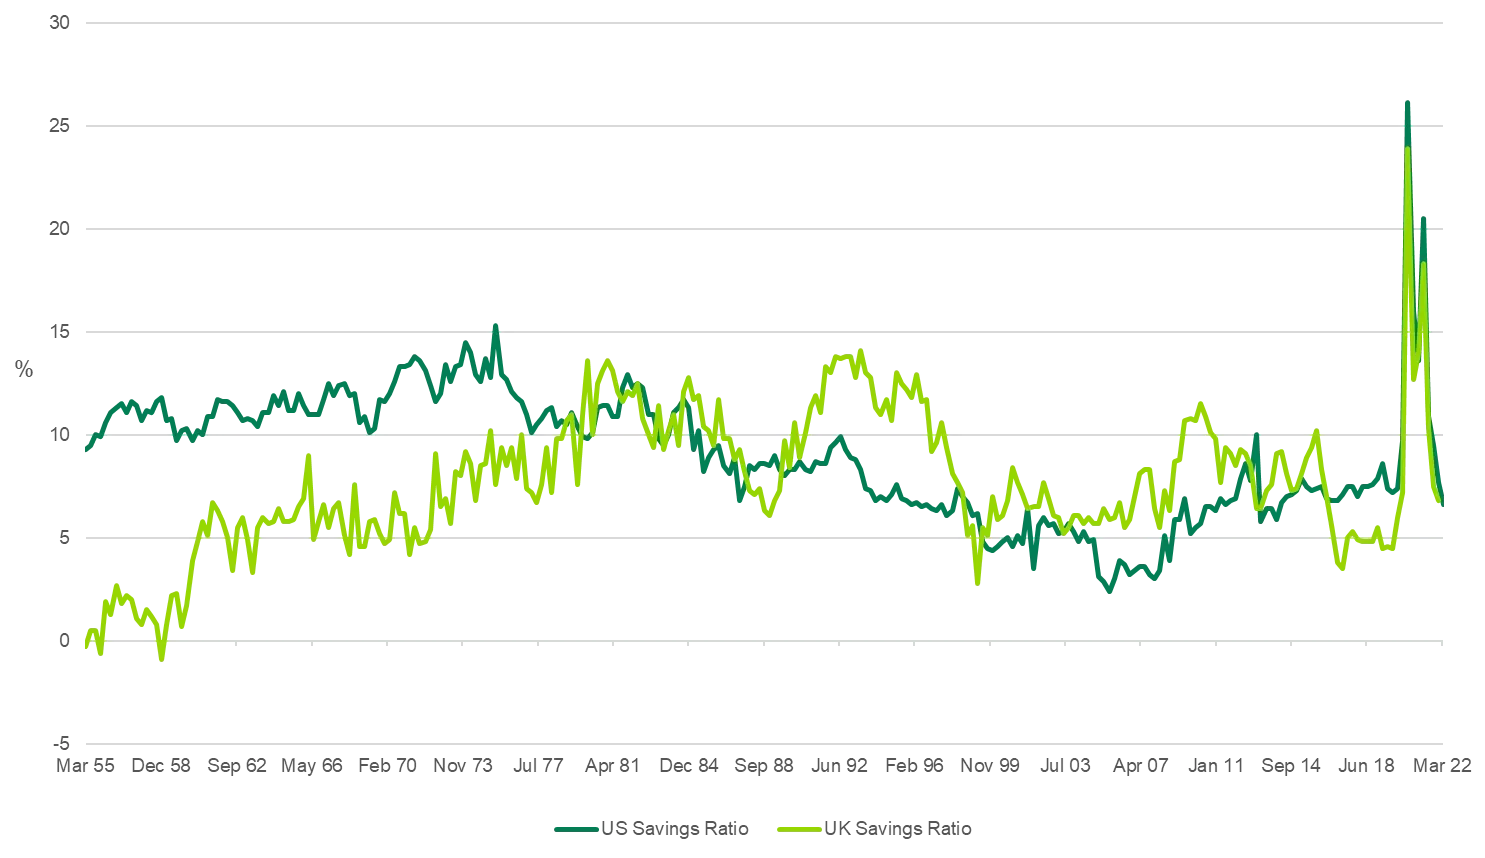
Source: Bloomberg, TwentyFour, 19 May 2022
Secondly, delinquencies in consumer loans and credit cards can also provide useful insights. Here we can take advantage of the fact that asset-backed securities (ABS) transactions issue monthly reports very promptly after the end of each month. Looking at charge-offs in credit card ABS transactions, for example, is a timely measure of consumers’ ability to stay current on their debts. Residential mortgage-backed security (RMBS) reports are also a useful indicator of pressure on mortgage payments, though arrears in this space tend to lag and be less volatile than their credit card cousins. Evidence at the moment shows that delinquencies and charge-offs have not really moved this year. In fact, UK banks have reported that over the last few quarters consumers have been paying down their credit card debt. It is hard to imagine a stretched consumer taking such an action.
Thirdly, we have to include some labour market metric. Unemployment being low is absolutely key to the capacity of consumers to stay out of trouble. Given how strong labour markets are globally – partly due to what looks like an increasingly permanent reduction in the workforce due to the pandemic – it is quite possible that we could see a marked slowdown, or even a recession, with relatively low unemployment numbers. If this is the case we very much doubt there would be a spike in non-performing loans (NPLs) on banks’ balance sheets or a significant boom in default rates in high yield bonds. A couple of good indicators in this regard are the ‘quits’ and ‘lay-offs’ ratios. The former is the number of people quitting their job as a percentage of total employment, while the latter is the number of lay-offs and discharges (i.e. initiated by the employer) as a percentage of total employment. In the US, the quits ratio is at a historic high of 3.0% and the lay-offs ratio is at a historic low of 0.9%. In other words, employees are quitting unilaterally at the highest pace on record and getting dismissed at the lowest pace on record. This cannot last forever, but a marked change in this trend could be an early indicator that consumers are suffering.
Lastly, some readers might be wondering why we haven’t yet mentioned consumer confidence data. We do of course keep a close eye on these surveys, such as the University of Michigan Consumer Sentiment Index in the US and the GfK Consumer Confidence Barometer in the UK. Lately though it does seem that these surveys are not as correlated as usual with actual expenditures. Consumers have been telling us for months via these surveys that the situation is deteriorating, and yet they have kept on spending. The surveys are at multi-year lows already, so changes in these going forward might be less informative compared to the others mentioned above.
In conclusion, we think the consumer is in fact in good shape. It is of the utmost importance that this continues to be the case, not only for the world to dodge a recession, but also for the consequences of a potential recession to be muted in terms of default rates and NPLs. Watch this space.
About the author

About the author
Topics:
Related insights

CLOs have the fundamentals to absorb recession

Even in recession, defaults will be lower than previous cycles
