Emerging markets: a delicate balance of opportunity and risk
Quality Growth Boutique
Emerging markets (EM) offer decades of potential returns for investors. Looking back and looking forward show strong economic growth gravitating towards the world’s most populous countries. A thousand years ago, the global economy was mainly dominated by China—but the industrial revolution drove wealth creation in the West—and now Asia is closing the gap again as the center of economic gravity is returning East. An illustration of how the world’s economy has developed is shown below.
Figure 1 - Evolution of World Economic Center of Gravity (AD1 to 2025e)1
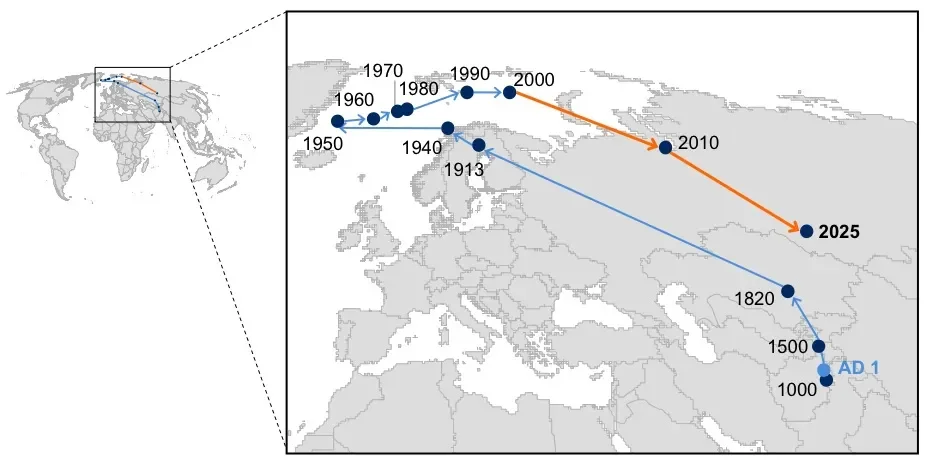
Source: McKinsey
Growth within EM is expected to create almost 150 million new middle income consumers a year over the 12 years to 2030 according to World Bank forecasts. The countries within the MSCI Emerging Market Index made up almost two-thirds (62%) of the world's population, but only just over one third (35%) of global GDP in 20172. Average incomes across EM remain many years behind the developed markets (DM) of Japan, the U.S. and the EU. New spending behavior is relatively predictable as incomes rise and should generate economic growth for many years. Importantly, there is a well-established roadmap to economic development that includes:
- Urbanization
- eCommerce and eGovernment (less corruption/theft)
- Healthcare and education availability
- Women in the workplace
- Credit available to millions for the first time, at reasonable rates
Domestic EM demand growth should not only reflect poverty reduction across the planet, but also provide fertile ground for investors. Many decades of growth potential lie ahead—in scale, as the EM populations are large. These consumers look forward to benefiting from the kind of goods and services developed market consumers take for granted, such as trustworthy and affordable health services, credit cards and mortgages, household and personal care products, education, and entertainment. Companies that can consistently deliver the goods and services to increasingly wealthy and demanding EM consumers stand to profit.
China and India: Among the World’s Fastest Growing Major Economies
China is the world’s 2nd largest economy; its GDP is projected to grow by 6.5%2 in 2018, representing roughly 1/3 of total global expansion.
India is currently creating nearly 1 million jobs per month (informal and formal combined)
Faster Growth Is Often Less Predictable
Swings in EM equity markets can be much greater than in DM markets over short periods. A core risk for EM investors is losing comfort with fundamental value and selling during market corrections, which halts any benefit from the underlying trajectory— and leaves a bitter taste. It is important to remember that emerging markets are just that—emerging. As less mature economic systems, they are generally more susceptible to shocks than developed markets. Like a family with fewer savings for a rainy day, when the economic climate turns bad, things can turn down quickly.
EM countries generally require foreign investment to supplement domestic savings as they build out infrastructure. As a result, economic activity is often sensitive to foreign investment and external factors, such as U.S. interest rates. Add to that operating and financial leverage at the company level and unpredictable valuation multiples, and risk perception can magnify. Figure 3 shows the rolling 12-month performance over the past 25 years of both the MSCI Emerging Markets Index and the MSCI World (DM), and illustrates the greater number of large market swings seen by EM investors over this period.
Figure 2 – Cumulative Performance of MSCI EM vs MSCI World (DM)
Growth of $10,000
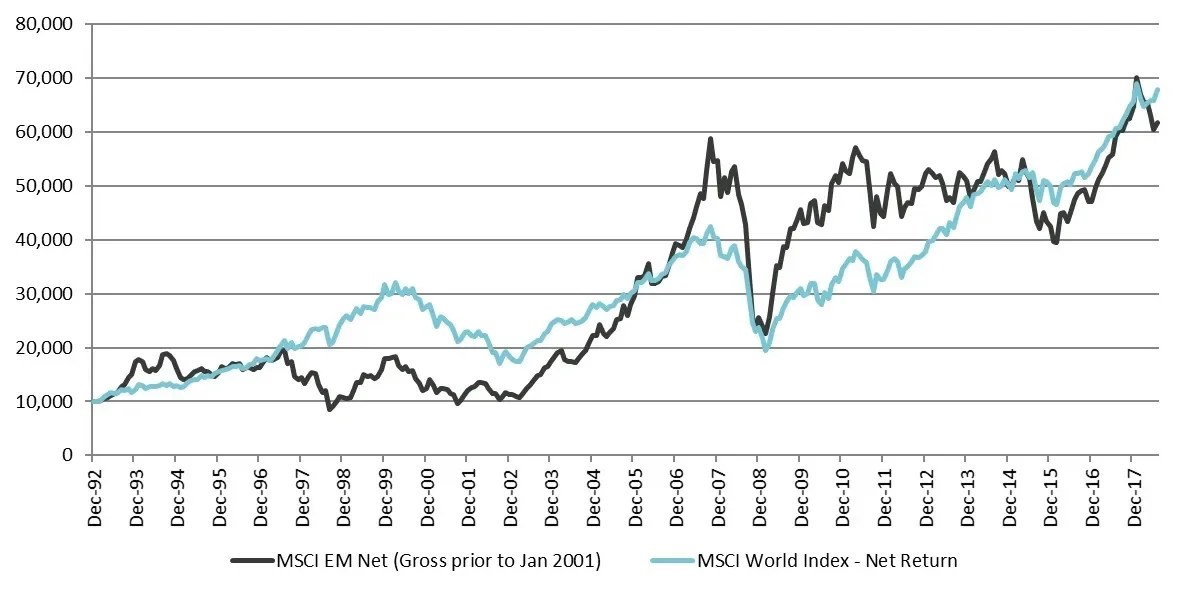
Source: FactSet.
MSCI EM GD through 12/31/2000 and MSCI EM ND thereafter. MSCI World Index – Net Return
Figure 3 – Performance Over Rolling 12-month Periods of MSCI EM vs. MSCI World (DM)
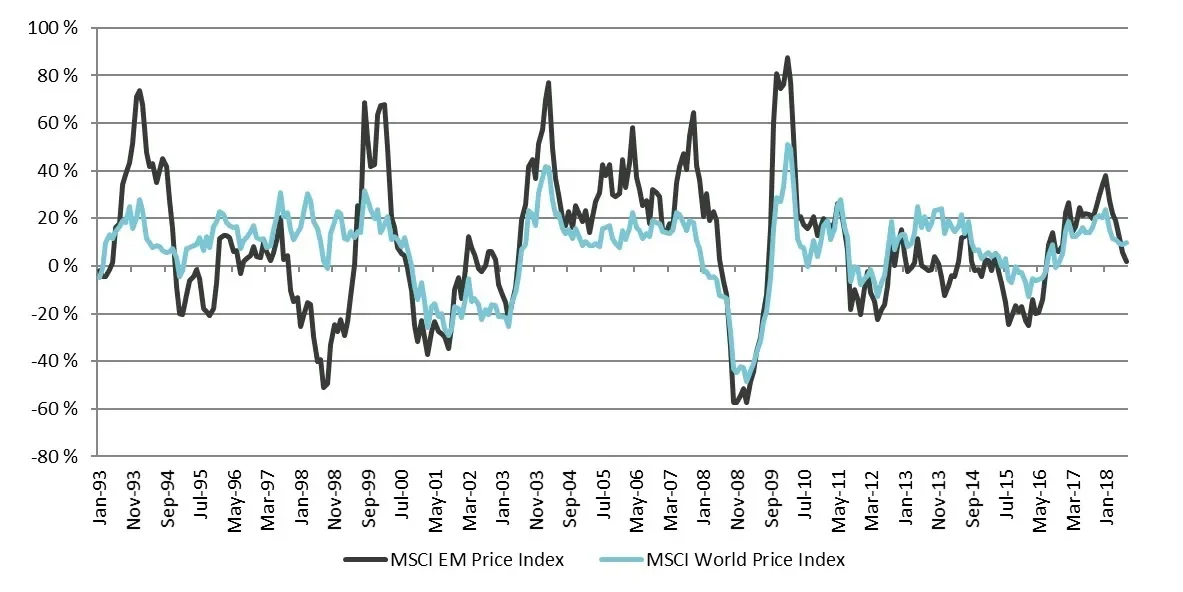
Source: FactSet
MSCI EM GD through 12/31/2000 and MSCI EM ND thereafter. MSCI World Index – Net Return
Why Quality Growth in Emerging Markets?
There is already risk in the lesser developed EM economies, which is further lifted in equity markets – should an investor then look to invest at the cyclical end of the equity range? Whether it is governance risks, low visibility of earnings growth, or excess leverage, the risks do not diminish just because the market is strong. The benchmark is not choosy; rather it holds the full range of companies from tried and tested quality to the latest thing. As investors, we believe we should be highly selective when identifying quality.
Belief in the strength of our investment companies to deliver through good and difficult times is crucial in order to maintain course through the unpredictable economic weather, and to deliver the return potential held within the planet's most dynamic economic area – over the long haul.
Downside Protection
The Vontobel Fund – Emerging Markets Equity historically has been resilient during recessions and market drawdowns. The 10-year downside capture of our Fund has been 76% (net) through the end of May 2018 versus an upside capture of 84%. Our goal is to generate above-benchmark returns with below-market risk for our clients through the full economic cycle. For this, our investment process requires deep analysis to understand the businesses in which we are invested, and that these companies are less cyclical and less levered than lower quality companies found broadly across the benchmark. As bottom-up stock pickers, we look to invest in leading franchises with deep competitive advantages, earnings stability through the cycle, relatively predictable businesses, and the potential for many years of growth.
We have been managing the Vontobel Fund - Emerging Markets Equity for more than 20 years – consistently, throughout the cycle, focused on quality growth.
1. Source: McKinsey, historical estimates from Angus Maddison; University of Groningen, 2025 forecasts McKinsey. Center of gravity by weighting national GDP by each nation’s geographic center of gravity. Landmass radian coordinates transformed into Cartesian coordinates with a tool from the UK ordnance survey. These were transformed to coordinates into respective momentums and average these to a true economic “center of gravity” for each year, located within earth’s sphere. To illustrate a shift, the vectors were lengthened to lie on earth’s surface.
2. World bank estimate
Related insights

Quality investing: focus on predictable and resilient growth

China Luxury: Green shoots or a structural shift?

Waiting for the “fat pitch”: Lessons from the 2026 Berkshire Hathaway Annual Meeting

Silicon is the new oil: Why the AI compute cycle still has runway

Itchy business: Galderma tackles a vexing problem in dermatology
