Global Warming and Climate Zombies
Quality Growth Boutique
Video calls, driverless cars and plant-based meat were fantastical ideas 50 years ago, yet the great science-fiction writer Isaac Asimov imagined all that and more. The combination of imagination and science has long had entertainment value, but it’s also provided some prescient looks into the future.
For a while now, Cli-Fi or Eco-Fiction writers have also given us a glimpse, sometimes apocalyptic, of a future planet radically altered by climate change and massive resource depletion. But is it a stretch to imagine that our future lives will change based on current environmental events? Unprecedented wild fires rage in California, some say the result of poor forestry practices. Cape Town runs out of drinking water and many blame municipal mismanagement. Historic floods submerge 85% of Venice, Italy and a flood-barrier infrastructure project plagued by corruption since 2003 is fingered as the culprit.
Could global warming have played a role? Likely the answer is that both climate change and resource mismanagement are creating environmental disasters. The thing is, though, once you recognize that it’s not just local human error but also part climate change—the terrifying reality of what steps to take next sets in. What turns concern about the climate into full-blown anxiety for investment managers is the lack of granularity of scope and consequences. It’s infinitely harder to get one’s arms around time horizons and impact if you don’t have key variables to plug into models, or even know where to look for trouble. Institutional investors are now in the precarious position of having to forecast and manage climate change when fact and fiction are still blurred.
The outcome of investment choices we make over the coming decade is moving in slow motion. How should investors bridge the gulf in time between the decades ahead, as the climate finds a new equilibrium, and an investment horizon where the long term can mean just five years? It’s a bridge we need to cross. If we as investors don’t manage this, we will pay a price. There are dozens of companies where the potential damage to assets and operations from climate change is estimated to be greater than their market value. The transition from going concern to what we think of as a climate zombie can be avoided, but it will require adaption.
The framework we think makes sense to search for potential trouble is relatively simple. It’s primarily focused on searching for downside as measured by the value a company has at risk from climate change. Behind this simple construct are some fiendishly complex models running a broad range of scenarios. Nevertheless, you have to start somewhere and the methodology brings an understanding of where important exposures lie, even if they are not precise. And some risks really stand out. The risks from regulation are large, near term, evolving and impact the large emitters of greenhouse gases most.
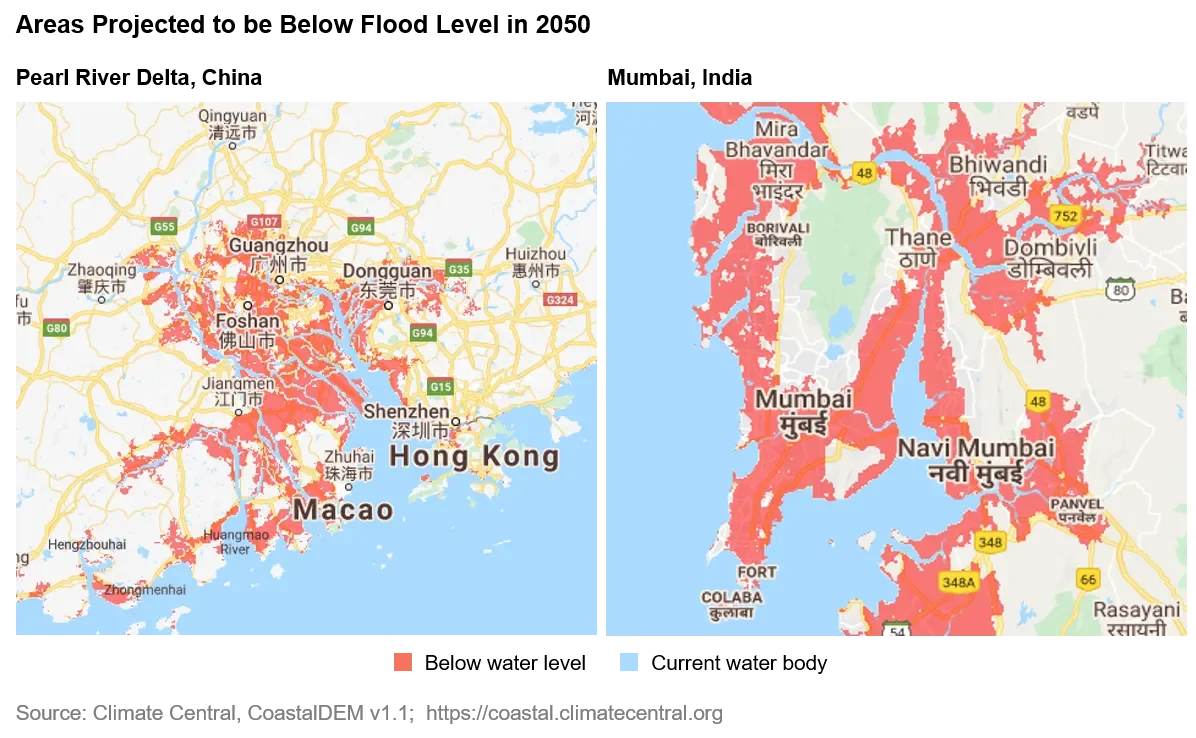
In terms of physical risks, coastal flooding is front and center. Rising seas alongside increased urbanization are coming together to create sizable and growing flood zones in low-lying areas. Large coastal cities at risk of future flooding include those around the Pearl River Delta in China including Guangzhou, India’s commercial capital Mumbai, and Bangkok.
A road map
Climate risk can be viewed from three directions. This also follows the main thrust from TCFD (Task force on Climate related Financial Disclosures), which we see as a sensible structure.
- Policy risk - New regulation or tax targeting emission cuts
- Physical risk - Vulnerability to changes in productivity and demand
- Opportunities – Adapting products and process to changing markets
There is an important difference between policy risks and physical risks. Policy risks are near-term risks; the sooner emissions are cut the better. Physical risks and new opportunities, however, stretch out into the longer term.
For a sense of broad vulnerability, the table below pulls together estimates of how much potential damage companies could face from climate change. We have used the Climate VaR research models from MSCI1 to provide the value estimates. We show these as a proportion of market capitalization. Unsurprisingly, the highest emitters carry the greatest sensitivity to policy risk. For physical risk, geographic exposure of physical assets and business drives the calculation.
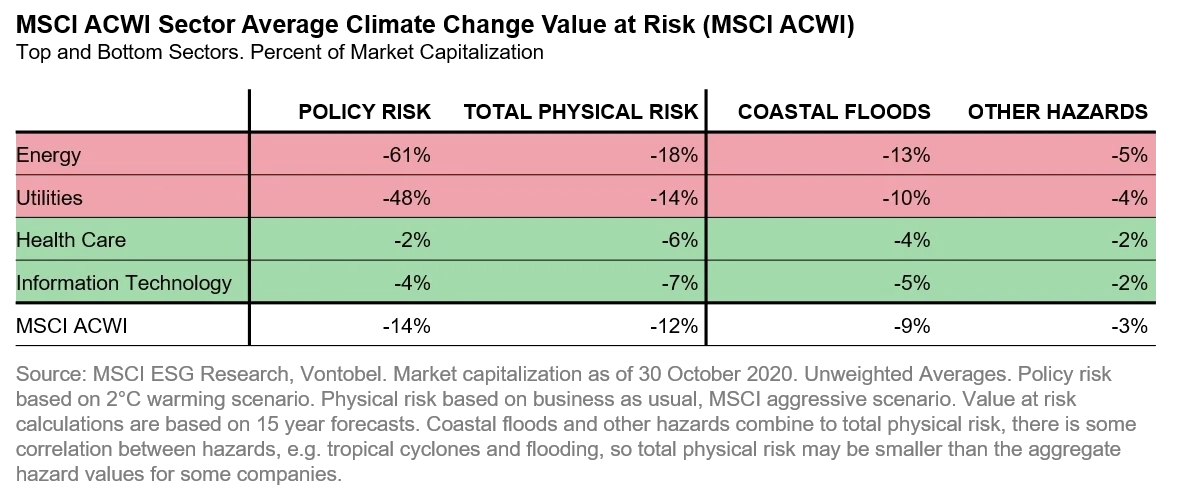
While policy risk estimates are larger than physical risk across the benchmarks, that’s not the case for all companies. Potential physical hazards for businesses range from insurance underwriting-type risks for flooding, through to commodity buyers or large fresh water users who may face supply shortages or government action to protect farmers. But it’s also worth remembering that it’s easier to reduce risk values for some companies. For example, it would be easier for a software company that has data stored in the cloud and primary productive assets that can be easily relocated, than it would be for a semi-conductor foundry with billions tied up in stationary plants.
Zombie risk
When looking at red flags, it’s sensible to start with the biggest ones. The chart below shows the proportion of companies (by number) estimated to have value-at-risk as a result of climate change greater than their market capitalizations – i.e., climate zombies.

There is a fair amount of sector consistency across geographies, although more physical risk registers across the Emerging Markets. Looking at the S&P 500, some 17 of the 19 climate zombies reached the mark on policy risk alone, before taking physical risk into account. The 19 included nine energy companies and five airlines. For MSCI Europe, 37 of its companies originating from 13 countries, met this mark. Of these, 10 are materials (four steel manufacturers), eight utilities, and seven energy. For the EM, which has the highest proportion in zombie territory, more than half came from the large industrial markets of China (88 companies), South Korea (16), and India (14).
We stress though that it is important not to take the values too literally. These are broad estimates and the models are still relatively new. But when the figures are high, they raise a red flag – a start point for further investigation, rather than an end point for action.
Case in point: Las Vegas Sands
One of the highest estimates of physical value-at-risk to market capitalization in the S&P 500 is Las Vegas Sands. Despite its name, the majority of the company’s value stems from its gaming and hotels business in Macau, China. The research from MSCI points to coastal flooding risk for Macau. From the map above, you can see that Macau is at the edge of the Pearl River Delta and at risk of future coastal flooding. How much the government invests into sea defenses will make a difference at some point. It would not be good for the business if the Chinese government decided to move its gaming focus to a different location and issue new licenses. This does not appear a near-term risk, but it’s an eye opener and worth considering.
1. Policy risk
Policy and physical risks are differentiated by time: if a company is bankrupted by policy risk, the physical risks will not matter to shareholders. So policy risk is the place to start.
The regulatory landscape is shifting and estimates of value-at-risk will move with it. Risk varies by country. The potential costs from a country stem from its stated emission cuts under the Paris Agreement2. These cuts are split by sector, and finally shared among companies by market share. Importantly, the forecasts are based on filed submissions and not anticipated changes.
The EU has set an aggressive pace regulating its transition to a low-carbon economy under the European Green Deal. But the largest impact from new regulation could come from the world’s top two emitters, China and the US. Both appear set to take aggressive steps to transition to lower emissions. In September 2020, President Xi Jinping announced China’s goal to reach carbon neutrality by 2060—a significant step up from the previous plan. The US is one of very few nations not currently a signatory to the Paris Agreement, although looks set to rejoin under the Biden administration. The US approach will likely differ from the EU given the politics. Regardless, the US President carries considerable influence and power to forge regulatory change through the use of Executive Orders and so on. There’s a good chance that US businesses will face a sharp change in the regulatory environment around climate issues, which would involve significant costs.
2. Physical risk
Flooding in coastal areas appears to be the most serious risk faced by cities. Based on estimates from MSCI, coastal flooding accounts for some 80% of the total physical risks for the MSCI ACWI. Followed by extreme heat, which can lead to derivative problems such as water stress. While the MSCI model forecasts eight major climate hazards, it is yet to attach modules covering problems such as wild fires and water security. We expect these regionally important risks to be added in time.
A comprehensive picture of climate change is brought together by the IPCC, the climate change arm of the United Nations, every few years in their Assessment Reports. The latest Assessment Report (AR53) identified the following key risks with high conviction:
- Sea level rise and coastal flooding
- Extreme rain and inland flooding
- Increased frequency of extreme heat
- Rain variability and drought
Due to the nature of global warming, climate changes will move in opposing directions in different areas. Some cities are forecast to struggle with excess water from coastal flooding. In other regions, farmers and staples companies will face water shortages from droughts.
Extreme climate conditions lead to productivity loss. This impacts both the incomes of workers (who are also consumers) and companies. As an example, studies from the International Labor Organization have shown labor productivity for moderate work falls some 50% on days when temperatures reach 33-34°C. While for office workers, productivity falls an average of 17%4 when days reach 35°C.
Estimating physical risk takes several steps. The analysis starts with mapping the physical locations of each company. This is a task, as few businesses publish the location of their physical assets – not to mention those of important suppliers. When mapped, the characteristics of the locations can be established: elevation, distance to the sea, distance to rivers, etc. Climate change models can then estimate condition changes faced by each location under different scenarios. Days of extreme conditions are converted to impact on productivity through a vulnerability matrix that reflects historical relationships. The revenue forecasts are then adjusted for lower productivity days. It’s rudimentary, but enough to generate red flags worth investigating further.
Coastal flooding
A combination of climate and urbanization has made coastal flooding a major concern. Sea levels that have risen gradually are expected to start accelerating as they warm and glaciers melt. While the potential of sea levels being 1.3 meters higher by the end of the century5 may not seem a lot, the effect becomes more worrying when run alongside expectations for tropical cyclones to become ever more severe. The storm surges that accompany cyclones can cause significant flooding, but with higher wind speeds and sea levels, the combination is likely to push floods further inland and cause problems for areas without effective sea defenses.
As if this isn’t enough, urbanization has weakened estuaries, deltas and wetlands thus the issue of sinking land (subsidence) is also at play. Over the past 100 years6 eastern Tokyo has sunk 4.4 meters, Shanghai by 2.6 meters, and Bangkok 1.6 meters primarily due to the impact of people removing water from underlying sediment, trapping sediment in reservoirs upstream, as well as the weight of cities themselves.
The models do not factor in the future construction of sea defenses. These defenses will support only the consumers and companies operating in nations that can afford to make the investment.
3. Upside opportunities
A company’s ability to evolve as demand changes is fundamental. This is an area that may be best researched bottom up, company by company. The importance of adjusting is urgent for certain companies, particularly those facing regulatory risk. Companies such as wind turbine manufacturers will gain at the cost of coal miners. But for many companies the development of products, such as shampoos that take less water to rinse, are less identifiable. Closer to normal business in a competitive market.
Summary
As investors, our analysis should combine realistic, fact-based research with forecasting. With climate change, the forecasting part requires us to be more open-minded and brace for the unknowable—both for better and worse. We’ve come to the conclusion that this means, at a minimum, more research work on company physical risks, and keeping a keen eye on regulation’s direction of travel. To sustain and protect assets, every company needs to think through the potential scenarios of climate change. Our observation is that managements tend to worry less about risks they have not recently experienced, even if they are operating on the banks of a delta. Maybe it’s human nature to think that we can outwit the natural forces of the planet and, sometimes, it’s a strategy that works. But we’re not fond of leaving fate to chance. The best defense to climate change, as well as the key to good investing, is preparation—anticipating the worst-case scenarios, and staying ahead of risk.
1.MSCI bought Carbon Delta, a climate FinTech, in October 2019
2.The goal of the Paris Agreement is to keep global temperature rises this century to less than 2°C above pre-industrial levels through cutting the emissions of greenhouse gases. Each signatory country submits a Nationally Determined Contribution (NDC) outlining their plan to cut emissions.
3. IPCC fifth Assessment Report www.ipcc.ch/report/ar5/wg2/
4. MSCI ESG Research
5. AR5 from the IPCC, estimate from the Dutch Delta Programme
6.Syvitski et al, 2009, Teatini et al, 2011, Mazzoti et al., 2009
Certain information ©2020 MSCI ESG Research LLC. This report contains “Information” sourced from MSCI ESG Research LLC, or its affiliates or information providers (the “ESG Parties”). The Information may only be used for your internal use, may not be reproduced or redisseminated in any form and may not be used as a basis for or a component of any financial instruments or products or indices. Although they obtain information from sources they consider reliable, none of the ESG Parties warrants or guarantees the originality, accuracy and/or completeness, of any data herein and expressly disclaim all express or implied warranties, including those of merchantability and fitness for a particular purpose. None of the MSCI information is intended to constitute investment advice or a recommendation to make (or refrain from making) any kind of investment decision and may not be relied on as such, nor should it be taken as an indication or guarantee of any future performance, analysis, forecast or prediction. None of the ESG Parties shall have any liability for any errors or omissions in connection with any data herein, or any liability forany direct, indirect, special, punitive, consequential or any other damages (including lost profits) even if notified of the possibility of such damages.
Related insights

Quality investing: focus on predictable and resilient growth

China Luxury: Green shoots or a structural shift?

Waiting for the “fat pitch”: Lessons from the 2026 Berkshire Hathaway Annual Meeting

Silicon is the new oil: Why the AI compute cycle still has runway

Itchy business: Galderma tackles a vexing problem in dermatology
