Inflation’s illusion on carbon intensity – don’t be deceived
Quality Growth Boutique
Given most of us have not seen high inflation for many years, if ever, it’s important to remember that inflation distorts the perception of underlying value. Money as a measure can be a strange beast. Beyond taking a hammer to most people’s spending power, inflation has the potential to dangerously distort the read of progress on the reduction of greenhouse gas (GHG) emissions by investors.
One of the most common ways investors track the progress of GHG emissions from their portfolios is using carbon intensity, commonly measured as tons of CO2e per $1 million in revenue1. If inflation in 2021 and 2022 pulls average revenue up say 15% for companies in a portfolio or benchmark, this could knock 13% off their carbon intensity figures2. It is important that investors who are targeting Paris Aligned reductions understand and adjust for this issue – or a couple of years of progress could be squandered.
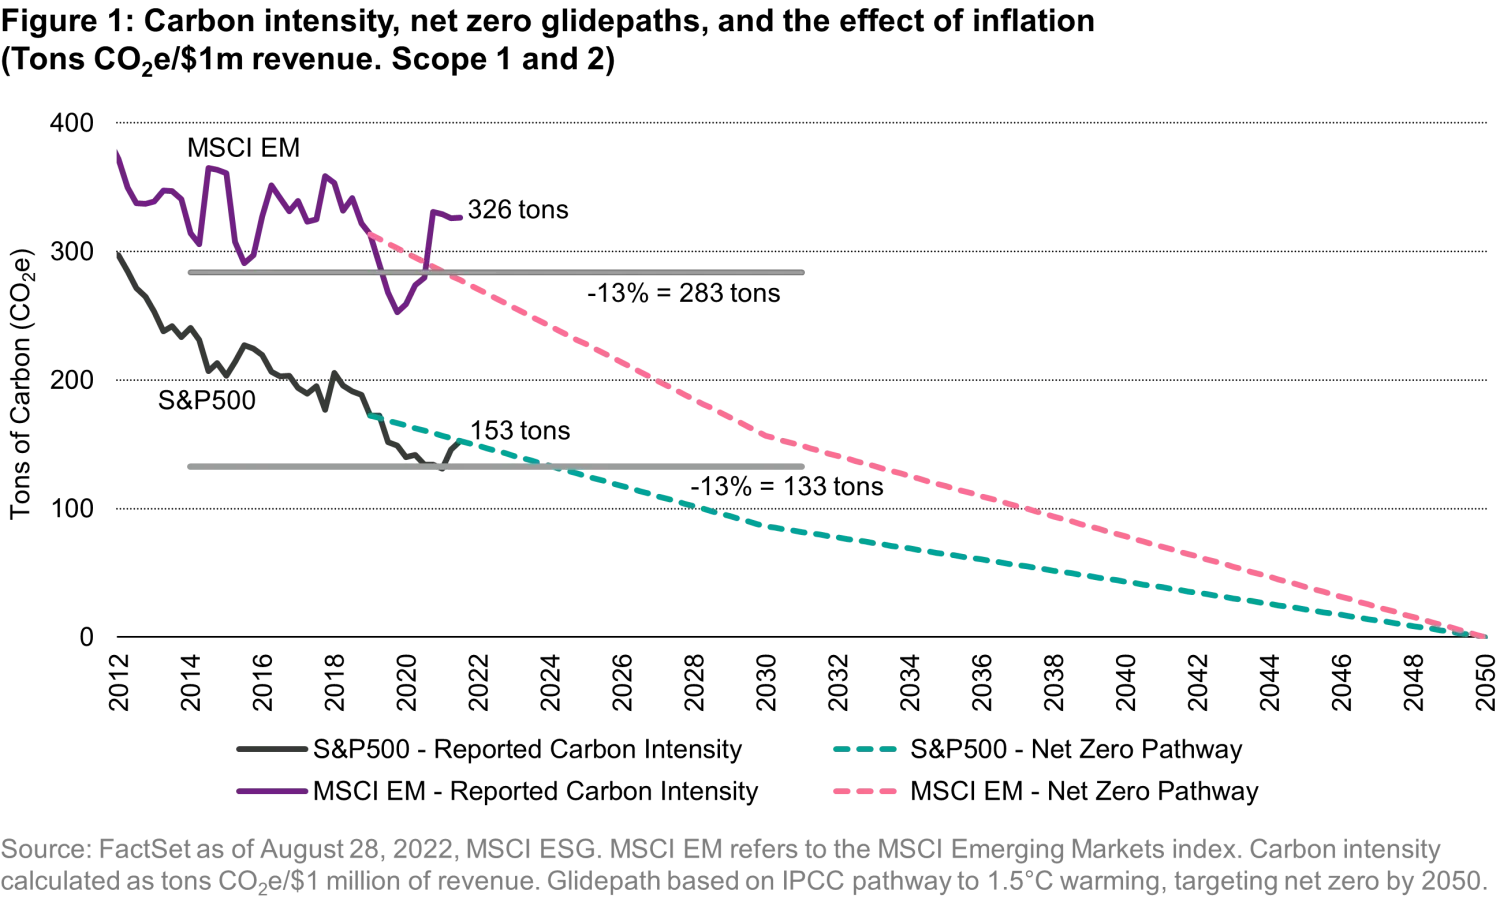
The chart below outlines the recent history of carbon intensity for the S&P 500 and MSCI Emerging Market (MSCI EM) indices using tons of CO2e/$1 million revenue. I drew in target glidepaths for emissions based on guidance from the Net Zero Asset Managers Initiative (NZAM), which calls for around a 50% cut in emissions by 2030 compared to where they stood in 2019 (and then on to net zero by 2050). On this trajectory, a 13% fall in carbon intensity from where it stood at the end of the last quarter (2Q22), amounts to 2.5 years for ‘progress’ for the S&P 500 and 3 years for the MSCI EM. The grey lines on Figure 1 indicate where a 13% haircut would take the latest figures, assuming nothing else changed. All without lifting a finger…
The measuring problem stems from the revenue yardstick inside the carbon intensity measure (CO2e per $1 million of revenues). Using revenues as a common unit helps make like-for-like comparisons across industries and by size of business. As inflation lifts prices, sales will grow quicker than the number of items sold – assuming volumes remain steady. So, each $1 million of revenue requires fewer carbon emissions. This can appear as progress as the example below illustrates for an imaginary brewery.

Many investors are signing up to initiatives targeting the reduction of greenhouse gas (GHG) emissions to limit global warming to 1.5°C. A popular method to do this is to target a glide path and track carbon intensity. For a sense of scale of funds following this path, the Net Zero Asset Managers Initiative (NZAM) already has more than 270 signatories managing US$61 trillion in assets.
Fortunately, in the operating world, most companies with an announced abatement plan are targeting cuts in absolute tons. This challenge is primarily for asset managers who need to track change across a portfolio and deal with practical problems such as how to factor in the contribution from a company without a reduction plan – do you need to forecast growth and its associated emissions for each company through to 2050? Do you ignore the ones without a plan because that amounts to a lot and defeats the object of tracking the portfolio? Intensity comes in handy for these kinds of calculations.
The takeaway: This problem could be overcome by using an alternative yardstick to revenues. Industrial measures such as volume of drinks produced, electricity production MWh, or hours worked by telephone operators can also work. Although intensity is not then compatible between industries, the rate of change is. It would also help gauge progress for companies selling commodities such as oil or grains, where prices bounce around in the market. At this point, very few companies report intensity on industrial unit basis, but it would be helpful.
It is challenging to the institutional investment community to run a marathon before its laced up its shoes. But if investors are using revenue backed carbon intensity as their central tracking metric, then inflation needs to be addressed. There is solid logic in using operating yardsticks when they can be obtained. As carbon emissions are only reported (or estimated) once a year, and often come through a year or so after period end, inflation should not yet be reflected in the numbers above. It’s an important illustration where, for the sake of convenience, data can lose its integrity.
Important Information
The views and opinions herein may change at any time and without notice. Such information is not intended to predict actual results and no assurances are given with respect thereto. Certain information herein is based upon forward-looking statements, information and opinions, including descriptions of anticipated market changes and expectations of future activity of countries, markets and/or investments. We believe such statements, information, and opinions are based upon reasonable estimates and assumptions. Actual events or results may differ materially and, as such, undue reliance should not be placed on such forward-looking information. Vontobel reserves the right to make changes and corrections to the information and opinions expressed herein at any time, without notice.
Certain information ©2022 MSCI ESG Research LLC. This report contains “Information” sourced from MSCI ESG Research LLC, or its affiliates or information providers (the “ESG Parties”). The Information may only be used for your internal use, may not be reproduced or redisseminated in any form and may not be used as a basis for or a component of any financial instruments or products or indices. Although they obtain information from sources they consider reliable, none of the ESG Parties warrants or guarantees the originality, accuracy and/or completeness, of any data herein and expressly disclaim all express or implied warranties, including those of merchantability and fitness for a particular purpose. None of the MSCI information is intended to constitute investment advice or a recommendation to make (or refrain from making) any kind of investment decision and may not be relied on as such, nor should it be taken as an indication or guarantee of any future performance, analysis, forecast or prediction. None of the ESG Parties shall have any liability for any errors or omissions in connection with any data herein, or any liability for any direct, indirect, special, punitive, consequential or any other damages (including lost profits) even if notified of the possibility of such damages.
1. CO2e stands for CO2 equivalent. This is the weight of CO2 that would be equal to the emissions of a range of greenhouse gases.
2. Note the calculation is tons of GHG emissions over revenue. So it is the denominator that is rising.
Related insights

Quality investing: focus on predictable and resilient growth

China Luxury: Green shoots or a structural shift?

Waiting for the “fat pitch”: Lessons from the 2026 Berkshire Hathaway Annual Meeting

Silicon is the new oil: Why the AI compute cycle still has runway

Itchy business: Galderma tackles a vexing problem in dermatology
