Carbon Emissions: Does engagement carry a punch?
Quality Growth Boutique
Primal instincts protect us from immediate threats. Because of our problem-solving skills, humans have endured and thrived in hostile environments for millions of years. Yet our skill set to solve for risks that play out over time are less well-honed. While the impact of climate change continues to mount, the difference between actions and outcomes are painfully slow – too slow. By now, it’s impossible to ignore the drastic change in weather patterns: severe droughts worldwide at the same time are finally providing the public and asset owners a sense of urgency to act. A 2022 UCLA-led study1 held an estimate that the 22-year drought in the Southwestern United States is the worst in at least 1,200 years.
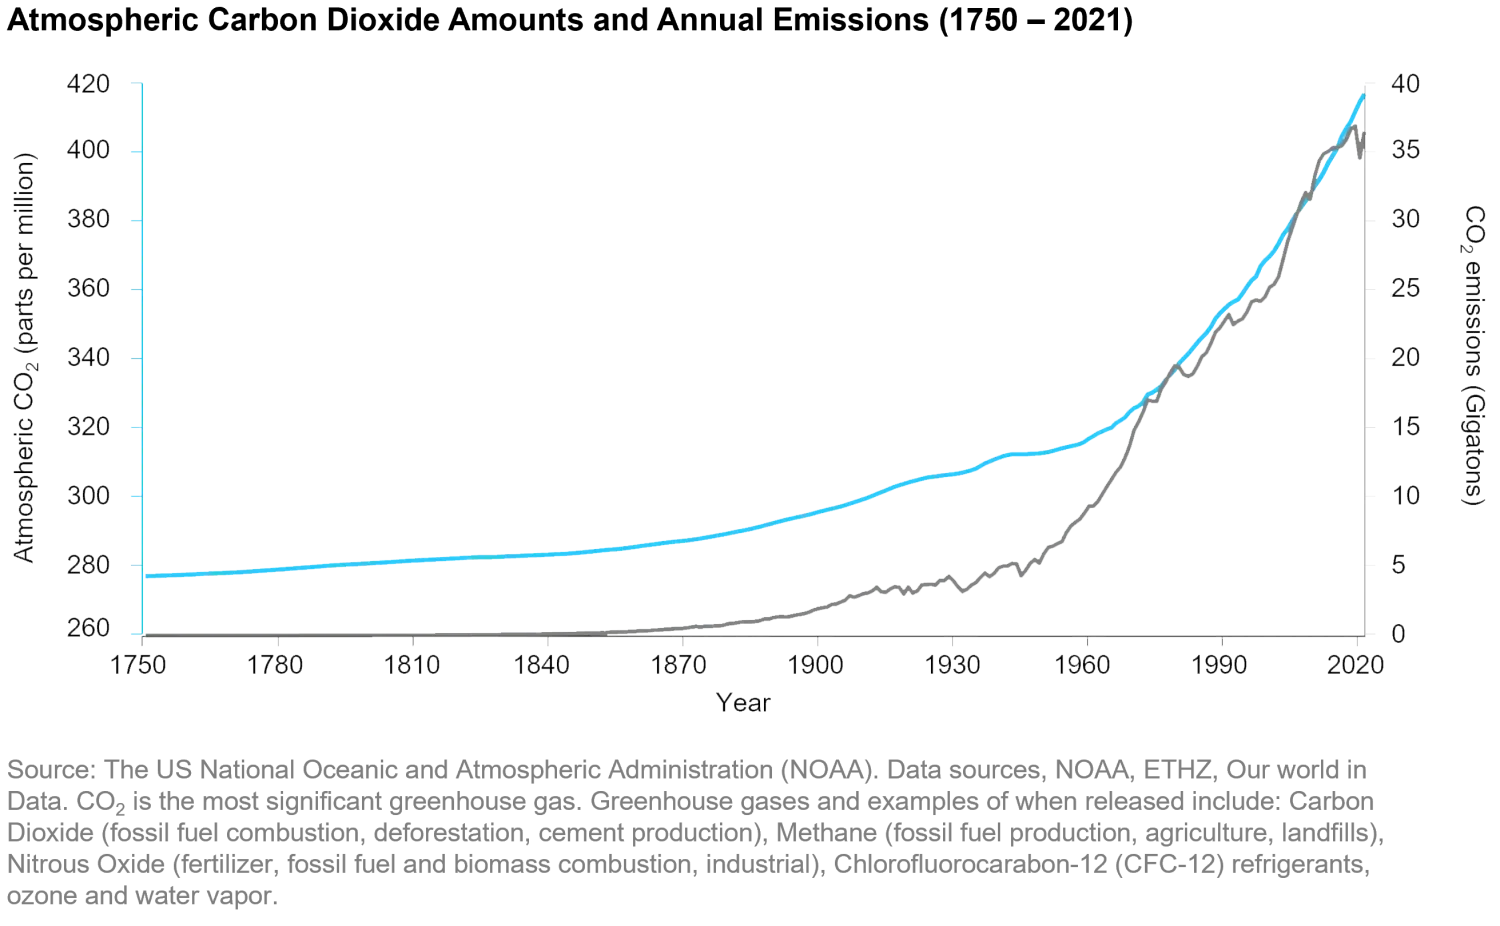
Annual global greenhouse gas emissions jumped 6.2% in 2021 to a new record2, surpassing the pre-pandemic peak. As the pressure to act builds, it’s crucially important for investors to frequently recalibrate and make sure environmental initiatives to reduce carbon footprints are best placed. The chart below provides some context, showing the amount of carbon dioxide (CO2) in the atmosphere (blue line) alongside emissions from human activity (grey line) since 1750.
Because listed companies account for a sizable proportion of overall emissions, investors should be able to make a difference. Let me explain what I mean. It’s assumed that listed companies account for a large amount of greenhouse gas emissions, but personally I don’t have a sense of what proportion, or where investors are likely to have more effect. I have not seen any figures published, so I took a stab at estimating how much of total emissions listed companies account for – on the back of a large envelope. My best calculation is that listed companies account for between a quarter and a third of total global emissions depending on which types of emissions are measured.
Where the emissions come from matters as the more that come directly from a company’s operations, the more control a management team should have, and the less reliant they will be on persuading suppliers or customers to change practices.
Emissions are separated into three buckets or ‘Scopes’. Scope 1 is the closest to home, and covers emissions made directly by a company’s operations, such as the fuel burnt from driving a company-owned delivery van. Scope 2 is the next step away and covers emissions from power generation, mainly electricity, bought from a third party. Scope 3 is the broadest and includes all the emissions up and downstream in the company’s value chain. For instance, this covers the full range of touchpoints involved in the company’s products stretching from raw commodities, components, and transport (considered upstream) of the company, through to its customers using and disposing of its products (downstream).
The proportion of emissions from listed companies based on my numbers are 22% by Scope 1, 4% by Scope 2 and 10% by Scope 3 (deduplicated – will explain later) for a total of 36%. These are annual emissions of 16.9 billion tons of greenhouse gases compared to a global total of 46.3 billion tons3. These are needle-moving volumes. But what do these figures tell us? First, nearly a quarter are emitted directly from the companies, with a further 4% from their electricity providers—and that supports the rationale for engagement.
Furthermore, the proportions vary considerably by market, so there will be more investor influence in certain places. Listed companies accounted for the highest proportions (all three scopes) in markets including Japan (92%), UK (90%), and South Korea (86%). The US stands at 62%. The Chinese rate seems low at 35%. But it’s such a huge market the absolutes are significant. For context, China’s 2.9 billion tons of Scope 1 emissions from listed companies is larger than the equivalent from the US, the UK, Japan, Germany, Canada, and France combined.
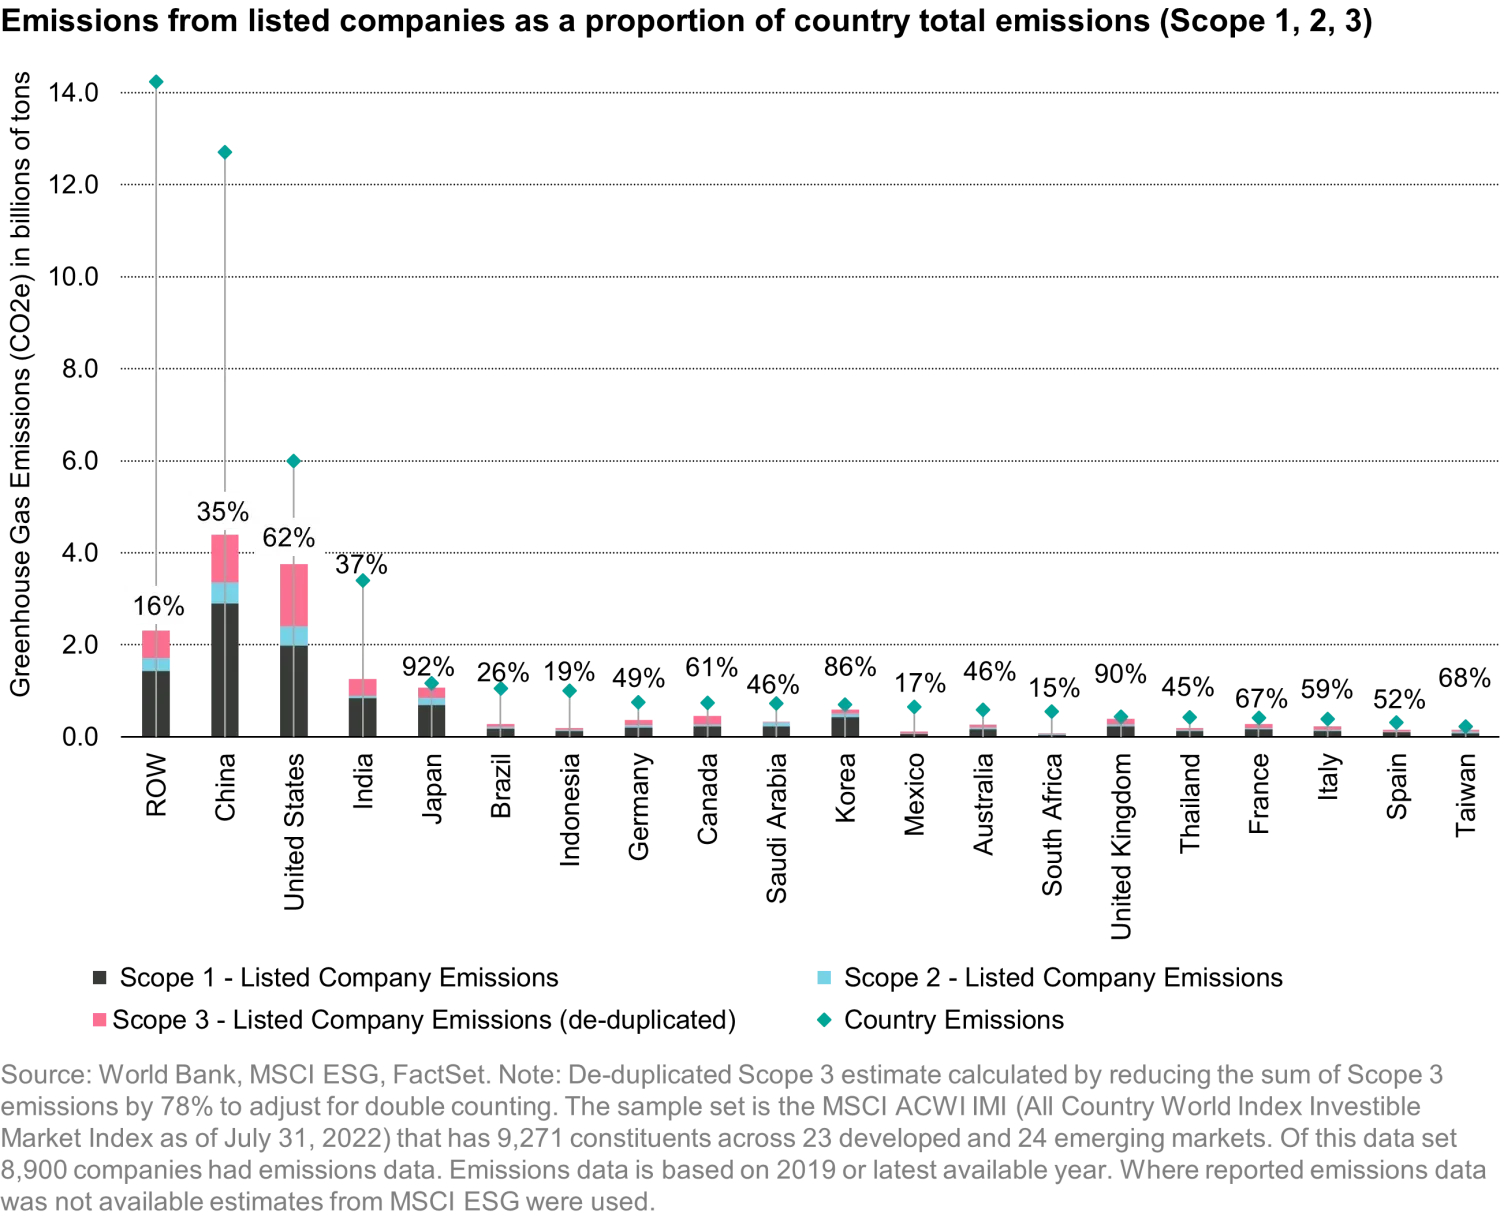
I should mention how I went about the calculation as companies don’t generally report where their emissions are made. It would be misleading to place all of Ford’s global emissions in the US basket. As a proxy, I assumed emissions fall in line with the geographic split of a company’s revenues. To do this, I used the GeoRev service from FactSet which makes estimates of revenue split when disclosures are not available. Not perfect by any means, but a step towards reality. The other sizable adjustment I had to make was to reduce the double counting in Scope 3, which I will cover in a moment. MSCI estimates duplication accounted for 78% of the cumulative Scope 3 emissions in their ACWI IMI Index. So, I followed this as a rule of thumb, and reduced the back of the envelope Scope 3 by the same amount (78%), and that left it significantly smaller than you might otherwise imagine.
Take care with Scope 3
Scope 3 is a much-discussed topic. Its big, unwieldy, and difficult to calculate. Moreover, it requires people sticking their noses in other people’s business. Scope 3 can be huge relative to Scope 1 and 2 at the individual company level. For example, Nestlé, the world’s largest food company, had 2021 Scope 1 emissions of a relatively modest 3.3 million tons of CO2e. As the company is not a big farm owner, the lion’s share of its value chain emissions sit in Scope 3 from its suppliers. For the same year, its Scope 3 was 34x larger than its Scope 1, at 113 million tons. The methane from dairy cattle were a large contributor to this.
Scope 3 is relatively straight forward (in concept) at the individual company level. But adding it up across an index leads to considerable double counting. The illustration below shows how multiple handlers of 1 ton of carbon emissions equates to 5 tons when measured as Scope 3 (emissions ultimately released by the car drivers).

An effective punch
I would not suggest for a moment that engagement across these emissions will have an even likelihood of success. From years of personal experience, it is clear how much harder it can be working with Emerging Markets companies to encourage change. There, managers have fewer choices to adjust operations, and investor engagement options are also more limited. But this is a separate discussion.
In summary, if these numbers are anywhere near reality, then it would imply that investors can help towards reducing emissions in the real world by working with management teams of their portfolio companies to encourage disclosure and the creation of an abatement plan. Some managements will need investor votes to give them the bandwidth to pursue these goals. It’s a value that investors can bring to the table when the approach looks sensible. Having a fighting chance of impact in the real world starts by picking up the phone and having a conversation – it’s remarkable how few investors bother to take the time.
Important Information
The discussion of any investments in this paper is for illustrative purposes only and there is no assurance that the adviser will make any investments with the same or similar characteristics as any investments presented. The investments identified and described do not represent all of the investments purchased or sold for client accounts. The representative investments discussed were selected based on topics related to our ESG research. The reader should not assume that an investment identified was or will be profitable. There is no assurance that any investments identified will remain in client accounts at the time you receive this document.
The views and opinions herein may change at any time and without notice. Such information is not intended to predict actual results and no assurances are given with respect thereto. Certain information herein is based upon forward-looking statements, information and opinions, including descriptions of anticipated market changes and expectations of future activity of countries, markets and/or investments. We believe such statements, information, and opinions are based upon reasonable estimates and assumptions. Actual events or results may differ materially and, as such, undue reliance should not be placed on such forward-looking information. Vontobel reserves the right to make changes and corrections to the information and opinions expressed herein at any time, without notice.
1.
https://escholarship.org/uc/item/6sm1c6hf
2. Rhodium Group estimate
3. World Bank
Related insights

Quality investing: focus on predictable and resilient growth

China Luxury: Green shoots or a structural shift?

Waiting for the “fat pitch”: Lessons from the 2026 Berkshire Hathaway Annual Meeting

Silicon is the new oil: Why the AI compute cycle still has runway

Itchy business: Galderma tackles a vexing problem in dermatology
