The TwentyFour Blog
Providing a diverse offering of market commentary from global, political and macro outlooks.
It’s a rally. Yesterday, the Federal Reserve released their new summary of economic projections (SEP), which, along with very dovish remarks by Chair Jerome Powell in the conference afterwards, have removed the little uncertainty that was left regarding the direction of monetary policy rates going forward.
Although the quantum and timing of the moves are not 100% clear and will depend on data, it is fair to say that a large obstacle has been removed from the path of future total returns in fixed income. Our interpretation of the Fed’s move is that they are receiving confirmation from the data that their central scenario is actually happening: a slowdown in growth with no recession and no big spike in unemployment, while at the same time inflation is moving slowly but surely towards the target. Furthermore, it would have been quite easy for Chair Powell to present some opposition to the rally and the relaxation in financial conditions that accompanies such a move, but he didn’t. Markets have rightly stepped on the gas as all traffic lights in sight have turned green.
About six weeks ago we wrote a piece titled
Why staying in cash could cost you 10% to 30%
. In this short article we discussed how staying in cash was likely to be detrimental to medium term returns given how high yields were in the context of monetary policy rates reaching their peaks. We showed how a portfolio of rolling T-Bills would be outperformed by a short duration investment grade portfolio and by a high yield portfolio.
The conclusion was that for any given risk tolerance level there would be a fixed income portfolio that outperforms cash over a medium term horizon. Locking in those yields looked very reasonable indeed. Moreover, we provided some evidence about the fact that a portfolio’s starting yield is a great predictor of future returns in the medium term as the graph below shows. This argues against making large asset allocation moves based on market timing that could lead to less predictable outcomes.
Starting yield versus three-year total returns, US$ one to three year broad market index.
Source: TwentyFour, ICE/BAML, index start date 1996.
Past performance is not a reliable indicator of future performance. Included for illustrative purposes only. It is not possible to invest directly into an index and they will not be actively managed.
Since then 10-year treasuries have rallied close to 100 bps, short rates have also moved significantly lower, and spreads have compressed. Rallies can be fast and furious and we cannot ignore the fact that there is a lot of cash on the sidelines in an environment where fixed income assets look attractive. Begs the question, how does the relative value of cash versus bonds looks like after the rally?
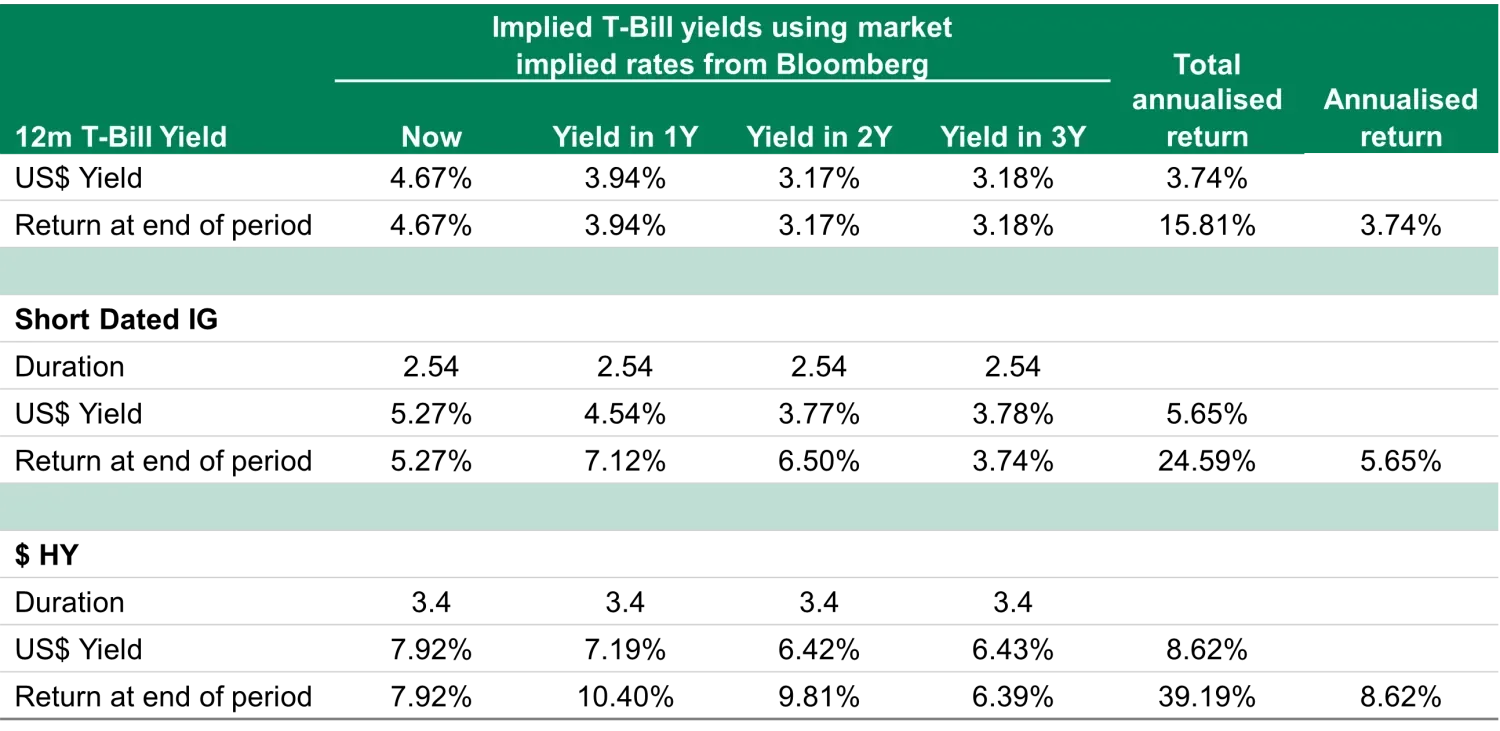
Not surprisingly, all three portfolios we used in the article aforementioned have seen their future returns curtailed by the lower starting point in yields. Additionally, as coupons and principal come in, they will be reinvested at lower yields. Nevertheless, the immense power of compounding interest rates remains unabated. Investing in T-Bills and rolling them for four years at current implied future rates delivers a riskless 15.81% return at the end of the period, 3.74% on an annualised basis. If we add a little dose of credit risk, we can see below that a short-dated $ IG index delivers 24.59% in the same timeframe, or a 5.65% annualised equivalent. If we increase the credit risk further, a high yield portfolio delivers 39.19% or an 8.62% annualised return. Over the medium term, bonds have a higher yield and compound to significantly better returns.
Projected performance is not a reliable indicator of actual future returns. Included for illustrative purposes only. T-Bill yields are based on Market Implied Policy Rates within Bloomberg. Yields are based on market expectations and are therefore subject to change without notice. ICE index projected performance is based on the respective current yield with subsequent years adjusted by the same T-Bill yield move assumptions. Projected performance has inherent limitations and one should take into consideration the limitations of the model applied.
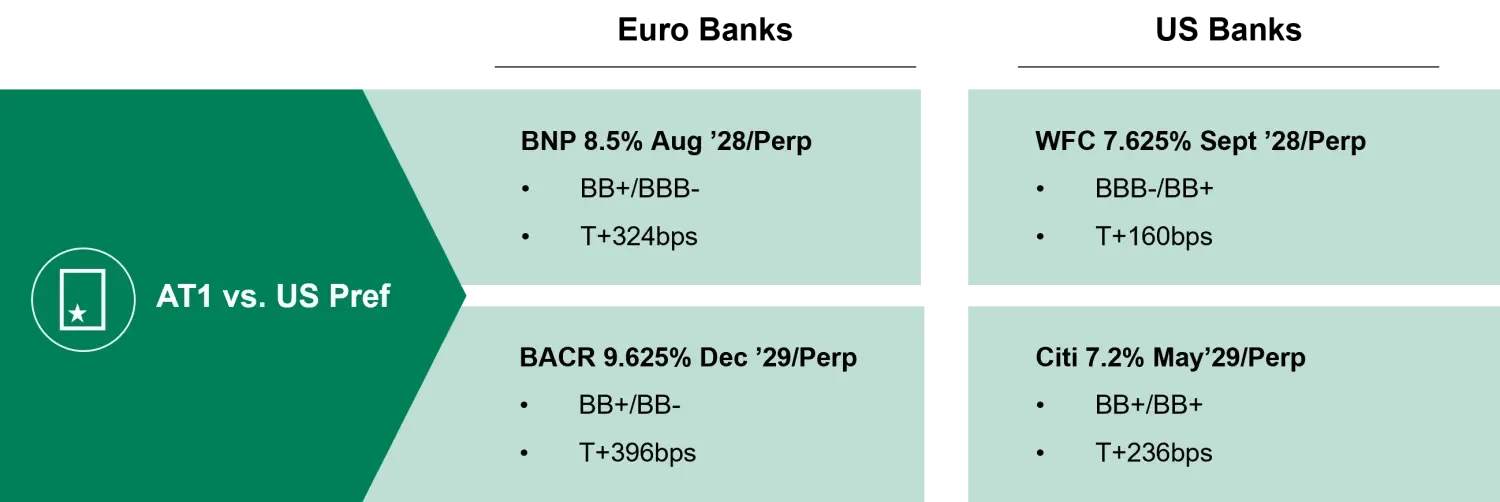
These are just numeric examples using plain vanilla indices. Of course if we added IG rated corporate hybrids to the IG portfolio, or a combination of AT1 bonds and mezzanine CLOs where double digit yields are still on offer, then returns could be even higher.
Another interesting observation is that the annualised return of the rolling T-Bill portfolio after four years is the one that most dramatically differs from the starting yield. All three portfolios are exposed to the same downward sloping dollar curve. But the additional return obtained by investing in spreads, compounded over time along with the longer duration that allows yields to be locked in for longer, more than offsets the negative slope effect. In a way, medium term investors are not investing at the current 4.67% in T-Bills. They are actually investing at 3.74% if they intend to hold on to T-Bills and not change their asset allocation. In other words, cash has massive reinvestment risk of principal and coupons. Although that risk is also present when investing in investment grade, high yield, longer US treasuries and others, the risk is much smaller.
In conclusion, the argument for moving out of cash into credit has not changed. In fact one could argue that it may be even better now. An annualised return in investment grade credit of 5.65% is roughly 50% higher than an annualised return of 3.74% for T-Bills. At the time we wrote our piece back in November the numbers were 6.36% vs 4.52%. Annualised returns in short-dated investment grade bonds were therefore close to 40% higher. If we replicate the analysis with the high yield index, at the moment the four-year annualised return of 8.62% is 130% greater than that of T-Bills. Six weeks ago the number was below 110%. The time looks to be now.