Water – Risks of a Vital Resource
Quality Growth Boutique
Water is as essential for business vibrancy as it is for human life. The food we eat, the clothes we wear, the electricity in our homes, and the chips that power our phones and computers – it’s all driven by the availability of quality water supplies. Even with promising technologies for reclamation, conservation and metering, there’s increasingly less and less water when and where business and consumers need it. It’s called water stress.
In large areas of the world it’s only going to get worse. As the world population continues to grow, water availability is expected to shrink. Climate change and higher temperatures are expected to result in dry tropical regions losing water due to more natural evaporation and changing rainfall patterns. Meanwhile, the population is forecast to grow by 750 million people over the coming decade.
Water shortages and disruptions are a clear and present business risk. Shortages have brought about higher water prices in California, created rationing in South Africa, and incited boycotts for global bottled drink brands accused of ‘stealing’ water from municipalities and waterways. Pepsi (Kerala, India), Nestle (US) and Constellation Brands (Mexicali, Mexico) have had to rethink their water security after facing a hostile backlash from consumers and local authorities.
There is a fair chance that in the near future companies will be left with worthless stranded assets as a result of water stress if they are not able to make more, with far less. The competitive advantage of water availability will become increasingly apparent. Agricultural enterprises in sub-tropical areas need to start shifting their sights towards the North and more temperate zones.
Until now, water stress has largely been a man-made problem of more consumption overtaking natural rates of replenishment. Human failings and industrial pollution have diminished access to basic safe drinking water. Sure, there are emerging technologies aimed at clean up and efficient management of water, but right now for investors it’s important to understand the current risks on the table and the range of mitigation opportunities.
In this note, I have tied the drivers of ‘water stress’ down to red flags at the company level worth investigating. Visibility into water stress is limited as companies are not required to disclose their consumption or exposure to stress for their operations or supply chains. But, there are ways to get a sense of bottom-up company risks without spending a fortune on a consultant.
Many companies have a shot at better water consumption before the problem becomes chronic. Investors need to be aware of the business risks created by water stress. As companies reduce their footprints in stressed areas, it will not only contribute to the health of many local communities and create goodwill with customers, but also help sustain future growth and competitive positioning. It’s that simple.
Water
Ninety seven percent of the world’s water is saline. A further two percent is frozen. The remaining one percent supports terrestrial life. Sources of freshwater include surface water, such as rivers and lakes, underground water stored in aquifers, and rainfall. Aquifers are underground bodies of gravel or permeable rock that hold water. These systems are interlinked. Combined in an area they are known as watersheds or basins.
Water can change in temperature, salinity, location underground, above ground and in the atmosphere. Climate change has the potential to affect all of these. Indeed temperature change is clearly observable with movements in fish stocks that have fewer barriers to movement than people. As water warms, it holds less oxygen and sea life shifts to cooler water towards the poles. Norwegian and Russian fishermen have seen their catch changing in the Barents Sea as a number of larger species have migrated north1.
Water stress by industry and geography
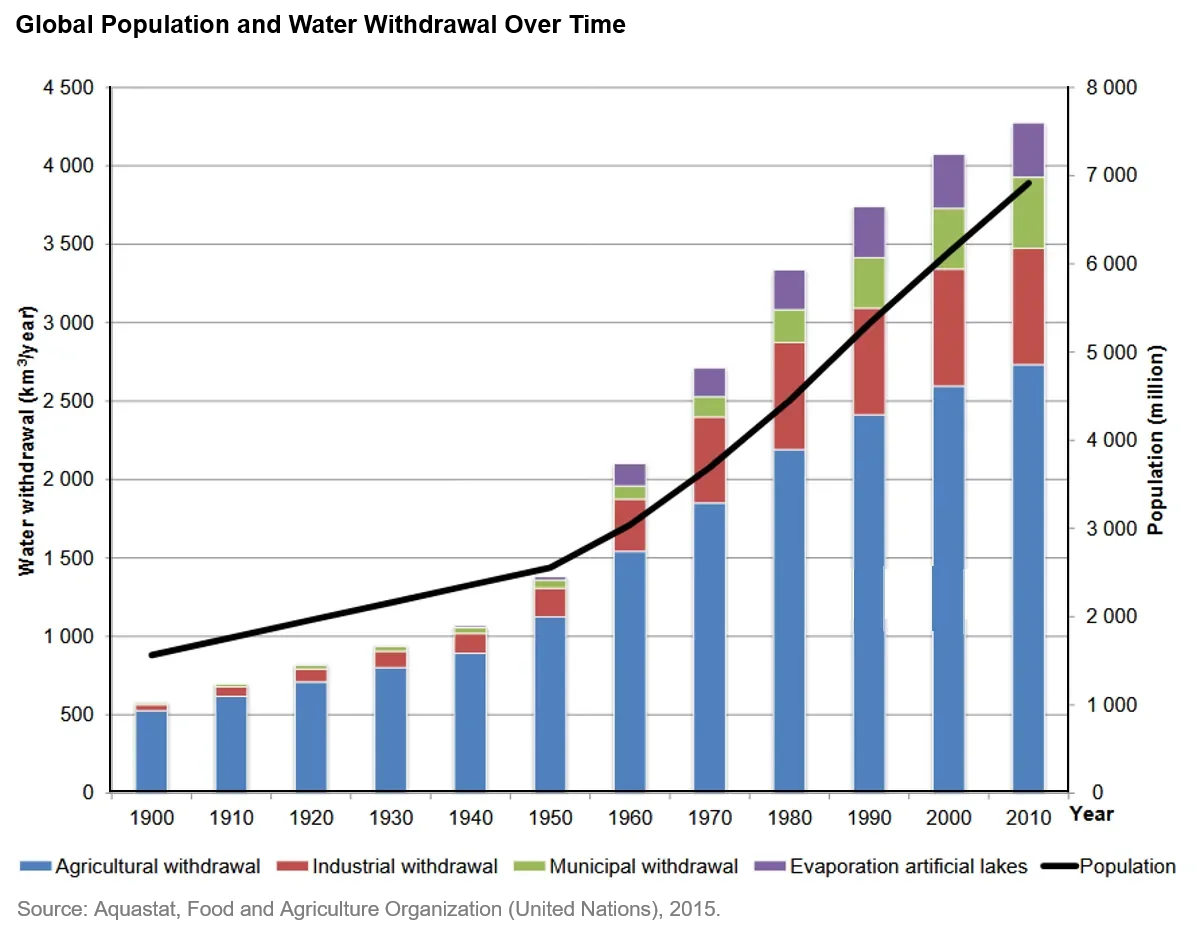
The lion’s share of water use is for food production. Agriculture accounts for 70% of freshwater use worldwide. A further 19% is used by industry and 11% by municipalities. The table below shows how closely water withdrawal and population are related.
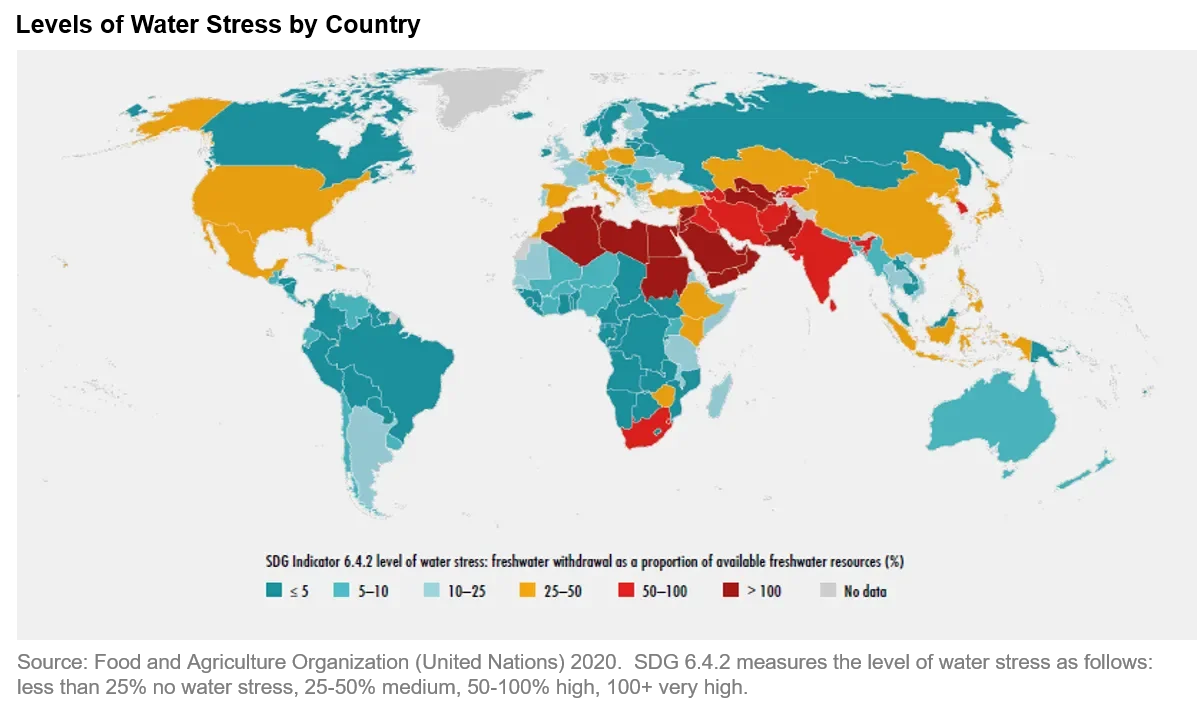
Water stress is defined as the proportion of freshwater withdrawn relative to available water resources. When this figure reaches 40%, water stress is regarded as high. Water stress is unevenly distributed across the globe. It is more prevalent in highly populated dry areas around the sub-tropical zones covering swaths of North Africa, India, Northern China, Southern US and Mexico. The FAO estimates that worldwide water stress (usage) was just 13% in 2018. However, at the national level, 40 of the 180 countries tracked are stressed, and 15 have levels above 100%. The table below shows how regions can vary dramatically even within countries, illustrating the importance of bottom-up factors.

In the US it might be surprising to find Arizona with a score of 3.5 as the location of a new plant for semiconductor giant TSMC. Semiconductor production uses very high quantities of water. Part of the deal to attract the company is an offer by the local government in Phoenix, AZ to spend $144 million on water and wastewater infrastructure. Effective investment can go a long way towards relieving water stress, but it can be expensive and not always feasible.
Company exposure
The first issue is consumption. Those companies with high water intensity businesses (water consumed per $1 million of revenue) will face the greatest headwinds should water become rationed or prices rise. The nature of a company’s business dictates the amount of H2O needed, and this is apparent by sector. Energy and utilities standout in both absolute and intensity measures. For context, thermoelectric power generation alone used 41% of US freshwater drawn in 2015.

Location is the second issue. To illustrate this across a range of broadly similar companies, I rolled the water stress scores of the individual companies in the utilities sector into country averages. The chart below shows the average score for each country with more than two companies available. There is a notable distribution. I have used company water stress scores from MSCI ESG, which are based on relatively broad based water stress scores calculated by the World Resources Institute, a global environmental NGO. These are helpful indicators. The scores rate business exposure, location exposure of operations, and management efforts in managing water risk. It’s interesting to find the Thai utilities with relatively weak scores given the country as a whole is well supplied, but bottom-up always relates to the specific operations and management. They tend to score relatively poorly due to the intensity of their operations and less impactful efforts to improve water efficiency.

Some companies facing water stress have been spurred into action. The multinational brewers have made notable progress. AB InBev, the world’s largest brewer, has cut water use per hectoliter of production globally by 35% over 10 years and Heineken by 33% in 12 years.
One of the central issues investors face is understanding the full water footprint of a company and its supply chain. Required disclosures covering water consumption and regional exposures would be very helpful if they were introduced. The magnitude of the issue was highlighted in a recent report by McKinsey and Co., that mapped the footprint of a retailer. They found the retailer itself only accounted for around 1% of the water used in the production-to-sale cycle. Suppliers accounted for 10-40% of the water, but sub-suppliers accounted for between 60-90% of water usage.
Benefits of reducing a company’s water footprint include the potential for market share gains from less efficient operators. Costs can be lowered and the reputation of the company improved. A company can also reduce their water sensitivity in their purchased supplies by bringing know-how and commercial support to small and medium sized suppliers.
Conclusion
Ultimately, businesses need to adapt and recognize the value of their water before the market fully reflects it. Investors can help to move management in the right direction and shine light on this vital element of their business. Change is likely to gain momentum when disclosures around water are required in the annual report; currently they are not. Best practices should include information on annual water withdrawals and consumption rates by a business unit and as a whole, as well as highlighting water exposure by sub-basin for the company and its supply chain. That would be a good start.
Many in the temperate West take sustainable water supplies and good industrial stewardship of this vital resource as a given across the world, and that would be a mistake. The problems and politics of water are likely to become more visible and more demanding of managements’ attention.
Managements need to get ahead of these risks. Evolving processes to get more out of less water is going to play a sizable role in sustaining the bottom line, local communities, and value for investors too.
1. Warming waters shift fish communities northward in the artic https://www.climate.gov/news-features/featured-images/warming-waters-shift-fish-communities-northward-arctic
Certain information ©2020 MSCI ESG Research LLC. This report contains “Information” sourced from MSCI ESG Research LLC, or its affiliates or information providers (the “ESG Parties”). The Information may only be used for your internal use, may not be reproduced or redisseminated in any form and may not be used as a basis for or a component of any financial instruments or products or indices. Although they obtain information from sources they consider reliable, none of the ESG Parties warrants or guarantees the originality, accuracy and/or completeness, of any data herein and expressly disclaim all express or implied warranties, including those of merchantability and fitness for a particular purpose. None of the MSCI information is intended to constitute investment advice or a recommendation to make (or refrain from making) any kind of investment decision and may not be relied on as such, nor should it be taken as an indication or guarantee of any future performance, analysis, forecast or prediction. None of the ESG Parties shall have any liability for any errors or omissions in connection with any data herein, or any liability for any direct, indirect, special, punitive, consequential or any other damages (including lost profits) even if notified of the possibility of such damages.
The discussion of any investments in this paper is for illustrative purposes only and there is no assurance that the adviser will make any investments with the same or similar characteristics as any investments presented. The investments identified and described do not represent all of the investments purchased or sold for client accounts. The representative investments discussed were selected based on topics related to our ESG research. The reader should not assume that an investment identified was or will be profitable. There is no assurance that any investments identified will remain in client accounts at the time you receive this document.
Related insights

Staying power: the lasting potential of international equities

International equities: finding growth in shifting markets

“Quitters never win” or do they?

AI Killed the Radio Star?

Masters of their own destiny: how quality companies shape the future
