Unions 101: A review of current labor risks
Quality Growth Boutique
The post-pandemic world ushered in a labor movement revival of sorts. Agitated over age-old concerns on pay and safety, front-line workers around the world raised their collective fists to push for better conditions. In these last few years, companies have faced rising labor costs both to fill vacant positions, and to quell discontent among the existing workforce—from truckers to nurses, factory workers to baristas.
A drive to unionize global companies like Starbucks and Apple certainly makes the headlines. Such visibility has had an energizing impact on organizing efforts worldwide – but not all regions, sectors or companies face the same threat or labor cost crunch. Pay disparities can lead to low morale, low productivity, and high turnover— which ultimately weigh down the value of a franchise. There are companies with a fully unionized headcount that can pass on rising labor costs to end customers. How to tell the difference? In this back-to-basics blog on organized labor, I’ll cover key attributes of unions globally, what’s behind the demands for unions, when higher wages are a threat to the bottom line, and which companies are best placed to manage the risk.
The heyday of labor unions in most developed markets has long since passed. During the past 20 years (and since a membership peak in the 1950s) union members as a proportion of all employees has shrunk across the globe, except North Africa and South America. While tight markets, Covid-19 and inflation sparked a rethink in some pockets (a 2022 Gallup poll that showed union approval in the United States at its highest point since 1965)—the real risk of a labor power resurgence is in developing nations, where collective bargaining is alive and well.
Indeed, there is a relationship between the coverage of collective bargaining within companies and profitability, as shown in Figure 1. The higher the coverage of collective bargaining, the lower the returns. What’s more, the impact of a surprise increase in union membership can be significant for companies not able to pass through the new costs to their customers. I dig into some specifics later.

The risks companies are exposed to are related to how collective bargaining works across the different economies they operate in. The main components include the breadth of so-called extension mechanisms (which can lever the effect of a negotiation across the entire sector of an economy), the influence of union global federations in their industry, the connecting power of social media, and level of discontent amongst workers.
A recent example illustrates what’s at stake for multinationals that downplay labor risk. Teleperformance is the world’s largest call center operator, a tech-savvy Paris-based company with 420,000 global employees, 40% of which are unionized. Even so, a high-profile scandal related to a relatively new “content moderation” business led to a sharp double-digit drop in share value and reputational harm. Media reports about its outsourced policing service against grisly images for social media clients generated genuine concern about the psychological impact on employees and pay, among politicians and investors alike. This issue was related to its operations in Colombia, but it opened the door to the global union federation focused on business services (UNI Global) to successfully obtain management’s acquiescence for a global agreement. How the company’s labor costs will be affected and how much can be passed through to their customers is yet to be seen, but what’s already abundantly known is that working conditions and fair pay are back on the table.
Why workers want to join a union
Unions are independent organizations designed to defend and further the interests of their members through negotiations with employers. Unions slowly evolved in the industrialized economies after countless episodes of violence and suffering helped construct the ‘normal’ working conditions we take for granted in wealthier markets - the 8-hour day, paid sick leave, paid vacations, safe working conditions, the end of child labor. Unions helped reduce the need for blue collar workers to compete against each other for a job, negotiating to the bottom. Unions represent a significant force with approximately 214 million1 members, plus a further 300 million in China under the state-run ACFTU and have great potential for new membership across the developing world.
For workers at the low end of the wealth divide, collective bargaining can deliver straightforward absolutes, such as a living wage and safe working conditions. It’s particularly valuable when there is a lack of enforced regulation – such as protection against fires in textile factories. Scaling up the individual voice to a point where they can disrupt operations dramatically strengthens the hand of workers.
In the wealthier markets however, as many basic worker conditions have become codified into law over time, unions have had to extend their traditional focus to attract workers willing to pay dues to be members. Examples of the angles that have proven popular include 1) closing regulatory gaps between markets (e.g., the US is one of just two OECD nations without countrywide statutory paid sick leave for full-time employees), 2) providing benefits – in northern European markets such as Denmark, Sweden and Finland, unemployment insurance is voluntary and not run by the government, but offered by the unions under the “Ghent system”, 3) skills training, such as the job training facilities managed by carpenters unions across the US, and 4) support workers on gig economy platforms that have been designed legally to circumnavigate traditional employer structures.
Union footprints worldwide
The potential change in costs from union activity at an individual company varies by how unions work in each market. Wages are negotiated several ways ranging from company-by-company (decentralized), through to centralized where outcomes are ‘extended’ across the whole sector or industry. Company-by-company markets include the US, UK, Canada, Japan, China, and Mexico, while most of the European markets have extension mechanisms, including Finland, France, Germany, and Spain.
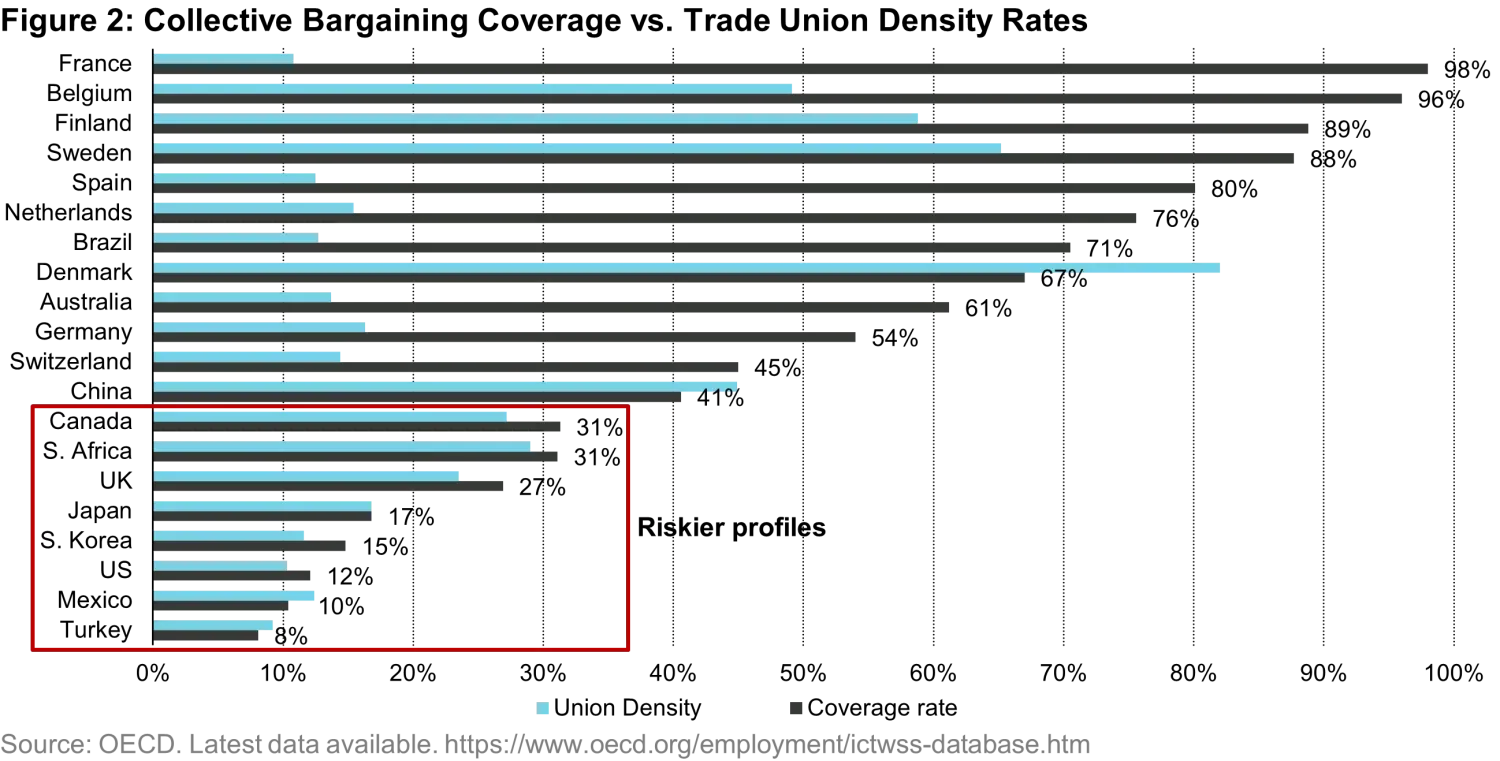
Due to extension mechanisms, there are two measures for the proportion of employees affected by a negotiation. 1) Union density – due paying union members as a proportion of total employees. 2) Coverage rates – proportion of employees under a collective agreement, but not all are union members. These figures can be sharply different, such as in France that has 9% union density and a 98% coverage rate.
What matters to companies is the coverage ratio. If coverage was 100% already, it doesn’t make so much difference for a company if it sees more employees join a union as they are in effect already covered on the big issues such as pay. Figure 2 compares the two measures. Markets with lower density and lower coverage carry greater potential for new costs with rising union density. The advantage with extension mechanisms in a market is that it creates a level playing field domestically. This reduces the incentive to undercut competitors through cutting labor costs – although leaves the door open for non-unionized or imports from low-cost markets. Value add and improved productivity become the focus for companies, as demonstrated by the powerful German engineering exports from a relatively high coverage market. The companies better able to add value have an advantage over lesser skilled labor-intensive industries such as security guards or textile workers.
Leveraging vertical coordination into emerging markets expansion
Unions have gained toeholds in new markets and broadened their presence through national and international federations. Affiliated local unions form national confederations, which in turn can be coordinated by a global federation umbrella organization. Each level brings specialization to negotiate or influence with different counterparties. There are at least nine major international federations, each focused on certain industries.

The powerful international federations are positioned to sign global framework agreements with multinational companies in single markets and, more importantly, across global operations. My sense is that, for investors, these are the organizations to watch as they have the heft and sophistication to support their local affiliated unions to match a multinational across their geographic footprint. The steps the global federations seem to follow are:
- Focus on markets where unions are tolerated
- Find the big employee bases with unhappy workers
- Bring together local unions to form a national confederation with scale
- Once established, support regulation creating extension mechanisms
It’s worth noting there are big union names at the national level too: In the United States, the largest is the AFL-CIO, with around 12.5 million workers, others include the Teamsters (1.2 million members), Service Employees International Union (SEIU - 2 million), and the United Brotherhood of Carpenters (UBC – 0.5 million). For context, the Starbucks stores that voted to unionize did so under Workers United, which is an affiliate of the SEIU at the national confederation level, and of UNI global at the international federation level.
The US labor market – very low coverage
As the world’s largest economy has extremely low levels of union density and coverage, just a quick bit of background. US workers have had a frustrating half century. Globalization and labor price competition in the form of imports, increased automation, and the rise of the gig economy have all contributed. The proportion of American workers in manufacturing jobs (traditionally higher union density) fell from 22% in 1979 to 9% by 2019. So, even though blue-collar American workers have not seen an increase in purchasing power, adjusted for inflation, in 47 years2, the US Bureau of Labor Statistics recorded union participation at 10%3, the lowest level in its recorded history that goes back to 1983 (when it stood at 20%). What gives?
After more than 100 years of union activity, The National Labor Relations Act (1935) gave a federal guarantee that workers could unionize – a solid foundation for unions as industry grew rapidly following WWII. However, with a lack of oversight, union leadership ended up gaining a poor reputation for governance (Jimmy Hoffa et. al.) and manufacturing jobs came under pressure from German and Japanese imports. The straw that seemed to break the camel’s back for the US union movement came in 1981 with a strike by the Professional Air Traffic Controllers Organization (PACTA). PACTA dismissed a generous offer from the administration of a newly elected Ronald Reagan and overplayed their hand and went on strike. Reagan reacted furiously, fired the controllers, and the tide turned. Union density has fallen since supported by significant latitude provided to companies to discourage union organizing. A particularly important structure is the Right to Work laws.
These are state level laws that ensure workers cannot be made to join a union or pay union dues as a condition of employment. 274 of the 50 US states have Right to Work laws in place, covering just over half the population. These laws create state level competition based on lower labor costs. Many Detroit auto union jobs went south to Right to Work states, leaving the city a shell of its former self. So, despite the tight labor conditions, and headline grabbing attempts to organize at companies such as Starbucks and Amazon, little has changed on the ground. It seems this balance is unlikely to change.
Impact on companies
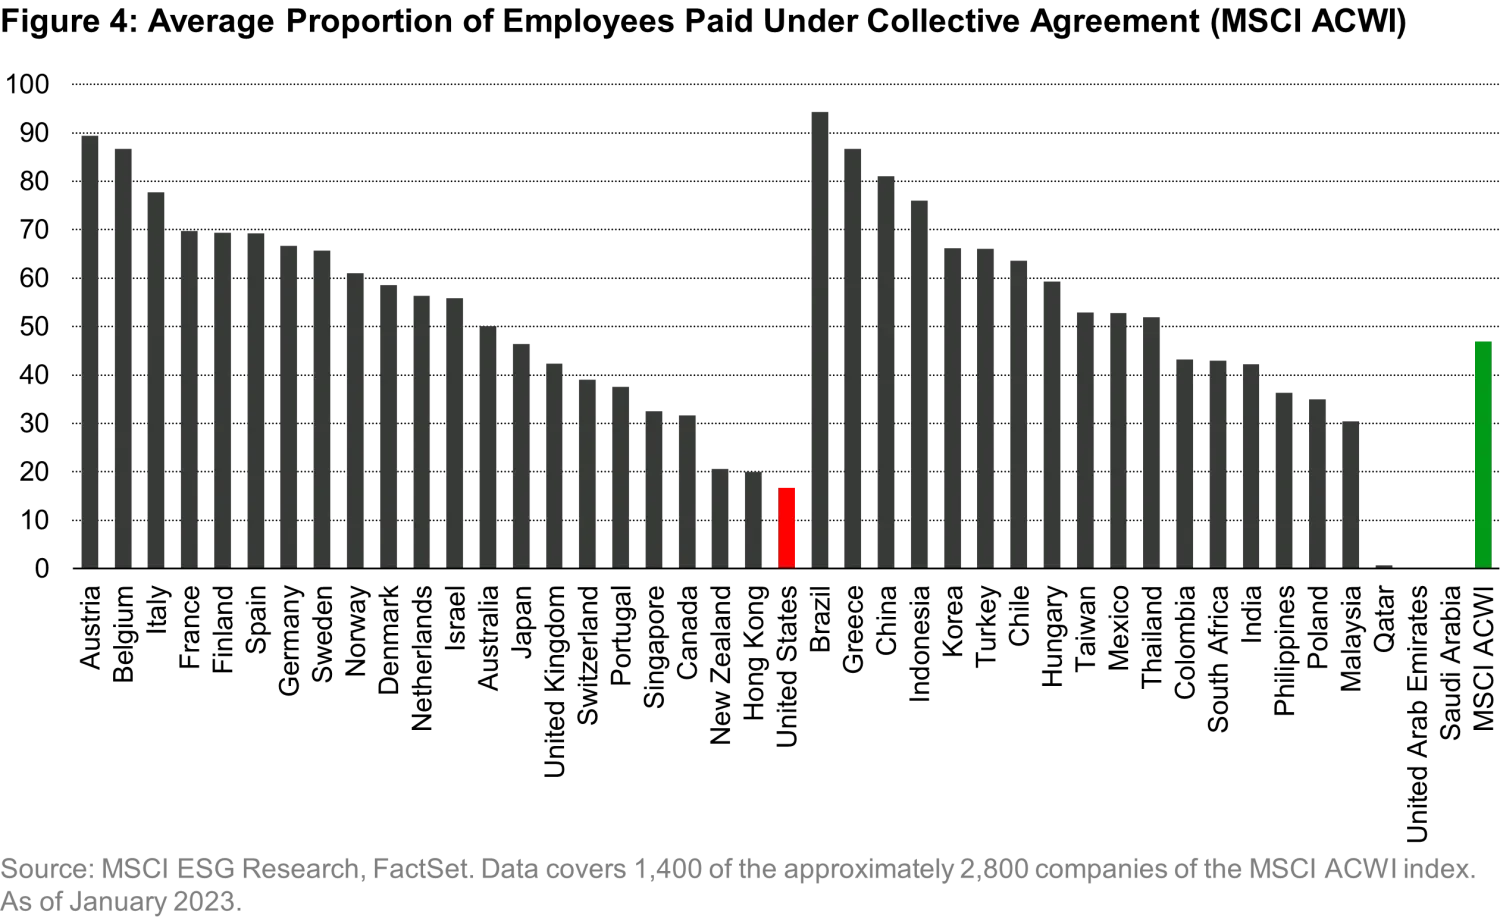
In this section I have used data from MSCI ESG that provides actual and estimated collective bargaining coverage at the company level. Coverage is close to zero in the Middle Eastern markets of Saudi Arabia, UAE and Qatar as unions are not permitted by law. The next lowest is the United States.
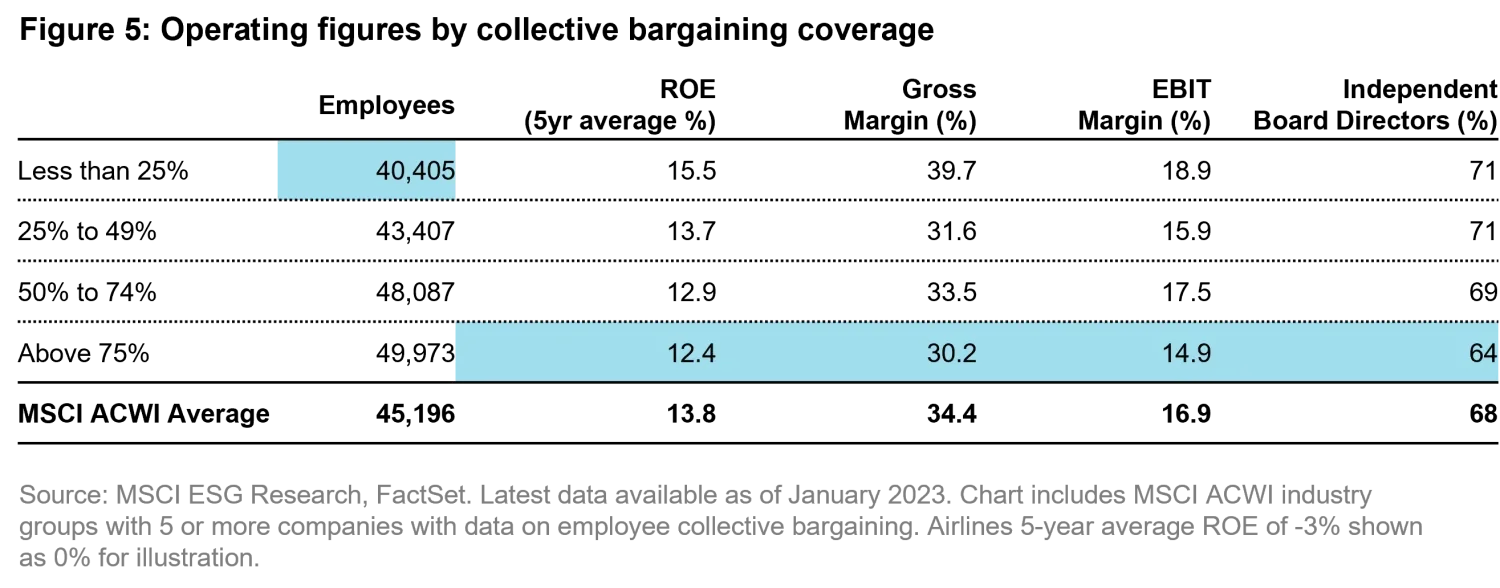
For a sense of how the operating characteristics pan out by coverage at a high level, I split the sample into four groups by their average coverage rates. Figure 5 below shows that the average EBIT margins and Return on Equity (ROE) fall as coverage rises.
Taking a look at how the relationship holds with more granularity, I ran the numbers for profitability against collective bargaining coverage at the industry level (sector sub-categories). The rising line is the trend ‘line of best fit’ for ROE, which is rises as coverage falls.
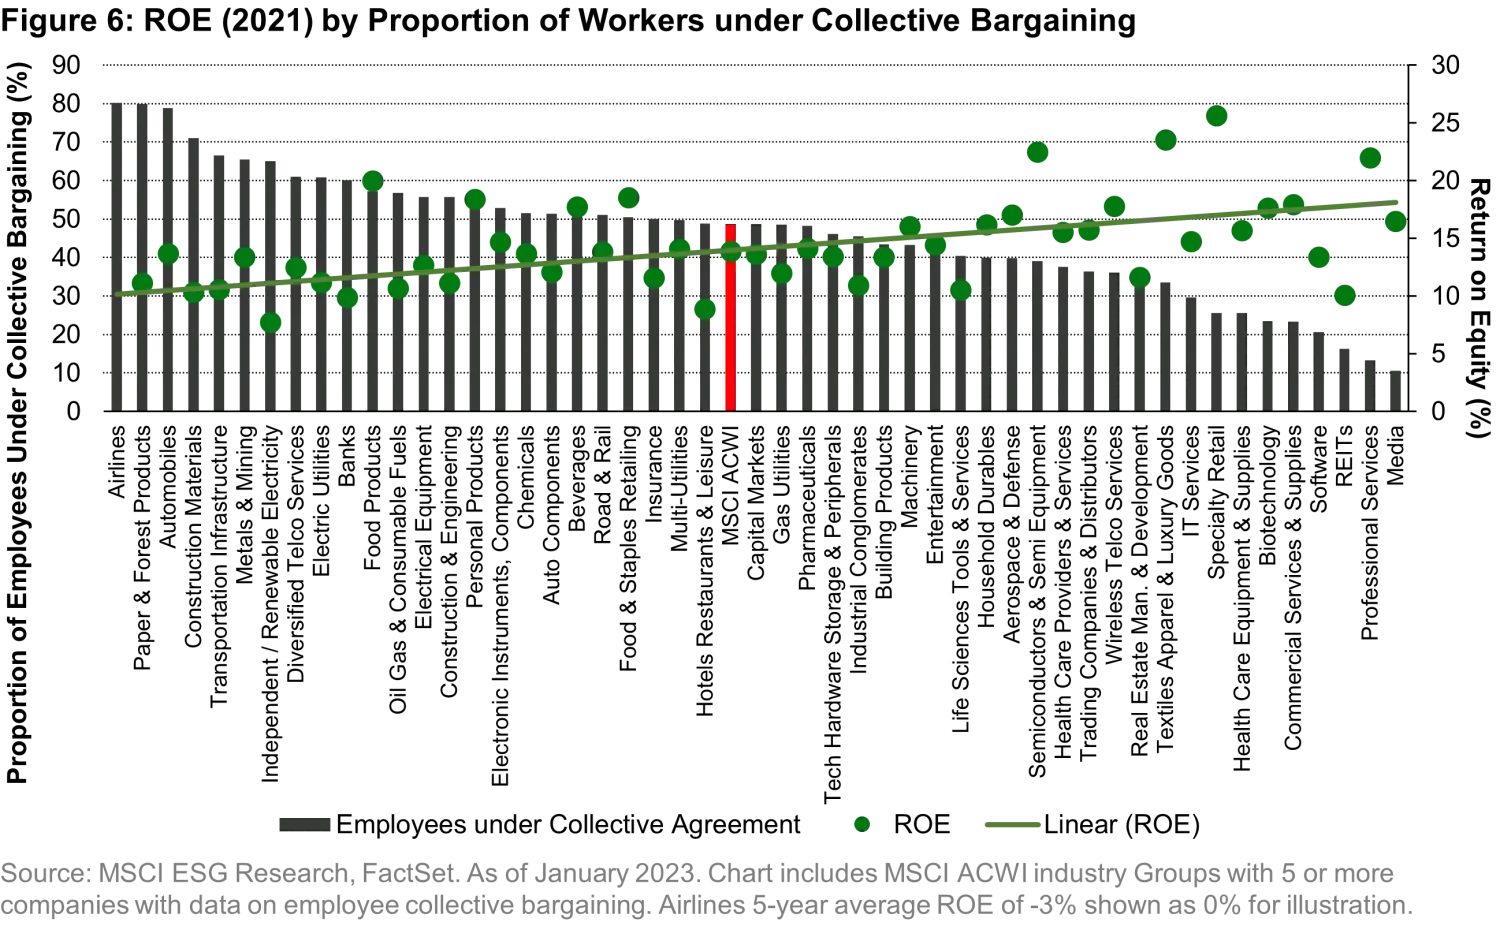
The exceptions to these rules should give an indication of which franchise qualities reduce vulnerability. Pricing power is important. Within the energy sector ROEs run the opposite direction to the overall index, rising with higher coverage. Looking at the top`10 names in the sector by ROE and the why becomes apparent – eight are emerging market-based State-Owned Enterprises (SOEs), and the ninth is a Finnish SOE. Monopoly or oligopoly positioned companies are known for their pricing power.
There are also examples where companies in competitive markets demonstrate they just have a better mousetrap than their competitors. An example is Ambev versus Suntory Beverage & Food. Both are beverage companies. Ambev, Brazil’s largest brewer, generated a 5-year average ROE of 18% with a 100% of its employees paid under collective bargaining. Meanwhile, Suntory Beverage & Food, a Japanese soft-drink maker, had a 10% ROE with just 3% of their employees under collective bargaining.
Red flags
There is no database that can provide a reliable red flag of labor trouble ahead in a timely fashion. News flow of upset employees seems the best canary in the proverbial coal mine. Factors to consider include:
- Extended negative news flow of upset employees
- Country collective bargaining coverage is low, but unions allowed
- Operating in an area with an active union global federation
- Labor costs high as a proportion of the full cost of goods sold
- Low pricing power to pass through additional costs
- Large holdings from ESG funds, which can be quick to exit a problem
- Effectiveness of employees/unions in using social media for impact – companies with B2C end clients generally have more visibility than B2B.
Together these can bring significant pressure to bear on share price aware managements.
Summary
Anywhere large numbers of people have been drawn to a job and ended up deeply unhappy is fertile ground for union pushback – it has been the same since the dawn of industrialization. What’s different now are the tools for organizing and building membership momentum, chiefly social media.
There is a mutual benefit for employees and business owners to find a sustainable balance between needs and wants. For investors, if a company treats its employees well enough to motivate them without a union, the franchise can operate uninterupted by negotiations or avoidable friction. However, for companies not able to pass through pricing, the arrival or large expansion of a union can reduce value. These impacts can be swift: Consider, for instance, how the pandemic altered workplace demands nearly overnight. With tectonic shifts ahead in work flow (new business models) and worker pay increasingly recognized as vital to economic growth, investors can no longer assume that the question of labor is just another line-item cost. Investors need to keep their ear to the ground – labor is big and evolving.
1. ILO working paper ‘Trade Unions in the Balance’ estimate 2019, from 150 countries
2. Source: FRED, Federal Reserve Bank of St. Louis.
3.
https://www.bls.gov/news.release/pdf/union2.pdf
4.
https://www.ncsl.org/labor-and-employment/right-to-work-resources
Important Information: Information, opinions and estimates provided herein are subject to change; not intended to predict actual results; and no assurances are given with respect thereto. Companies discussed herein for illustrative purposes only to help elaborate on the subject matter under discussion. They should not be considered as a reliable indicator of the performance or investment profile of any composite or client account. Further, such information should not be deemed a recommendation to purchase, hold or sell any security nor should any assumption be made as to the profitability or performance of any company identified or security associated with them.
Any projections or forward-looking statements regarding future events or the financial performance of countries, markets and/or investments are based on a variety of estimates and assumptions. Such information should not be regarded as an indication that Vontobel does not consider projections or forecasts to be reliable predictors of future events and they should not be relied upon as such. Actual events or results may differ materially and, as such, undue reliance should not be placed on such forward-looking information. Vontobel reserves the right to make changes and corrections to the information and opinions expressed herein at any time, without notice.
The MSCI data is for internal use only and may not be redistributed or used in connection with creating or offering any securities, financial products or indices. Neither MSCI nor any other third party involved in or related to compiling, computing or creating the MSCI data (the “MSCI Parties”) makes any express or implied warranties or representations with respect to such data (or the results to be obtained by the use thereof), and the MSCI Parties hereby expressly disclaim all warranties of originality, accuracy, completeness, merchantability or fitness for a particular purpose with respect to such data. This report contains “Information” sourced from MSCI ESG Research LLC, or its affiliates or information providers (the “ESG Parties”). Although they obtain information from sources they consider reliable, none of the ESG Parties warrants or guarantees the originality, accuracy and/or completeness, of any data herein. None of the MSCI information is intended to constitute investment advice nor should it be taken as an indication or guarantee of any future performance, analysis, forecast or prediction. Without limiting any of the foregoing, in no event shall any of the MSCI / ESG Parties have any liability for any errors or omissions in connection with any data herein, or any direct, indirect, special, punitive, consequential or any other damages (including lost profits) even if notified of the possibility of such damages.
Related insights

Quality investing: focus on predictable and resilient growth

China Luxury: Green shoots or a structural shift?

Waiting for the “fat pitch”: Lessons from the 2026 Berkshire Hathaway Annual Meeting

Silicon is the new oil: Why the AI compute cycle still has runway

Itchy business: Galderma tackles a vexing problem in dermatology
