Female leadership – what it looks like
Quality Growth Boutique
Last year forty-one women occupied CEO seats in the Fortune 500 – the most ever. While headlines proclaimed 2020 a banner year, C-Suites fail to reflect the available female talent pool let alone the workforce composition at large. And why not? A full-fledged meritocracy is the life blood of competitive businesses as well as a sustainable and balanced society.
For investors, there are significant risks when diversity is ignored both in terms of upside in missed potential and downside from the inefficient allocation of scarce resources. The comment I’ve most often heard over the years when discussing a lack of diversity is that managers want to hire the best female candidate for the position, but a suitable candidate has not yet been found. And yet some of the largest multinationals with complex, sprawling enterprises across jurisdictions and product platforms, seem to have gotten the memo.
When you think of managing large teams across global operations, the capability of management to think ahead, empathize and motivate people is a needle mover for shareholders. Global multi-nationals with women holding the roles of either CEO or Chair or the board, alongside a board of directors of where more than a third are female include: Accenture, Hershey, H&M, Macquarie, Rolls Royce, Sodexo, Starbucks, Swatch, UPS, Walt Disney, the list goes on. The profile of companies under female leadership tends to have notably larger employee bases, manage higher margins and generate more cash flow from their investments than the market average, as I’ll show later.
Why would an investor want to limit the returns from its human capital by not allowing the best to flourish? The answer is they don’t—and increasingly shareholders are paying attention, voicing, and voting for better.
The red flag to a poorly functioning meritocracy is the imbalance in earnings between men and women – and it’s consistent across most of the planet. It’s an indicator of the corrosive problem of women being held back from seniority. Lower ranks are paid less, so average earnings are less. To illustrate: in the United States, female workers represent 47% of the workforce 1, 31% of S&P 500 directors, but just 6% of S&P 500 CEOs. When you look at these numbers, you wonder for a moment if there has been any progress at all over the past two decades. The answer is there has been significant progress – but it’s patchy and in places.
The male/female earnings gap is still sizable. Women in the EU earn an average of $86 2 for each $100 by men, and in the US it’s $83 3. A large contributor to this gap is the ‘motherhood penalty,’ lost income mothers face due to seniority advances withheld, or to leaving altogether due to difficulties balancing their work environment with the needs of being a parent. In low-income countries, the problems go further, compounded by lack of resources, lower education, and conservative traditions towards women. It’s a disturbing issue, as economic power to men can quickly convert to social power – and the unbalanced can become unhinged.
Much can be done to reduce the gap. Training for performance reviewers who affect promotions, paid parental leave, providing for an easy recalibration back into the workplace for mothers, and ensuring women across developing market operations and supply chains are paid a living wage, for starters.
In this blog, I take a look at the where and what are the main reasons behind the imbalances, the profile of women-led companies, and what can help unblock the system. I have largely focused on issues that impact companies as this is within the sphere of influence for investors.
The broken rung
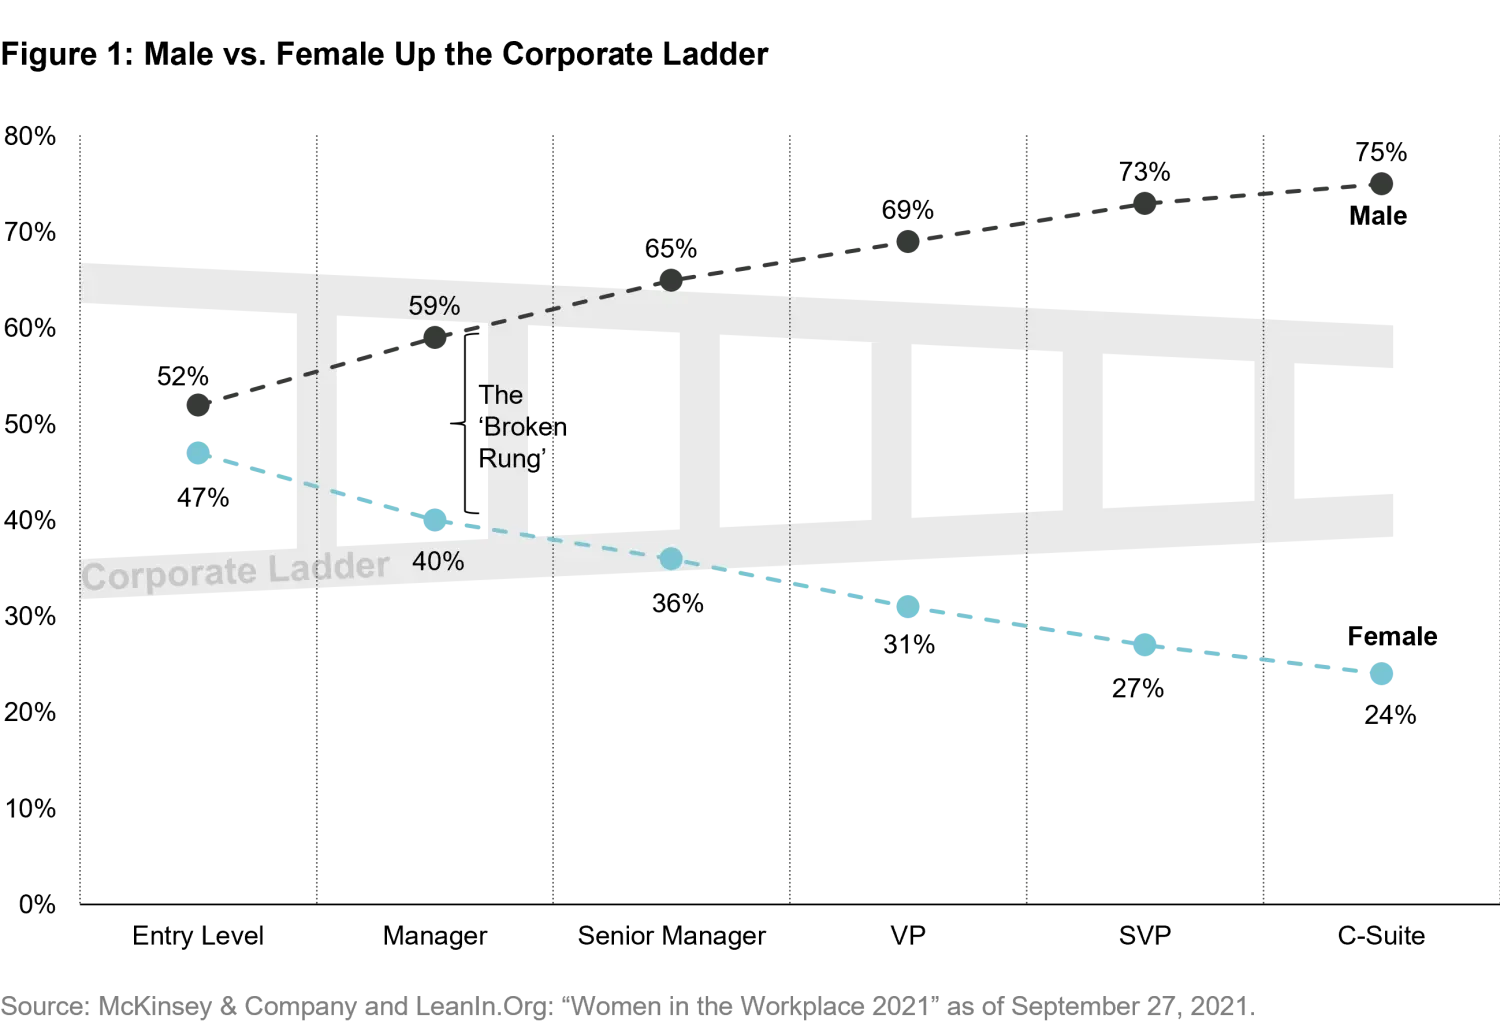
Women earn less than men in most countries. In the United States, women’s $83 for each $100 earned by men in 2020 is better than the $72 made in 1990 (30 years), but it’s still an ugly reality. A main driver of lower average incomes is the gender imbalance through the ranks of companies. And given the compounding effect of lost early-stage promotions, the seniority balance and wage gap rises with age.
‘Broken rung’ is an expression used to highlight the sharp drop in female participation at the first step – from entry level to manager. This is illustrated in the chart below with data from a study by McKinsey and Leanin.Org. It covered more than 65,000 employees, across 423 organizations containing a total of 12 million employees.
Motherhood penalty
The motherhood penalty plays a major role in the male/female earnings gap. Globally, there is an income gap between a new mother and women without dependent children. And the gap tends to increase by number of children, often by an increasing magnitude. Studies from across the world have recorded this penalty. A 2005 analysis 4 of 11 European countries estimated the motherhood pay gap (between mothers and non-mothers) for those with two children: the UK was the worst with a 25% gap followed by Germany at 15%, and Portugal at 10%. In the US, the gap was estimated 5 to widen from 87% to 75% for mothers (2016). And a study across 21 developing markets showed mothers suffering a 16% fall in daily pay in middle income countries 6.
The US Census Bureau 7 published an insightful piece in 2017 comparing the individual earnings of couples after having a child. It showed that the women’s earnings did eventually recover (almost a decade later), but as the male never experienced an initial earnings shock, the earnings gap between the two did not recover. In other words, the woman’s potential was permanently dragged behind due to having a child. With a third of the US labor force made up of mothers, this is a social issue of great magnitude.
Emerging markets, living wage, and the supply chain
Capable people don’t want charity, they just want to get paid fairly. There is some confusion among investors on what constitutes a living wage. The International Labor Organization (ILO) outlines a minimum income as enough for a family to live on with a satisfactory level of social inclusion. In other words, a living wage has an absolute goal – it’s not just relative to the next worst alternative or a fixed-dollar value. In 2019, the median minimum salary worldwide was $486 per month 8 (ppp). However, five countries had minimum salaries below the UN measure of extreme poverty of $1.90 per day per person. This illustrates that the legal minimum is not necessarily a yardstick of acceptability. Rubbing salt into the wound, the ILO estimates 266 million people are paid below their domestic minimum wage. The most exposed include women, mothers, workers with lower education, young workers and rural workers. As women are disproportionately low earners, particularly the less educated, they often see the largest proportional benefit from the introduction of a living wage9.
This problem can slide dangerously towards the issues of modern slavery10. The challenge and answers lie in companies establishing visibility into their supply chains. Investors need to be aware of the risks of suppliers underpaying women to get that T shirt on the shelf at $10.
State of the market for women led companies
At a high level, female leadership of listed companies is notably more prevalent in the developed markets. My numbers find a much stronger correlation between the female leadership in corporations rising with higher GDP-per-capita than to equality of wealth as measured by the Gini Coefficient. It makes sense – there’s value in meritocracy.
Across sectors, Health Care is a diversity leader and Energy a laggard. However, inside the sectors at the sub-sector (or ‘industry’) level there are broad ranges. The lowest scoring industries across the global benchmark MSCI All Country World Index (ACWI) are Marine, Construction and Engineering, and airlines (a bit surprising?). The top scoring are Tobacco, Household Products, and Multi-Utilities, which are utilities with a range of businesses such as electricity distribution, gas, or water.
To measure female leadership influence I have used a simple measure that goes a half step beyond the traditional board representation metric. I did this by blending-in the impact of two roles with outsize influence: Chair of the board and CEO. The ‘Female Leadership’ score11 (FL score) ranges from 0 for the lowest level of female leadership influence, to 10 for the most. It is calculated by assigning 0 or 10 points to three variables. A female CEO or Board Chair gets 10 points each. A further 0, 7 or 10 points are added for the proportion of female board directors (less than 10%, 10-30%, above 30% respectively). Each of the three variables are weighted equally.
As an example, here is the calculation for Walt Disney: Susan Arnold as Chair (10 points), Bob Chapek as CEO (0 points), and 45% of the board directors are women (10 points). Divide each by 3, and add together gives a FL score of 6.6 out of 10 –a decent score.

At a country level there are some striking imbalances. Liberal developed markets return higher scores than the more conservative and emerging markets. Of the 48 countries in the MSCI ACWI, Europe accounts for 8 of the top 10 markets12. The bottom 10 include five from the Middle East, Hungary, Mexico, Korea, Russia and Peru.
Profile of women led companies
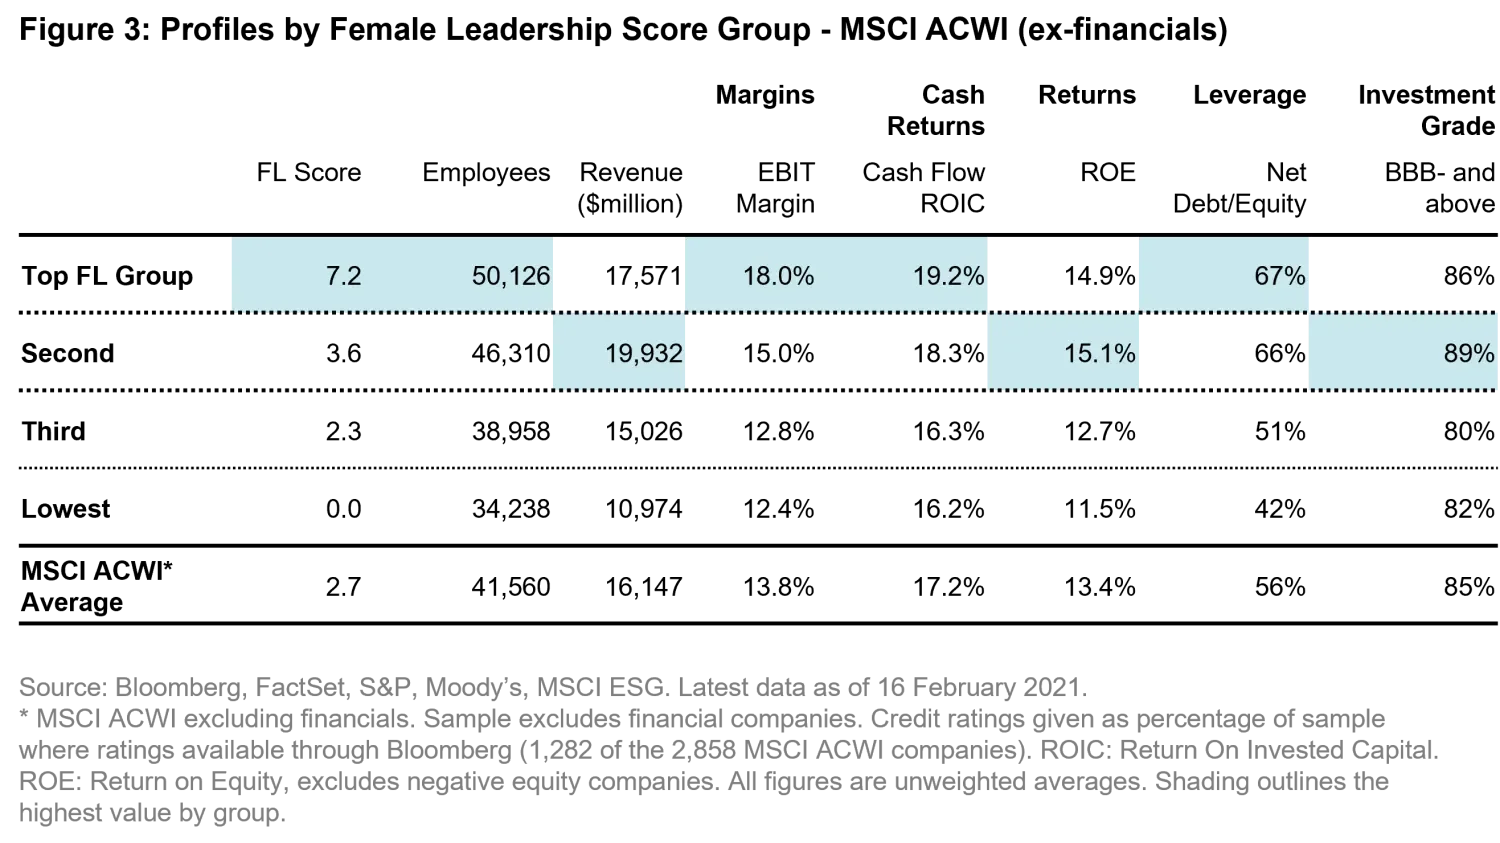
To build a profile of the businesses led by women I grouped the MSCI ACWI companies into four buckets ranked by FL score: Top (Above 6), Second (3-6), Third (2-3), and Lowest (0-2). Each company was equally weighted.
The first observation is that the average of the top tier companies has a large employee base, higher operating margins and cash flow generated from invested capital than the other groups. The earnings drivers alongside a higher average debt level, results in a mid-teens Return on Equity (ROE), which is impressive. While the group’s debt levels are higher than the others, the credit ratings are good with 86% pegged as investment grade (BBB- and above). By exposure, two thirds of this group’s companies are developed markets, in contrast to the bottom group where four-fifths are based in the emerging markets. It also tilts towards the consumer, with consumer discretionary and staples companies making up 30% of the Top group.
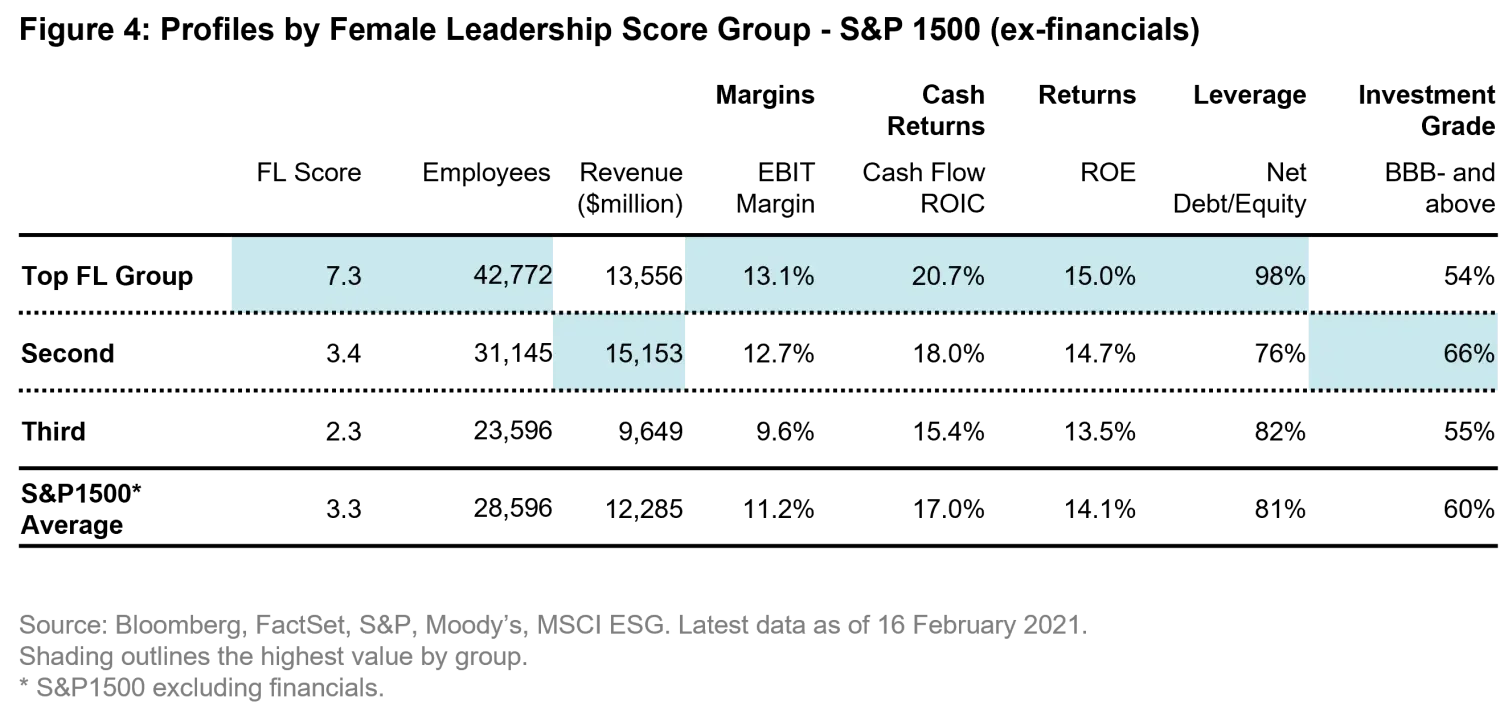
To remove the emerging markets bias, I ran the same figures for the S&P 1500, also excluding financials. I merged the bottom two groups as there were hardly any in the lowest bucket. The operational profile is similar. By far the highest average employee base, alongside high margins and return on equity. The profile of women-run companies is that they are large, profitable, steady growers that run with a little more leverage.
Catalysts for change
- Process is impactful - The process of reducing sub-conscious bias at the hiring and promotion levels, and ongoing mentoring, is key to letting potential evolve. My favorite example of process removing sub-conscious bias is around hiring, rather than promotions – but still applicable. The change in process was pioneered in 1952 by the Boston Symphony Orchestra. There was a heavy male bias in U.S. orchestras. Boston switched from the conductor hand-picking musicians to a process involving blind auditions. With the new set-up musicians played their preliminary auditions behind a screen, concealing their identity and gender. The result was a dramatic increase in the proportion of women hired, which in turn encouraged more to apply. The proportion of women musicians in the top five U.S. orchestras rose from less than 5% in 1970 to 21% in 1993. A study by researchers from Harvard and Princeton estimated 30-55% of the proportion of female new hires were due to the change – and as they put it ‘democratizing’ the process.
- Provide the support mothers need - There is considerable evidence that paid parental leave improves the participation rate of mothers. There are 193 countries in the United Nations, and just a few do not mandate paid parental leave, including: New Guinea, Suriname, a few island nations in the South Pacific, and the U.S… According to data from the Pew Research Center, the U.S. is the only OECD country that does not have a mandated paid leave program for new parents. The average across the OECD was just over 18 weeks in 2018.
- Regulation – in the near term the EU is expected to introduce minimum gender balance board quotas. It appears that the quota will be 40%, in line with the Norwegian requirement introduced in 2008. Outside of Europe mandated board gender quotas are few, but of note India and Israel both require a minimum of one female director on listed company boards.
- Investor pressure – Facing pressure from end investors, asset managers have focused on ESG issues, of which gender diversity is an important topic. There is a good level of self-benefit in pushing for meritocracy – particularly in some of the managerially ‘earlier stage’ markets.
- Better data - Data reflecting the make-up of company’s ranks would be powerful, say, a filing similar to the annual EEO-1 Form in the US. This requires private employers with more than 100 employees to report the breakdown of employee numbers by job category given by gender and race. Companies are not required to publicly disclose their EEO-1s, although some do. It would be good to see this become a required disclosure for all listed companies.
Meritocracy
Both business and society are better off with a fully flowing meritocracy, and this requires diversity. To get there, companies need two things: a leadership culture demanding that the globally most competitive minds are on-board; and internal structures to channel that energy and range of personalities to a shared goal.
Employers that deprive women of moving up and forward are not just limiting potential and talent today, they are also putting limits on role models and mentors and thus leaders for future generations.
1 US Census Bureau
2 Eurostat 2019 gross hourly wages difference between women and men expressed as a percentage of the gross hourly wages of men.
3 Bureau of Labor Statistics 1Q 2021 – median income
4 The family gap in pay in Europe: a cross-country study, by Rhys Davies and Gaelle Pierre, University of Warwick.
5 US Bureau of Labor Statistics 2016
6 Do children reduce their mother’s earnings? Evidence from developing countries, Aguero, Marks, Raykar 2011, University of Connecticut.
7 The parental gender earnings gap in the US, 2017, US Census Bureau
8 Global Wage Report 2020-21, International Labor Organization (ILO)
9 Studies of the impact of minimum salaries on income gaps include: Can minimum wages close the gender wage cap? Evidence from Indonesia by Hallward-Driemeier, Rijklers, and Waxman (World Bank Group), and the Impact of minimum wage increase on gender wage gap: Case of Poland by Majchrowska and Strawinski (University of Lodz, Poland and University of Warsaw, Poland).
10 Modern slavery: a python in the plumbing: https://am.vontobel.com/en/insights/esg-modern-slavery-a-python-in-the-plumbing
11 The Female Leadership score is a proprietary calculation of female leadership influence across publicly traded companies. The value of points assigned to each variable were determined based on our own views and conviction
12 Using unweighted averages.
Disclosure
The discussion of any investments in this paper is for illustrative purposes only and there is no assurance that the adviser will make any investments with the same or similar characteristics as any investments presented. The investments identified and described do not represent all of the investments purchased or sold for client accounts. The representative investments discussed were selected based on topics related to our ESG research. The reader should not assume that an investment identified was or will be profitable. There is no assurance that any investments identified will remain in client accounts at the time you receive this document.
Certain information ©2022 MSCI ESG Research LLC. This report contains “Information” sourced from MSCI ESG Research LLC, or its affiliates or information providers (the “ESG Parties”). The Information may only be used for your internal use, may not be reproduced or redisseminated in any form and may not be used as a basis for or a component of any financial instruments or products or indices. Although they obtain information from sources they consider reliable, none of the ESG Parties warrants or guarantees the originality, accuracy and/or completeness, of any data herein and expressly disclaim all express or implied warranties, including those of merchantability and fitness for a particular purpose. None of the MSCI information is intended to constitute investment advice or a recommendation to make (or refrain from making) any kind of investment decision and may not be relied on as such, nor should it be taken as an indication or guarantee of any future performance, analysis, forecast or prediction. None of the ESG Parties shall have any liability for any errors or omissions in connection with any data herein, or any liability for any direct, indirect, special, punitive, consequential or any other damages (including lost profits) even if notified of the possibility of such damages.
Related insights

Quality investing: focus on predictable and resilient growth

China Luxury: Green shoots or a structural shift?

Waiting for the “fat pitch”: Lessons from the 2026 Berkshire Hathaway Annual Meeting

Silicon is the new oil: Why the AI compute cycle still has runway

Itchy business: Galderma tackles a vexing problem in dermatology
