Global macroeconomic uncertainty continues to rise, marked by US trade policies and relatively tight credit spreads across both developed and emerging markets. In this unpredictable environment, emerging-market investment-grade (EM IG) bonds, an often overlooked asset class, may deserve closer attention. These bonds could offer a compelling alternative for investors seeking long-term income and portfolio resilience.
A subset of hard-currency EM debt, EM IG bonds share similar characteristics with developed-market investment-grade (DM IG) bonds and may provide the added benefits of increased diversification and lower exposure to US macro-driven risks.
Yet, despite their potential, dedicated EM IG strategies are surprisingly scarce. This underrepresentation reflects both the asset class’s rapid evolution over the past few decades and the lingering perception of risks associated with EM, which has slowed the broader adoption of EM IG bonds in core fixed-income portfolios.
EM debt: rapid growth and improving credit quality
Over the past decade, the EM debt universe has expanded significantly, growing from roughly USD 1 trillion to more than USD 3 trillion, with EM corporates ranking among the fastest-growing asset classes globally.
In major sovereign EM indices, the share of IG bonds has risen from less than 10% in the mid-1990s to around 60% today. This shift reflects the adoption of more prudent macroeconomic policies across many EM countries, enabling them to better absorb external shocks and strengthen overall credit quality. The AA/A+ bucket weight has also increased, supported by large issuance volumes from highly rated Gulf countries such as Saudi Arabia. In corporate EM indices, IG issuers today represent roughly two-thirds of market capitalization.
EM IG Corporates: attractive risk/reward profile compared to US IG credit
When comparing annualized returns with annualized volatility over the past decade, EM IG corporates stand out to us as one of the most attractive asset class for investors with a low-risk budget, offering higher returns and lower volatility than US IG credit products.
Over the past decade, EM IG corporate bonds delivered an annualized return of approximately 3.3%, slightly above the 3.1% offered by US IG. More importantly, this return was achieved with significantly lower annualized volatility (4.1% versus 6.7%), as illustrated in Figure 1.
In comparison, EM sovereign IG bonds returned 2.7%, held back by its longer duration, which was a drag during the sharp rise in global interest rates in 2022. However, EM sovereign bonds typically offer greater liquidity, with larger average bond sizes than EM corporates. Interestingly, the relatively lower trading activity in EM IG corporates can act as a defensive feature in periods of heightened market volatility.
From a risk-adjusted perspective, EM IG corporates delivered a higher Sharpe ratio (0.21) compared to US IG over the period. A blended EM IG 50% sovereign / 50% corporate allocation produces a Sharpe ratio of 0.13, comparable to that of US IG at 0.14, offering diversification without sacrificing return per unit of risk.

Resilience during major crises
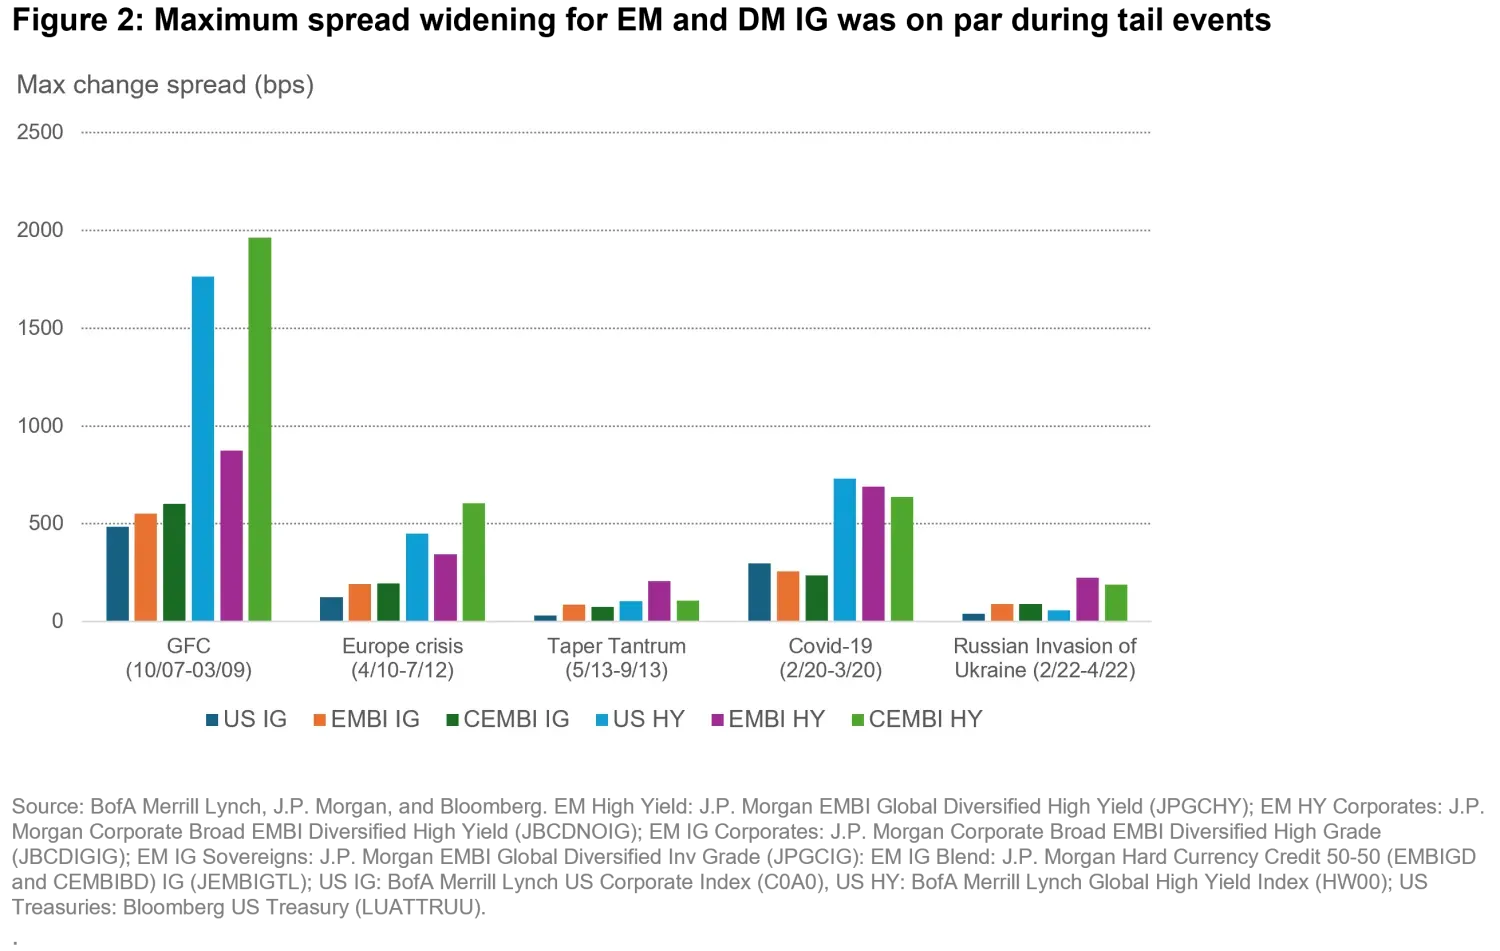
Investments in emerging markets are often perceived as riskier due to political instability, geopolitical tensions, and weaker regulatory frameworks. However, history suggests that EM IG has delivered risk-resilient returns on par with developed market (DM) IG during major shocks. During tail events such as the European debt crisis or the Covid-19 pandemic, the maximum spread widening for EM IG and DM IG indexes was of a similar scale.
Consider the most challenging year on record for the asset class in recent history: 2022. That year, all fixed income markets suffered from a sudden rise in interest rates, and Russia's invasion of Ukraine added further stress. The J.P. Morgan Global Aggregate IG Index (GABI IG), which at the time was composed of more than 90% DM bonds (corporate and sovereign), lost 16.1%. The EM IG 50-50 (corporate-sovereign) reference index underperformed the GABI IG by just 94 basis points (bps). On a three-year horizon (2022–2024), including two years of recovery, the J.P. Morgan EM IG 50-50 outperformed the GABI IG by 502 bps.
Strong fundamentals and broad diversification drive EM IG performance
The strong risk-adjusted returns of EM IG bonds seem to be driven by a diversified composition across regions and issuers, solid underlying fundamentals, and favorable technical factors.
While the US accounts for 73% of the US IG index, EM IG spans 35 countries. From an issuer perspective, quasi-sovereigns and state-owned enterprises often operate in strategic sectors and benefit from explicit or implicit support. EM corporates are spread across diverse sectors such as utilities, infrastructure, and banking, These companies are typically large, regionally systemic players, many operating in regulated markets, adding further stability. Meanwhile, supranational issuers, including development banks, enjoy high credit ratings amid strong shareholder backing, preferred creditor status, and conservative financial policies. Credit quality remains robust. On the sovereign side, many EM countries hold strong external buffers, including substantial foreign exchange reserves and current-account surpluses. On the corporate side, credit metrics are generally healthier than those of DM peers, with net leverage ratios trending lower over time.
Finally, in markets such as Asia and the Middle East, domestic institutions often buy USD-denominated debt issued by their own governments or leading national champions. This provides a local steady demand base that may help limit spread volatility, even when global investors turn risk-averse.
Unlocking value through active management
Despite its strong risk-return profile, EM IG remains significantly underrepresented in actively managed, dedicated strategies. EM corporate bonds are held across a broad mix of investors, including local institutions, crossover investors, and broad-based dedicated EM strategies.
Crossover investors, such as US IG managers, typically maintain only limited exposure, as EM IG represents just about 9% of global IG indices (BofA Merrill Lynch Global Corporate Index (GOBC)). Their holdings are often concentrated in large, liquid issuers with ties to the US that are more familiar to non-dedicated investors.
In contrast, broad EM strategies like EMBI (Emerging Markets Bond Index) and CEMBI (Corporate Emerging Markets Bond Index) invest across the entire credit spectrum, including high yield (HY). For investors with strict investment-grade mandates or tight risk budgets, these strategies are less suitable.
This is why we believe EM IG warrants recognition as a standalone asset class – one that has the potential to offer attractive income and diversification without the usually elevated risks inherent in HY.
What about passive strategies? While they offer efficiency, we believe that the investable EM IG universe is far broader than what most indices capture. Active management has the potential to deliver superior returns by taking advantage of inefficiencies within the asset class.
Today, the average spread differential between EM IG and US IG indices has narrowed to around 30 bps. But spread dispersion within EM IG remains significant. Even when matching EM IG corporates with US IG peers of similar characteristics, spread premiums often exceed 30 bps. This can create a compelling opportunity for active managers to optimize spread exposure and enhance returns through careful selection and diversification.
Compelling yet underappreciated
With strong fundamentals, broad regional and sectoral diversification, and a track record of weathering financial crises, EM IG bonds have evolved into a high-quality asset class, in our view. Despite being underrepresented in dedicated strategies, we find compelling opportunities in EM IG bonds for active managers to optimize spread exposure and enhance return potential through careful selection and diversification.