Bleeding Biodiversity – Measure and React
Quality Growth Boutique
Diversity in an investment portfolio has long been proved a tool for resilience. And so it also goes in biological ecosystems where the greater an abundance of plant and animal life there is, the more of a sustaining balance it provides to Planet Earth. Yet biodiversity is bleeding. It’s diminishing rapidly as our population, wealth and consumption rise. IPBES1, the United Nations body focused on biodiversity, estimates the planet hosts some eight million animal and plant species. Of this, a staggering one million are threatened with extinction. Nature, society, and the health of our portfolios are interlinked.
Biodiversity is obviously vital because the loss of species can threaten food security, the provision of medicine (four billion people rely on natural medicines), bioenergy (two billion people rely on wood fuel), and natural protection from hazards, such as flooding and pests—just to name a few glaring risks. The diverse organisms of the planet provide much to human beings in the service of just basic needs: 75% of food crop types rely on animal pollination, and genetic variety provides millions of potential options against future shocks such as disease or climate change conditions.
It’s not a straight line that links investment excellence and nature. The aim of this note is to shed some light on the main hot spots, and how investors can build a framework to understand which companies may face risks that are not well considered by the market. On the other hand, there are also significant opportunities that continue to arise from changing business and consumer behaviors. Just think about the massive global effort now underway to develop plant-based foods and products, and the popularity of meat alternatives from companies like Los Angeles-based Beyond Meat, or nut and other milk substitutes, like Sweden’s Oatly.
There is a need to provide more benefit from less resources. This includes the reduction of massive waste as well as more efficient products and production methods. Globally a stunning one third of food is wasted largely due to poor process and lack of infrastructure between field and retailers, and by rich world consumers.
The chart below highlights where the main impacts lie across the sectors of the MSCI World Index, which covers the developed markets. This shows the average area of lost biodiversity resulting from a company’s businesses including the impact of their supply chain. It’s measured in km2 (247 acres). Staples stands out from other categories as the sector’s biodiversity impact reflects land use; feeding 7.8 billion people plays a big role in the balance with nature.

I am not a fan of regulation for the sake of it. But there is a clear need for regulation and enforcement around land use—be it in the form of efficiency standards for products, or by creating protected areas. Until those regulatory standards are fully hammered out, however, there is a strong incentive for managements to get ahead of such risks to operations—whether it’s resource depletion, driving a drastic change in consumer tastes and habits, or more strident rules—and turn scrutiny on biodiversity issues into an opportunity.
By the statistics
Biodiversity data tells a frightening story of ecological fragility. The WWF’s Living Planet Index registered a shocking fall of 68% in the average population size of the 4,392 vertebrate species it tracked between 1970 and 2016. The table below outlines a range of species and the threats they face.
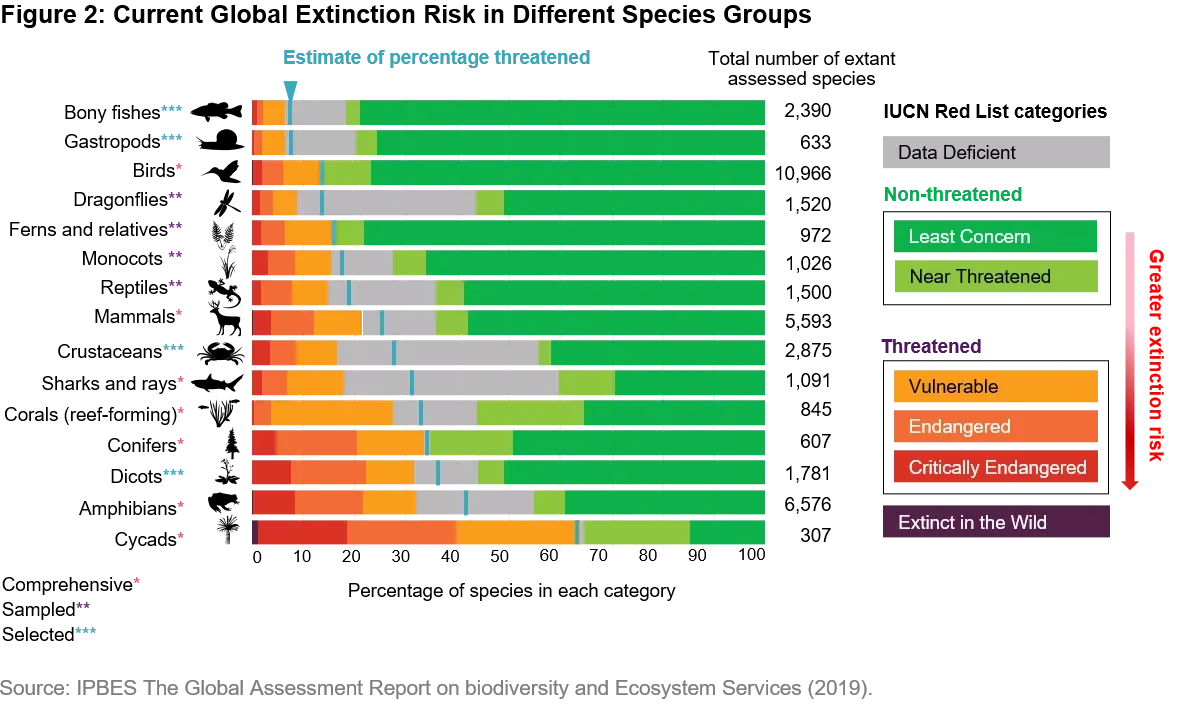
The primary culprits that have eliminated biodiversity from the planet is change of land use from natural habitat into agriculture. This is followed by overexploitation, such as over-fishing or harvesting, and the impacts from invasive species and disease. To date, climate change has not played a big role, but will certainly add additional stress to the equation.
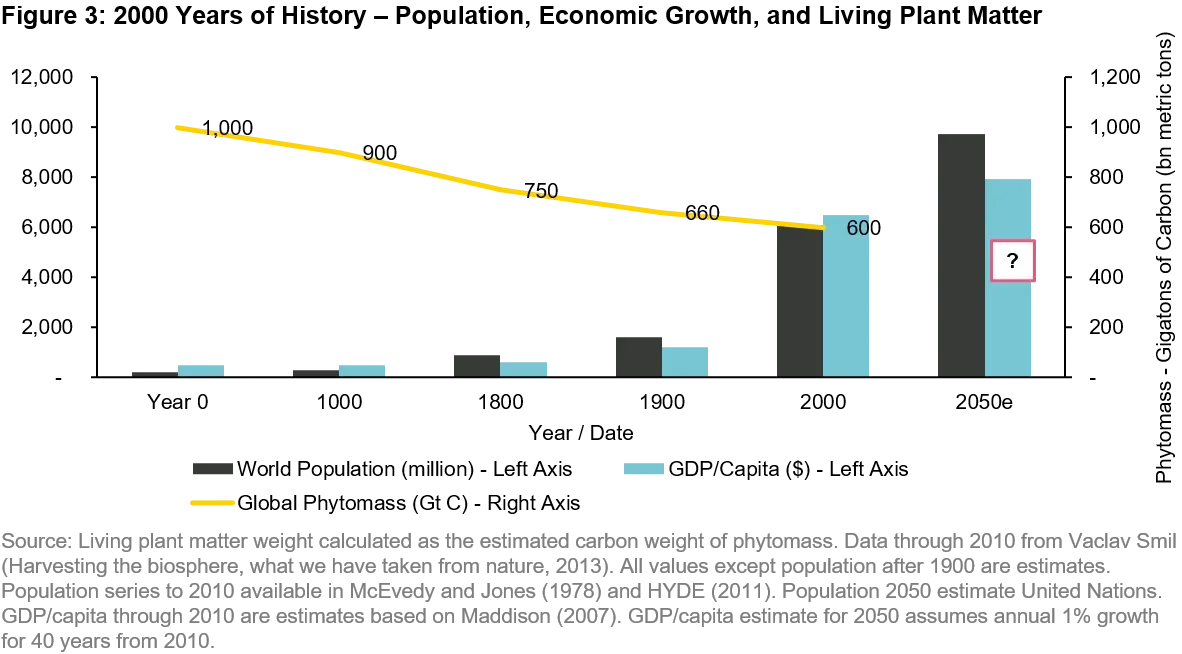
Consumption has placed significant pressure on nature’s ability to replenish stocks and keep pace, with the way we currently extract resources. Since 1970, global population has doubled to 7.8 billion and economic activity (GDP) has multiplied four times to $85 trillion2. Despite this economic prosperity the FAO3 2021 food security report highlighted that almost one in three people across the globe did not have access to sufficient food in 2020.
The chart below outlines the long-term relationship between population growth, wealth and the loss of natural habitat. The data is based on academic research from Vaclav Smil of the University of Manitoba, alongside the deep history economic estimates from the Maddison Database at the University of Groningen. It is notable from the estimates that from Year 0 to Year 1000 the weight of carbon in living plant matter fell by 100 billion tons.5 Over the next 800 years, it fell a further 150 billion tons. The next 150 billion tons only took 200 years, ending 20004. Where it might go with unchecked consumption, should population rise a further 25% by 2050, as forecast by the United Nations, is a truly uncomfortable thought.
In terms of how the world’s land is divided, the WWF estimates that natural habitat (excluding rock and barren areas) now occupies just 16% of all ice-free land. Just 16% — that’s not much of a buffer. The main uses for land are as follows: pasture (37%), managed forests/timber/ plantations (22%) and Cropland (12%). Just 1% is built on.
An example of how leveraged the risk from losing biodiversity can be stems from agriculture’s focus on a narrow set of species. With almost 400,000 plant species across the planet, just nine account for 66% of all crop production . The genetic diversity found in nature are vital tools for dealing with threats from disease or pests. This is illustrated by the popular Cavendish banana: It’s the dominant agricultural species with approximately 55 million tons grown annually . They have no seeds and are bred by planting off shoots of a parent plant, and as a result are identical. But a new strain of the Panama disease has been killing Cavendish plants. As these plants have no variety, there is no known way to stop the spread of the disease. It’s gotten to a point now that a new variety must be developed and planted or there will be significant impact to many rural jobs across South America and the Caribbean.
Low hanging fruit
The first area of low hanging fruit is to reduce the massive waste from current production. Another is reducing the use of land and fresh water across the supply chain globally.
Waste: an estimated 30% of the food produced worldwide is wasted according to the FAO. This equates to approximately 1.3 billion tons a year, most of which did not need to be grown. Waste is measured in two parts – food loss (production) and food waste (retail and consumer). Waste varies by product and level of market development. In the developed markets, most waste happens at the consumer end. In the emerging markets, a much higher proportion is from losses along the food chain.
To illustrate, in the US, food is the single largest item going into US municipal landfills. The EPA estimated a mind-blowing 218lbs of food per person was wasted in 2010. Food discarded close to sell by dates, and poor planning by consumers (to whom food is a low cost item) are significant issues that can seem mundane – it should be easier to correct than moving mountains. In India however, large food losses stem from the lack of a chain of cold storage between the farms and the customer purchase – alongside a Dickensian wholesale system with multiple middlemen knocking produce around.
Lower income markets need better coordination between farmers, wholesalers and retailers to support better infrastructure and lower costs. In the developed markets, retailers have an important role in reducing waste as do consumers, who need to get educated on the costs associated with throwing out so much stuff.
Efficiency: it is quite well understood (as many vegetarians will tell you) that vegetables, grains and pulses take less land to grow, and generate fewer greenhouse gas (GHG) emissions, than meat for the same number of calories. There is little doubt that shifting diets away from meat would have a considerable impact on land use and GHG emissions.
However, what is less well understood and reason for optimism, is the range of efficiencies between producers. The oft-quoted averages hide the range of numbers on which they are based; importantly, sometimes the ranges overlap. An illuminating study from Oxford University6 compared the amount of land used to produce 100g of protein for a range of products across 38,700 farms and 1,600 processors.
There are broad ranges of efficiency across single products. To illustrate the average versus range issue, the land used by the average beef producer to produce 100g of protein can be compared against better performing beef producers. The 10th percentile producer is the farm that is more efficient than all but the best 10% in the group. The 10th percentile producer in the case of beef, uses 74% less land than the average. Land used and emissions for a number of products is laid out in the table below.
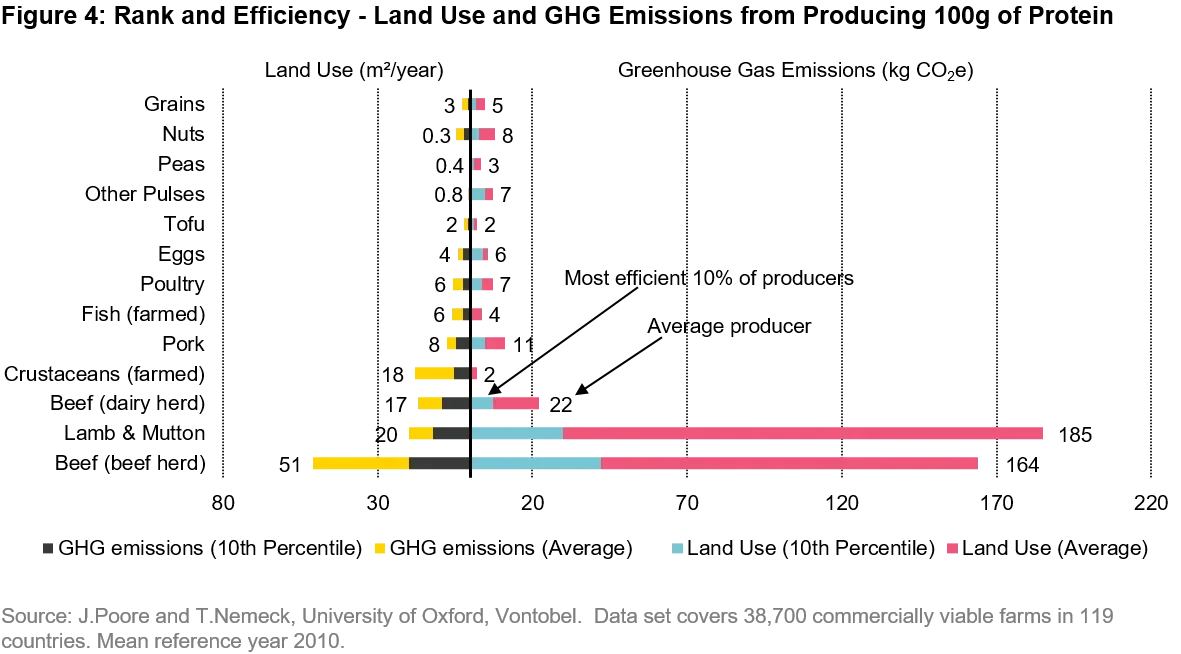
Even accounting for the ranges, the numbers paint a pretty clear picture in most aspects. The efficient 10th percentile producers of beef, lamb/mutton, dairy and pork in this study still use more land and generate more emissions than the average for plant foods. (The one exception was nuts which while low on emissions take a fair amount of space.) However, the 10th percentile poultry producer uses less land and emits less GHGs than the average grain producer. Although figures give no clues about what sized boxes the chickens might live in, nor the efficiency of the feedstock producer that sells to the farmers.
The ranges provide comparisons for best-in-class vs. the least efficient. With tools to measure efficiency, a firm can search for weak spots in its supply chain. Companies exposed to suppliers with the potential to improve yields could then funnel further investment into training, advice, technology and other ventures to generate high returns on investment. Once again, supply chain visibility and a symbiotic relationship with suppliers is critical. The market is losing patience with complaints that establishing the origin of certain commodities is difficult.
Company footprints
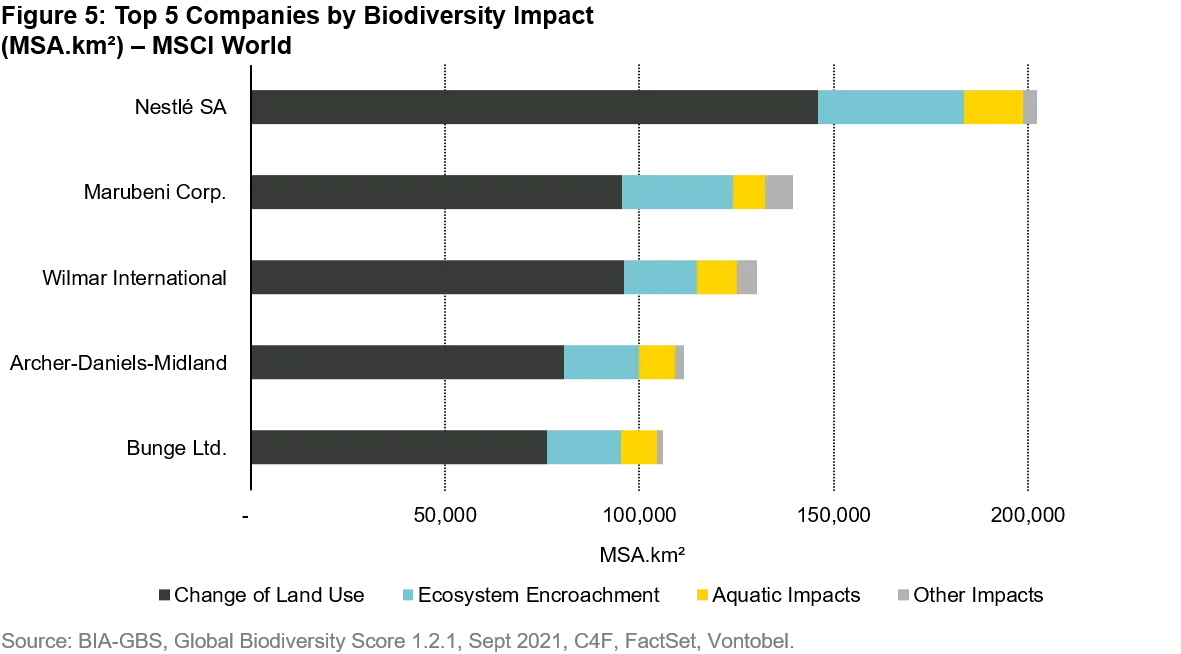
As biodiversity has been primarily impacted by land use, it’s not surprising to see the largest estimated impacts on biodiversity belonging to consumer staples and commodity extractors. In fact, 4 of the top 5 companies with the largest impacts are food companies. While the leading staples companies are globally consolidated and large, there is clearly a link with food retailers too.
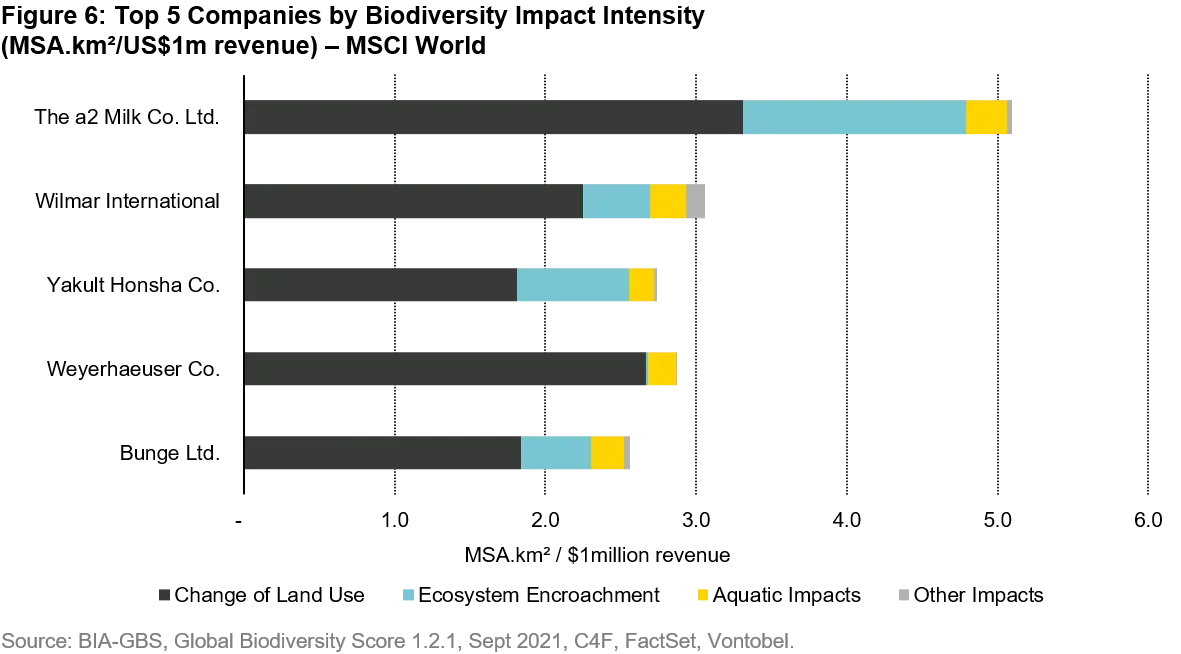
The charts below show estimated impact measured in units of land area multiplied by the percentage reduction in biodiversity from its original state. Known as Mean Species Abundance per km² (247 acres) or in shorthand as MSA.km². The impacts are measured via several so-called pressures that include change in land use and encroachment on ecosystems. The model breaks down the products a company sells into their underlying commodities and assigns biodiversity pressures against each commodity. The impacts are adjusted for the region they were estimated to be sourced from (estimated as this information is not generally made public.) The results need to be taken with caution as the estimates are based on proxies and large corporations may have suppliers that are lower impact than average – but maybe not. But its a good place to start as it provides an indication of exposure, and you can dig from there.
Taking Nestle, the world’s largest food company, as an example. It is estimated to have an overall 202,300 MSA.km² footprint. This includes both its own direct impact from operations, but also the company’s share of its suppliers impacts. The cows of supplier dairies need fields that reduces the biodiversity from its natural state, the cows eat feed that is grown in fields that takes more space, and maybe require fertilizer that impacts living organisms in wetlands or ponds etc.
The first chart is a what-moves-the-needle gauge of scale. On this measure the bigger the company, the bigger the footprint.
The table below shows the companies by the intensity of impact, which divides the footprint (MSA.km²) by revenue to show the number of km² of impact for each $1 million dollars in sales. On this measure, again 4 of the 5 are food companies from the staples sector. Fortunately, this is a sector made up by well-established multi-nationals, a fair number of which have invested heavily in supply chain over the years. But the staples are not alone, and not by a long shot.
Conclusion
Headlines have bombarded us with alarming statements across a range of existential threats – climate change, water security, biodiversity, deforestation. Yet, the supermarkets are well stocked, the air conditioning works, and life goes on for many of us. Nature’s bleeding is poorly understood among investors despite how extremely vital to a prosperous future it is for all of us. The connective threads between natural resources, the supply chain, and good company practice is coming into clearer view with new statistics, the result of new disclosure rules and databases that capture the trends.
Ultimately the goal is to reduce the consumer footprint on biodiversity. Regulations and standards are likely to cost laggards and the heaviest footed the most – just as it is with climate change. Now is the time for investors to grasp the reality of the challenge, and work with managements to understand and address both the risks and opportunities ahead.
1. Intergovernmental science-policy Platform on Biodiversity and Ecosystems Services (IPBES) – similar structure as the IPCC is for climate change.
2. World Bank, growth given in constant 2010 dollars. Global GDP 2020 in current US dollars was $84.7 trillion.
3.FAO: the Food and Agriculture Organization of the United Nations
4. FAO
5. Royal Botanic Gardens Kew -
https://www.kew.org/read-and-watch/bananas-threat-extinction
6.
https://josephpoore.com/Science%20360%206392%20987%20-%20Accepted%20Manuscript.pdf
Disclosure
The discussion of any investments in this paper is for illustrative purposes only and there is no assurance that the adviser will make any investments with the same or similar characteristics as any investments presented. The investments identified and described do not represent all of the investments purchased or sold for client accounts. The representative investments discussed were selected based on topics related to our ESG research. The reader should not assume that an investment identified was or will be profitable. There is no assurance that any investments identified will remain in client accounts at the time you receive this document.
Related insights

Quality investing: focus on predictable and resilient growth

China Luxury: Green shoots or a structural shift?

Waiting for the “fat pitch”: Lessons from the 2026 Berkshire Hathaway Annual Meeting

Silicon is the new oil: Why the AI compute cycle still has runway

Itchy business: Galderma tackles a vexing problem in dermatology
