The UK Savings Ratio: How Far Can It Go?
TwentyFour
Economics can be simple, with easy concepts such as savings equals investment – perfect. But of course the real world has leads and lags as well as all the exceptions to theoretical rules which significantly complicate matters. The Bank of England have just added to the debate about how much of the recent surge in savings will be deployed in the form of consumption as we return to ‘normality’. The question they are asking is how much of the increase in savings is what can be termed ‘precautionary’. Like our current situation this aspect of economic behaviour is relatively unusual and thus impossible to model. It was the identification of precautionary savings which led John Maynard Keynes to realise that encouraging spending by making the return on savings low (in those days through easy monetary policy by way of lower interest rates) may not always work and that fiscal policy may be required to boost an economy. Obviously monetary policy has moved on with the advent of QE and we also have a significant fiscal stimulus as a response to the pandemic. It is also easier for those who have not accumulated any savings over the period to borrow than in Keynes’ day which is another different dynamic.
However, the debate at the Bank of England over how much of the observed savings surge is precautionary does add weight to those in the doves camp when it comes to setting monetary policy stance. The rate has moved from 9.6% in Q1 2020 to 29.1% Q2 2020, a record high since 1987, before coming off in Q3 to 16.9%. Time will tell how this number will move but we think there are two interesting considerations. Firstly, that the Savings Ratio is an average of the economy. Not every person’s Savings Ratio would have increased by these amounts. This is important because the marginal propensity to consume is different for different people. People who earn lower salaries tend to have a higher propensity to consume as they spend a greater percentage of their income in their daily lives and can’t afford to save a lot. The vast majority of the fiscal measures taken during the pandemic were rightly targeted at this group. We do not have data yet for Disposable Income per Income band for 2020 but it could be the case that the group of people that have the highest marginal propensity to consume are the ones that are responsible for the majority of the changes in the Savings Ratio - so it might not be possible for this group to increase their precautionary savings once we go back to normality.
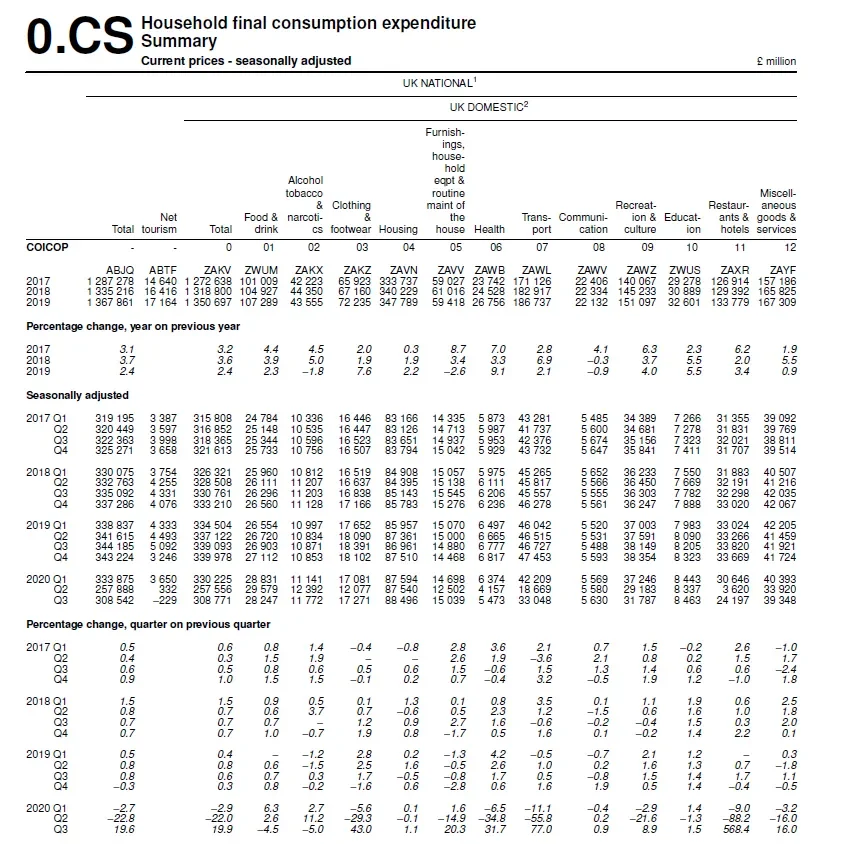
Secondly, it is worth keeping in mind that the Savings Ratio is a ratio equal to Households Disposable Income minus Households Consumption Expenditure divided by the former. If we look at why the ratio has moved we will see that Nominal Disposable Income is actually at the highest point since we have data in Q3 2020. Nominal Household Consumption Expenditure on the other hand was at Q3 2016 levels in the same period. In other words the Consumer can go back to Consumption levels given their current levels of Disposable Income, and in fact if we look at the table below from the ONS’s Quarterly Consumer Trends report that was out last December, we can see that the majority of the variance between Consumption in Q3 2019 vs Q3 2020 can be explained by Transport, Recreation & Culture and Restaurants & Hotels. All these sectors were still facing restrictions due to Covid in this period, meaning that consumers could not have spent the same amounts in these sectors even if they had wanted to. In most sectors where they could still spend, they actually continued to do so.
In conclusion we need more data to assess where the Savings Ratio will end up finding a new level. There are many moving parts that we will continue monitoring but this is certainly a key input in the debate and in future monetary policy decisions.
About the author

About the author
Topics:
Related insights

The three pillars of Multi-Asset Credit at TwentyFour

Flash Fixed Income: Riding the bumps in credit markets

Portfolio Insights: Investment Grade – July 2026

Portfolio Insights: Multi-Sector Bond – July 2026

Portfolio Insights: Asset-Backed Securities – July 2026
