It is our view that without a doubt 2022 was a year to forget for the bond market. Whether you held government bonds, high end corporate credit or riskier high yield paper, you would have taken a knock as steep increases in interest rates across the globe sent bond prices tumbling.
Fast forward to the final few months of 2023, however, and the outlook is now very different. Bonds have once again found their feet with yields significantly higher across the board and a growing sense that Central Bank rate-hiking cycles are edging closer to a finale.
And, while the investment case for all bond instruments is now relatively rosier, some corners of the market look more appealing than others, with short-duration bonds proving particularly compelling.
Inverted yield curves
One of the main contributors of this is that yield curves remain inverted. In normal market conditions, yields for longer-dated bonds are higher than shorter-dated ones, which is logical. Longer-dated bonds, if held to maturity, take longer for the initial investment to be paid back, involve greater risk and should therefore recompense investors with greater yields.
But in current market conditions this appears to not be the case, with the yields on one-year bonds higher than those with maturities of 10 or 30 years. The driver for this inversion is the expectation that central banks will have to lower rates after many months of successive rate hikes to perhaps avoid a hard landing for their economies. We believe that this has provided a significant boost to the yields on short-dated bonds.
The US Federal Reserve held rates in September, but this came after it increased its benchmark rate 11 times in a bid to ease inflation, with the last 25-basis-point rate rise announced in July. This put the federal funds target rate range between 5.25% and 5.50%.
Meanwhile, the president of the European Central Bank, Christine Lagarde, said at the end of September that, although borrowing costs may have reached their peak, they will remain high for as long as it takes to curb inflation.
In mid-September, the ECB hiked interest rates by 25 basis points to 4%, the highest level in the eurozone’s history.
The flatness of yield curves today means by and large there is no additional yield in longer dated credit, so why take the additional capital risk when you can get paid the same yield in short-dated bonds?
The case for short dated corporate bonds
We have found that even greater yields are on offer with short-dated corporate bonds, and by keeping duration low with high credit quality, investors can benefit from very attractive yields with low credit capital risks, even if we do head into recessions globally.
Our investment grade strategies aim to deliver consistent risk-adjusted returns by limiting their investment universe predominantly to securities deemed to be higher quality and at a lower risk of default.
And right now, an added attraction for short-dated corporate bonds is that the current flat yield curves mean, in technical parlance, that ‘breakevens’ are now maximised.
A particular feature of the current flatness of yield curves is that investment grade credit indices of different maturities are offering identical yields, a very rare occurrence.
While the yields are the same, of course the durations are not, which means the breakeven yield of each is then dramatically different. Breakeven yield is a simple concept, it is the rise in yield that is required to have a capital loss that exactly and inversely matches today’s yield of that bond (or index or portfolio). In other words, how much does the yield have to rise to have a capital loss that exactly offsets a year’s worth of yield?
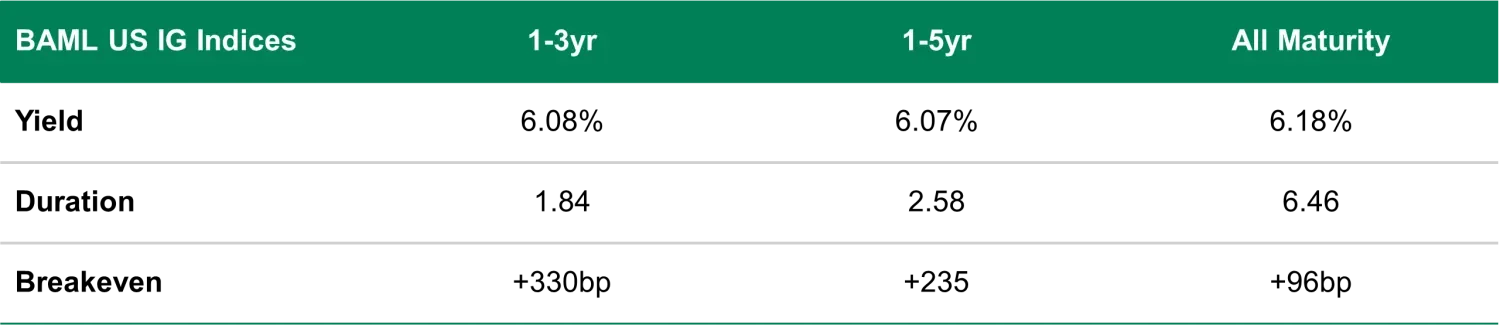
Source: TwentyFour, ICE/BAML; data as at 3 October 2023. Used for illustration purposes only. Capital is at risk when investing. Indices are unmanaged; no fees or expenses are reflected; and one cannot invest directly in an index.
To calculate this number, you simply divide the yield by the duration. So, in the examples above, the numerator is roughly the same in each case, namely 6.08% to 6.18% but the lower denominators (durations) of shorter dated indices mean the breakeven point is far greater for the 1-3Yr index and the 1-5Yr index compared to the All Maturity index.
In current markets, that means the breakeven protection from 1-3Yr IG is +330bp, which means the yield of that index would have to rise to more than 8.8% to have a negative total return over a 12-month horizon. With 1-5Yr IG, the breakeven yield is lower, but still an attractive +235bp, which would still provide protection against rising yields over the next 12 months, where the total yield would have to rise to more than 7.8%.
But the breakeven for the All Maturity index, however, leaves just +96bp of wiggle room against rising yields, taking the yield to 6.5%. This +96bp is within the range of possibilities for just how much higher rates and credit yields could get to over the next 12 months, meaning a greater risk of a zero total return, or even a negative total return, if yields rise by more than +96bp.
The data shows the shorter dated indices would provide far better protection against further volatility and yield rises.
Putting it all together, we believe the combination of keeping duration low (to help protect capital), staying in IG credit (where risk-adjusted returns have been consistently positive, and default risks low), and investing in the front end of the yield curve (where yields can be maximised) is one of the “best games in town” right now.